You can monitor network activities and identify traffic exceptions by querying and analyzing collected log data in real time. This improves security monitoring capabilities and the response efficiency of security events. This topic describes how to use query statements and how to view and analyze query results.
Statement description
Search and analytic statements
A query statement of log analysis consists of a search statement and an analytic statement that are separated by a vertical bar (|).
Search statement|Analytic statementA search statement uses syntax that is specific to Simple Log Service. A search statement is used to query logs that meet specific search conditions and can be separately used. A search statement can contain keywords, numeric values, numeric ranges, spaces, and asterisks (*). If a search statement contains only a space or an asterisk (*), all logs are queried.
Searches are classified into full-text searches and field-specific searches based on the index method. For more information, see Search syntax.
An analytic statement is used to analyze the data in search results and analyze all data in a Logstore. An analytic statement must be executed together with a search statement. If no analytic statement is specified, only query results are returned, and data analysis is not performed. For more information about the syntax and functions of analytic statements, see Log analysis overview.
Common query statements
This section describes common query statements for Cloud Firewall logs and provides examples.
Query statements for traffic statistics
Query the logs of inbound traffic to the internal asset
1.2.*.*over the Internet, and calculate the total volume of inbound traffic and the total number of inbound packets.log_type:internet_log and direction:"in" and dst_ip:1.2.*.* | select sum(in_packet_bytes) as flow, sum(in_packet_count) as packetQuery the traffic statistics on NAT firewalls, and analyze the top 10 inbound traffic volumes and outbound traffic volumes of assets based on source IP addresses, destination IP addresses, and destination ports.
log_type:nat_firewall_log | select src_ip, dst_ip, dst_port, sum(in_packet_bytes) as in_bytes, sum(out_packet_bytes) as out_bytes, sum(total_packet_bytes) as total_bytes group by src_ip, dst_ip, dst_port order by total_bytes desc limit 10
Common statements for access control
Query the logs of inbound traffic that is initiated to internal assets over the Internet and hits access control policies.
log_type:internet_log and direction:"in" and not acl_rule_id:00000000-0000-0000-0000-000000000000If all digits in the value of the
not acl_rule_idfield are 0, access control policies are hit. Otherwise, no access control policies are hit.Query the logs of outbound traffic that is initiated from internal assets over the Internet and blocked by access control policies, and analyze the distribution of the top 10 destination IP addresses and destination ports.
log_type:internet_log and direction:out and not acl_rule_id:00000000-0000-0000-0000-000000000000 and rule_result:drop | select dst_ip, dst_port, count(*) as cnt group by dst_ip, dst_port order by cnt desc limit 10Query the logs of outbound traffic that is initiated from internal assets over the Internet, and uses destination port 443, more than three packets, and an unidentified domain name. If the number of packets is greater than 3, a TCP three-way handshake is complete. Then, analyze the top 10 source IP addresses, destination IP addresses, and applications based on destination CIDR blocks and application names.
log_type:internet_log and direction:out and dst_port:443 and total_packet_count>3 and domain:""| select array_agg(distinct src_ip) as srcip, array_agg(distinct dst_ip) as dstip, slice(split(dst_ip,'.' ,4),1,3) as dstip_c, app_name, COUNT(1) as cnt GROUP by dstip_c,app_name order by cnt desc limit 10
Common statements for attack prevention
Query the logs of inbound traffic that is initiated to internal assets over the Internet and hits protection policies.
log_type:internet_log and direction:"in" and not ips_rule_id:00000000-0000-0000-0000-000000000000If all digits in the value of the
not ips_rule_idfield are 0, protection policies are hit. Otherwise, no protection policies are hit.Query the logs of outbound traffic that is initiated from internal assets over the Internet and hits protection policies. Then, obtain the information about IP addresses, ports, applications, domain names, intrusion prevention system (IPS) policies, and policy hit results.
log_type:internet_log and direction:out and not ips_rule_id:00000000-0000-0000-0000-000000000000 | select src_ip, dst_ip, dst_port,app_name, domain,ips_rule_id, ips_rule_name, rule_result
Procedure
Log on to the Cloud Firewall console.
In the left-side navigation pane, choose . On the Log Analysis page, click the Logs tab.
Click the
 icon in the upper-right corner of the Log Analysis page. On the Query tab, disable the feature or specify a query time range. Optional. By default, when you open the Logs tab, the system automatically performs a log query and displays the query results.
 Enter a query statement in the search box.
A search statement is used to view, search for, and filter logs. A search statement supports only simple query. You can use a search statement to search for specific datasets by using conditions, such as time range, query type, and keywords. You can separately use a search statement. For more information, see Search syntax.
An analytic statement is used to filter, convert, calculate, and aggregate logs. For example, you can use an analytic statement to calculate an average value within a specific period of time or compare data in different time periods. An analytic statement must be used together with a search statement in the
Search statement|Analytic statementformat. For more information about the syntax, see Aggregate functions.
Specify the time range of data that you want to query or analyze. You can use one of the following methods to specify a time range. If you specify a time range in an analytic statement, the time range is used for query and analysis.
ImportantBy default, only 100 rows of data are returned after you execute a query statement. To increase the number of rows of data that are returned, you can use a LIMIT clause. For more information, see LIMIT clause.
In the upper part of the query and analysis page, select a time range from the drop-down list. Example: Last 15 Minutes.
In the analytic statement, use the
__time__field to specify a time range, which is a closed time interval. Example:* | SELECT * FROM log WHERE __time__>1558013658 AND __time__< 1558013660.In the analytic statement, use the from_unixtime or to_unixtime function to convert the format of the specified time. Examples:
* | SELECT * FROM log WHERE from_unixtime(__time__) > from_unixtime(1664186624) AND from_unixtime(__time__) < now()* | SELECT * FROM log WHERE __time__ > to_unixtime(date_parse('2022-10-19 15:46:05', '%Y-%m-%d %H:%i:%s')) AND __time__ < to_unixtime(now())
Click Search & Analyze to view the query and analysis results. For more information, see Query and analyze logs.
View query and analysis results
You can view query and analysis results based on the data displayed in modules such as the histogram or the Raw Logs tab.
If you do not specify a LIMIT clause in an analytic statement, 100 rows of data are returned. If you want to obtain more data, specify a LIMIT clause.
The following section describes how to view the data displayed in the histogram and Raw Logs tab. For more information about other modules, see Query and analyze logs.
Histogram
The histogram displays the distribution of queried logs over time.
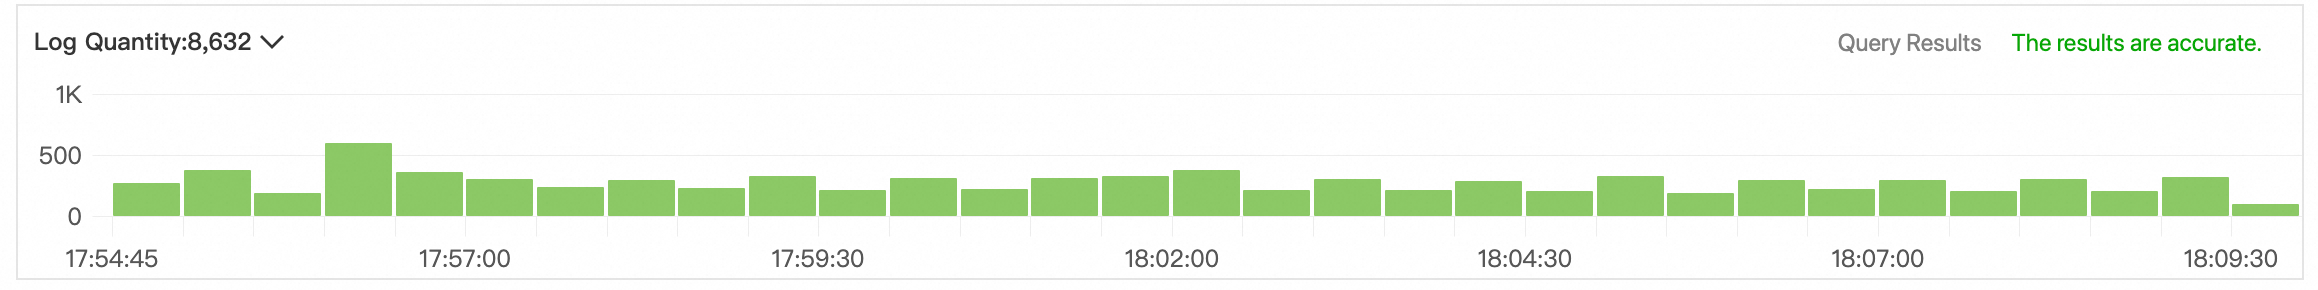
When you move the pointer over a green rectangle, you can view the period of time that is represented by the rectangle and the number of returned logs within the period of time.
If you double-click a green rectangle, you can view log distribution at a fine-grained level. You can also view the returned logs within the specified period of time on the Raw Logs tab.
Raw Logs tab
The Raw Logs tab displays the query and analysis results of logs.
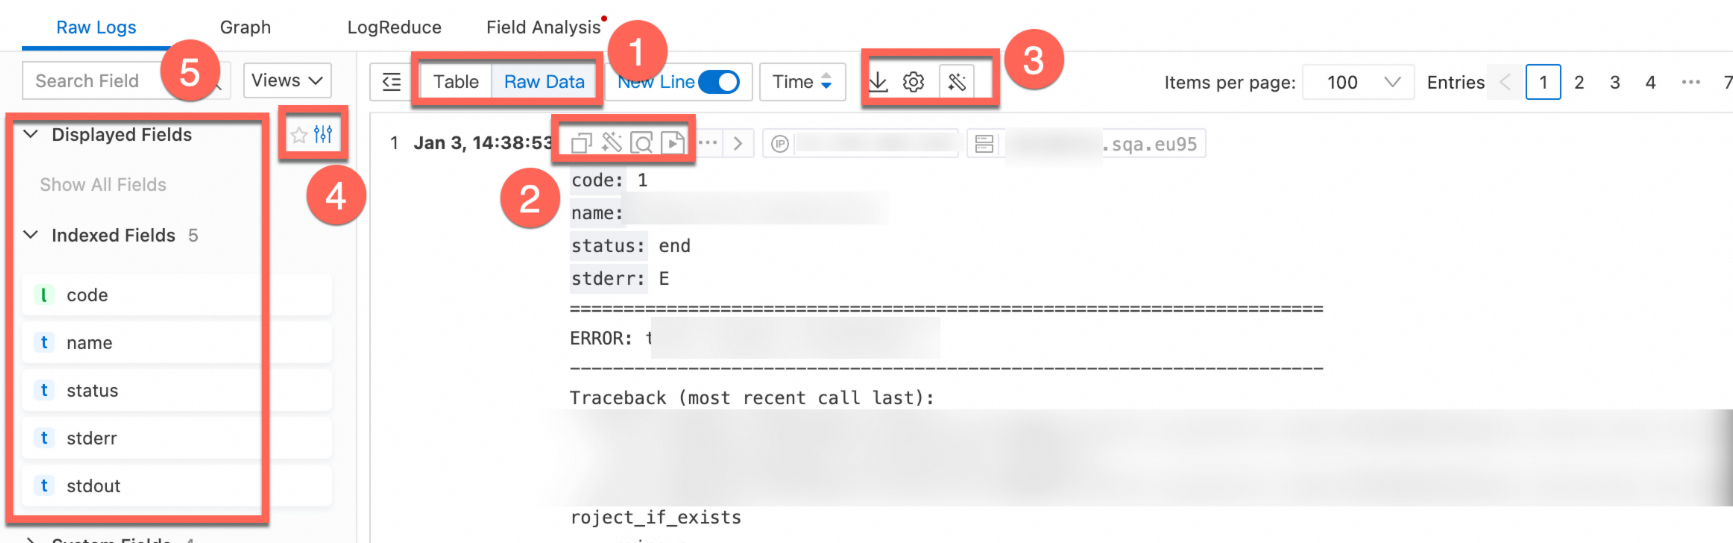
Section | Description |
1 | Switch the display formats of logs and the order of time in which logs are sorted. |
2 | Click the |
3 |
|
4 | View log display fields, index logs, and system fields.
|
5 |
|
6 | View log details. For more information about log fields, see Log fields.
|
What to do next
You can view log fields and the fields that support indexes. For more information, see Log fields.
You can download log query and analysis results to your computer or ship logs to Object Storage Service (OSS) buckets for storage. For more information, see Export logs.
You can use log reports to view statistics such as basic protection metrics of Cloud Firewall, inbound and outbound traffic distribution, and system stability. For more information, see View log reports.
Why do traffic logs record traffic whose application type is Unknown?
Why are traffic logs of ICMP detection periodically sent by Cloud Firewall?