The Outbound Connection page shows the Internet access activity of your service assets. The page displays data such as the source of unusual outbound traffic, the destination Internet addresses that your assets access, outbound connections from public assets, and outbound connections from private assets. This information helps you investigate suspicious assets and ensure business security.
Prerequisites
The Internet firewall must be enabled. For more information, see Internet firewall.
Visualized analysis
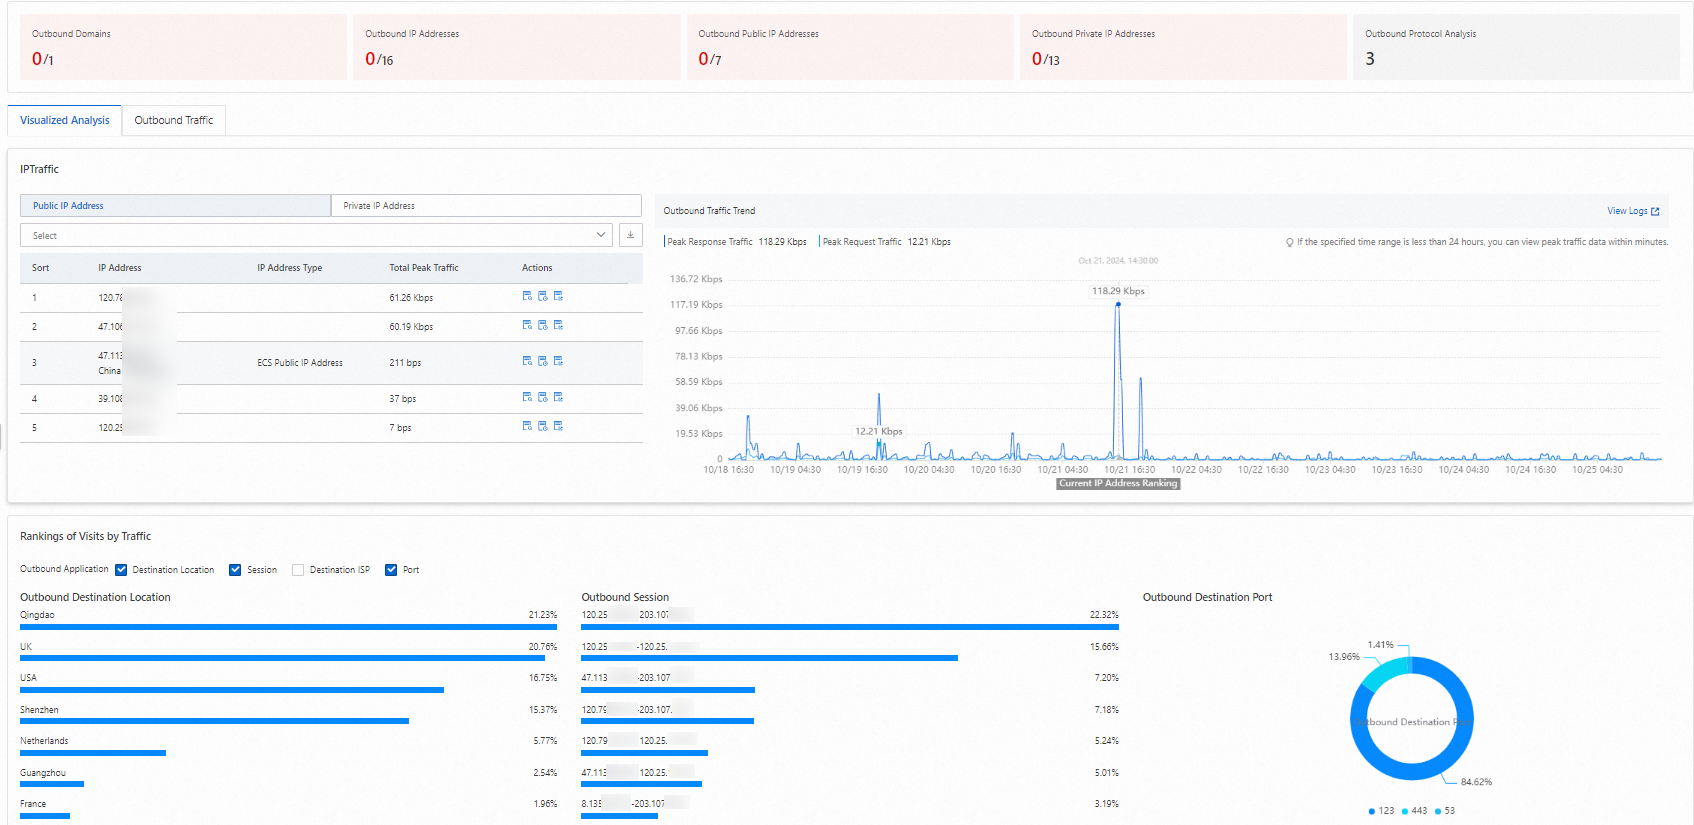
The Visualized Analysis tab displays key metrics such as peak total traffic, traffic trend charts for all IP addresses, and top statistics for outbound traffic. This information helps you monitor the details of outbound traffic from your assets in real time.
Log on to the Cloud Firewall console. In the navigation pane on the left, choose .
In the upper-right corner of the Outbound Connection page, select a time range and click Visualized Analysis.
On the Visualized Analysis tab, view the following information.
Data
Description
Supported operations
IP Traffic
Public IP Address (traffic redirected by the Internet firewall): Displays the peak total response traffic for all public IP addresses, such as the public IP addresses of ECS instances or NAT EIPs, within the specified time range. The results are sorted by response traffic in descending order.
You can use the search tool in the IP traffic table to select a public or private IP address and view its type and peak total traffic.
Click Public IP Address or Private IP Address. All visualized analysis charts automatically switch to display data for the selected asset type. The charts include IP Traffic Trend, Top IP Traffic, and Top 10 Outbound Traffic.
Actions column:
View Logs: Go to the Log Audit page to view the traffic logs for the IP address.
View outreach details: Go to the Outbound Details tab to view the detailed outbound connection data for the IP address.
View Trends: Displays the peak traffic and trend for the IP address in the IP traffic graph.
Export traffic data: Click the
 icon to export traffic data for public and private IP addresses.
Private IP Address (traffic redirected by NAT firewalls): Displays the peak total response traffic for all private IP addresses of ECS instances within the specified time range. The VPCs in which the ECS instances reside must be associated with a NAT Gateway. The results are sorted by response traffic in descending order.
Top 10 Outbound Traffic
Displays statistics for the top 10 destination regions, destination carriers, session percentages, and ports for outbound traffic.
None.
You can click View Logs in the upper-right corner of the list to go to the Log Audit page. On the Traffic Logs tab, you can view the Internet firewall traffic logs. For more information, see Log Audit.
View outbound connection data
The statistics area for outbound connections helps you quickly understand the normal and unusual outbound traffic from your assets. Based on the statistics for unusual traffic, you can perform targeted investigations on the Outbound Traffic tab to promptly secure your outbound traffic.
Log on to the Cloud Firewall console. In the navigation pane on the left, choose .
In the upper-right corner of the Outbound Connection page, select a time range. You can view the following information in the statistics area and on the Outbound Traffic tab.

You can also specify a custom query on the Outbound Traffic tab to search for all traffic data within a 7-day range.
Data
Description
Supported operations
Outbound Domains
The number of at-risk domain names and the total number of domain names that your service assets access on the Internet.
In the data statistics area, click the Outbound Domains or Outbound IP Addresses area to go to the or tab.
You can perform the following operations on detected at-risk domain names or destination IP addresses to protect your assets as needed.
Configure an outbound access control policy to block outbound traffic from assets
Click Configure Access Control Policy to go to the Internet firewall page of Access Control.
For more information, see Configure an access control policy for the Internet firewall.
View the intelligence profile of an outbound domain name or destination IP address to understand the domain names and destination IP addresses that your service assets access
Click View Intelligence Profile to display the analytical data for the domain name or destination IP address.
For more information, see View the intelligence profile of an outbound domain name or destination IP address.
View the details of an outbound domain name to determine if the traffic is required for your services
Click an outbound domain name to view its details.
On the Outbound Public IP Addresses and Outbound Private IP Addresses tabs, view information about the outbound ECS instances. Click View Logs to view the traffic logs on the Log Audit page.
For more information, see Log Audit.
Add to an address book to manage domain names and destination IP addresses in a unified way
Click the
 icon and then click Add to Address Book to go to the address book management page.
For more information, see Manage address books.
Mark as followed to prioritize this data entry
Click the
icon and then click Mark as Followed to mark the data entry with an asterisk.Unfollow
Click Followed in the upper-right corner of the list. In the Followed panel, unfollow the specified destination domain names, destination IP addresses, public asset IP addresses, or private asset IP addresses.
Add to whitelist
Click the
icon and then click Add to Whitelist to add the data entry to the whitelist. The data is no longer analyzed and does not appear in the list.You can add up to 100 entries to the whitelist. The outbound connection whitelist of Cloud Firewall does not support wildcard domain names. It only supports exact-match domain names.
For example, if you add a wildcard domain name (*.example.com) to the outbound connection whitelist, Cloud Firewall still generates alerts for traffic from your service assets to that domain name. Add exact-match domain names to the whitelist.
Remove from whitelist
Click Whitelist in the upper-right corner of the list. In the Whitelist panel, remove a destination domain name or IP address from the whitelist. After it is removed, the data appears in the list.
View traffic log details to further determine if the traffic is required for your services
Click the
icon and then click View Logs to go to the Traffic Logs tab of the Log Audit page.For more information, see Log Audit.
Outbound IP Addresses
The number of at-risk destination IP addresses and the total number of destination IP addresses that your service assets access on the Internet.
Outbound Public IP Addresses
The number of at-risk assets and the total number of assets that initiate outbound connections to the Internet using public IP addresses, such as EIPs.
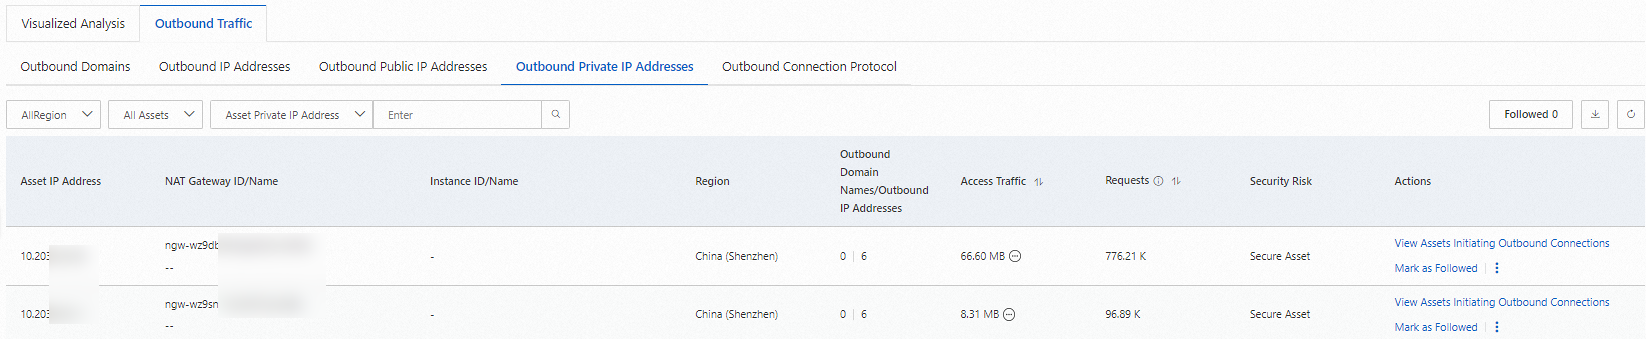
In the data statistics area, click the Outbound Public IP Addresses or Outbound Private IP Addresses area to go to the or tab to view detailed information.
Mark as followed to prioritize this data entry
Click Mark as Followed to mark the data entry with an asterisk.
Unfollow
Click Followed in the upper-right corner of the list. In the Followed panel, unfollow the specified destination domain names, destination IP addresses, public asset IP addresses, or private asset IP addresses.
View traffic log details to further determine if the traffic is required for your services
Click View Logs to go to the Traffic Logs tab of the Log Audit page.
For more information, see Log Audit.
Outbound Private IP Addresses
The number of at-risk private assets and the total number of private assets that initiate outbound connections to the Internet through a NAT Gateway.
Outbound Connection Protocol
The number and percentage of unidentified protocols and all protocols when your service assets access the Internet through application protocols.
In the data statistics area, click the Outbound Protocol Analysis area to go to the tab to view detailed information.
View traffic log details to further determine if the traffic is required for your services: Click View Logs to go to the Traffic Logs tab of the Log Audit page.
For more information, see Log Audit.
NoteOutbound connection protocols include HTTPS, HTTP, MQTT, DNS, Redis, MySQL, Zabbix, RTP, SSH, and MongoDB.
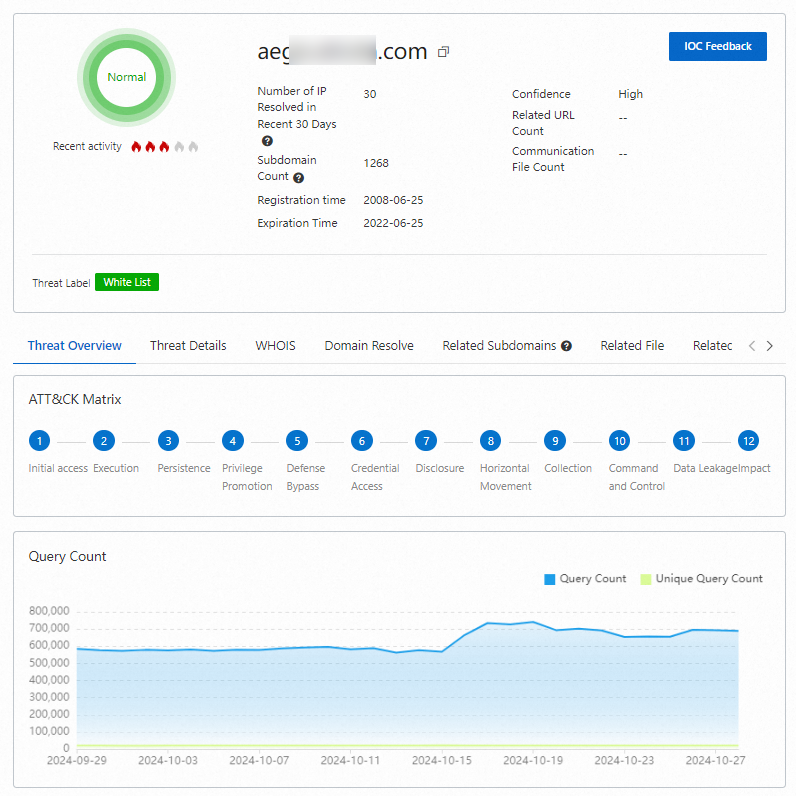
View the intelligence profile of an outbound domain name or destination IP address
On the Outbound Domains or Outbound IP Addresses tab, you can click View Intelligence Profile to display detailed analytical data. This data helps you determine whether the intelligence tags for the outbound domain name or destination IP address of your service asset are accurate.
If an intelligence tag is inaccurate, you can click IOC Feedback to report the issue.
Export outbound connection data
On the Outbound Domains tab, you can click the ![]() icon in the upper-right corner of the list to download the data for outbound domain names, outbound destination IP addresses, outbound public assets, outbound private assets, and outbound connection protocols to your computer in CSV format for further analysis.
icon in the upper-right corner of the list to download the data for outbound domain names, outbound destination IP addresses, outbound public assets, outbound private assets, and outbound connection protocols to your computer in CSV format for further analysis.
References
For more information about the Protected Internet Traffic of Cloud Firewall, see Subscription 2.0 and Pay-as-you-go 2.0.
To view the details of inbound traffic from the Internet to your service assets, see Internet Exposure.
What do I do if my service traffic exceeds the bandwidth supported by Cloud Firewall?
What do the intelligence tags on the Outbound Connection page mean?