ApsaraDB for ClickHouse stores global cluster settings in two configuration files: config.xml and user.xml. This topic explains how to view and modify config.xml parameters from the console, track change history, and revert unsubmitted changes.
To modify user.xml parameters instead, use the SET GLOBAL SQL command — changes take effect immediately without a restart. For details, see Modify user.xml parameters.
XML mode and modification history are available only on Community Edition clusters created after December 1, 2021. Enterprise Edition clusters do not support XML mode.
Potential impacts
While the cluster is in the Changing Configuration or Restarting state, you can only view cluster information. Operations such as upgrades, scale-outs, and scale-ins are unavailable.
If any modified parameters require a restart to take effect, the cluster restarts automatically after you submit the changes. Schedule this operation during off-peak hours to avoid service disruptions.
Modify parameters
For guidance on the prometheus.port and text_log parameters, see Important parameters.
Enterprise Edition
Log on to the ApsaraDB for ClickHouse console.
In the upper-left corner of the page, select the region where the cluster is located.
On the Clusters page, click the Enterprise Edition Clusters tab, and then click the cluster ID.
In the left navigation pane, click Parameter Management.
In the Parameter Value column, click the edit icon
 . Enter a value within the specified range, then click OK.
After modifying parameters, click Submit Parameters in the upper-right corner.
In the Save Settings dialog box, review the changes, enter a reason for the change, and click OK.
If any submitted parameters require a restart, ClickHouse restarts the cluster automatically. Confirm that a restart will not affect your services before proceeding.
After submission, the system validates all parameter values. If a value is invalid, an Error message appears. If the ErrorCode is 102, the value is out of range — return to the previous step, enter a value within the Input Range, and submit again.
Community Edition
Log on to the ApsaraDB for ClickHouse console.
In the upper-left corner of the page, select the region where the cluster is located.
On the Clusters page, click the Clusters of Community-compatible Edition tab, and then click the cluster ID.
In the left navigation pane, click Parameter Configuration.
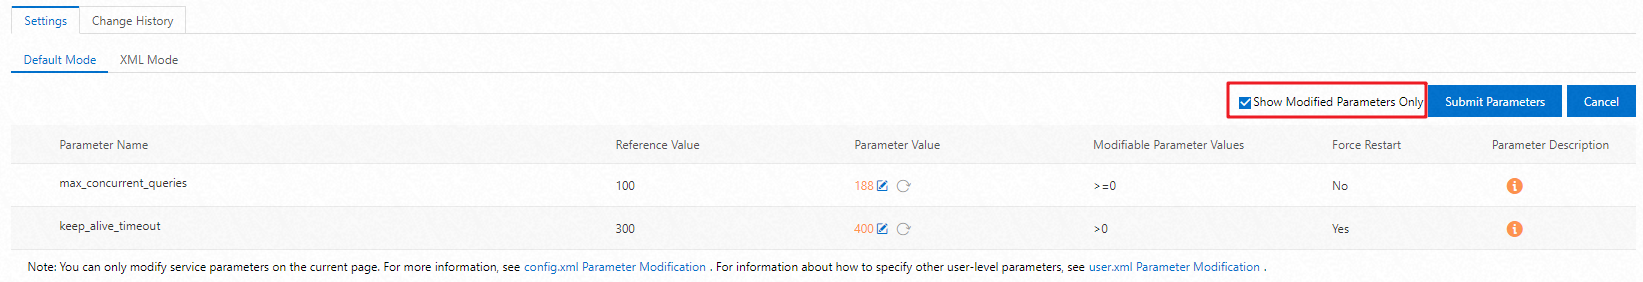
On the Parameter Configuration page, click the Settings tab. Select Default Mode or XML Mode and modify the parameters.
Default mode: In the Parameter Value column, click the edit icon
. Enter a value within the specified range, then click OK.XML mode: In the upper-right corner, click Modify and update the parameters.
ImportantThe
prometheus.portparameter accepts only port numbers in the range 2182–3000.(Optional) In the upper-right corner, select Show Modified Parameters Only to display only parameters that have been changed but not yet submitted.
After modifying parameters, click Submit Parameters in the upper-right corner.
In the Save Settings dialog box, review the changes, enter a reason for the change, and click Submit Parameters.
Important- If any submitted parameters require a restart, ClickHouse restarts the cluster automatically. Confirm that a restart will not affect your services before proceeding. - In XML mode, if a value is invalid, an Error message appears. If the ErrorCode is 102, the value is out of range — return to the previous step, enter a value within the Input Range, and submit again.
Revert changes
You can only revert changes to parameters that have not yet been submitted.
For Community Edition clusters in XML mode and for Enterprise Edition clusters, all changes must be reverted at once — reverting individual parameters is not supported.
To revert changes before submitting:
Revert a single parameter (Community Edition, default mode only): Click the
 icon next to the parameter value. The parameter reverts to its previous value.
Revert all parameters: Click Cancel in the upper-right corner of the parameter list. All unsubmitted changes are discarded.
View modification history
Enterprise Edition
Log on to the ApsaraDB for ClickHouse console.
In the upper-left corner of the page, select the region where the cluster is located.
On the Clusters page, click the Enterprise Edition Clusters tab, and then click the cluster ID.
In the left navigation pane, click Parameter Management.
On the Parameter Management page, click the Change History tab.
View the history using one of the following options:
Click Last 30 Days or Last 7 Days to filter by a preset range.
Select a start time and an end time to filter by a custom range.
Community Edition
Log on to the ApsaraDB for ClickHouse console.
In the upper-left corner of the page, select the region where the cluster is located.
On the Clusters page, click the Clusters of Community-compatible Edition tab, and then click the cluster ID.
In the left navigation pane, click Parameter Configuration.
On the Parameter Configuration page, click the Change History tab.
View the history using one of the following options:

Click Last 30 Days or Last 7 Days to filter by a preset range.
Select a start time and an end time, then click Query to filter by a custom range.
Important parameters
prometheus.port
The prometheus.port parameter accepts only port numbers in the range 2182–3000. This restriction applies in both Enterprise Edition and Community Edition.
text_log
In some cluster versions, text_log is not enabled by default, or text_log.level is set too low to capture meaningful output. Set text_log.level to the appropriate level based on your use case:
| Level | Description | When to use |
|---|---|---|
trace | Most detailed level. Records all operations and events. | Tracing execution flow during development and debugging |
debug | Records function calls and variable statuses. Less verbose than trace. | Debugging a program |
information | Records normal operations and status events, such as service starts and task completions. | N/A |
warning | Flags potential issues or non-fatal errors that may require attention. | Monitoring for potential issues and optimizing the system |
error | Records errors that affect system features or operations and require prompt attention. | Monitoring and diagnosing errors |