The ApsaraDB for ClickHouse Unified Observability service is a high-performance observability solution built on ClickHouse and OpenTelemetry. It seamlessly integrates Logs, Traces, and Metrics to deliver a unified observability experience, enabling developers and operations engineers to track and resolve issues end-to-end without switching between different tools. Additionally, the Unified Observability service includes a built-in intelligent AI assistant for observability data analysis. It can automatically query OTel observability data (Traces/Logs/Metrics), and through SQL queries and structured RCA processes, automatically complete observability troubleshooting and root cause analysis. This topic describes how to use the Unified Observability service.
Prerequisites
An ApsaraDB for ClickHouse cluster has been created.
ApsaraDB for ClickHouse supports one-click activation of Unified Observability.
ApsaraDB for ClickHouse Community-compatible Edition Unified Observability is currently in the invitation-based preview stage. To enable this feature, submit a ticket to contact technical support.
Enable the Service
Log on to the ApsaraDB for ClickHouse console. In the upper-left corner, select the region where the cluster resides.
In the Clusters page, select the instance list of the corresponding version and click the target cluster ID.
In the left-side navigation pane, click All-in-one Observe Suite。
In the dialog box, we recommend that you select Automatically Create Table and Import Sample Data, decide whether to enable Internet access to LLM based on your needs, and then click OK. Enabling the service takes approximately 5 to 10 minutes.
ImportantSelecting the Internet access to LLM option incurs additional fees. Enable it based on your needs.
You can enable Internet access to LLM separately after the service is activated.
Parameter
Description
Auto-create tables
Creates the database
clickobserve_service, and creates the following tables in this database:otel_logs,otel_traces,otel_metrics_gauge,otel_metrics_histogram,otel_metrics_sum,otel_metrics_summary,otel_traces_trace_id_ts,otel_traces_trace_id_ts_mv,otel_metrics_exponential_histogram。
Import sample data
Imports sample data that complies with the OpenTelemetry protocol into the logs, traces, and metrics tables. The data is less than 200 MB before compression.
Internet access to LLM
LLM services can only be accessed through the Internet. Therefore, to use the intelligent AI assistant for observability data, you need to enable Internet access for the Unified Observability service nodes. After you select this option, the system automatically creates an Internet NAT gateway, an Elastic IP Address (EIP), and an SNAT rule under the current account using the VPC to which the current instance belongs. The gateway enables the Unified Observability nodes to access LLM services over the Internet.
Internet NAT gateways and EIPs are billed independently. For NAT gateway billing rules, see NAT Gateway billing. For EIP billing rules, see Billing overview. Both NAT gateway and EIP instances are pay-as-you-go (postpaid). The default EIP bandwidth is 5 Mbps.
If a NAT gateway instance already exists in the current VPC, the system does not create a new NAT gateway. Instead, it only creates a new EIP instance and configures an SNAT rule.
After the service is enabled, if your local IP address is not in the whitelist of the instance, the system prompts you to add it automatically.
Enable Internet Access to LLM
If you did not select Internet access to LLM when enabling the Unified Observability service, the intelligent AI assistant for observability data will not work properly. You can enable this capability after the service is activated by using either of the following methods.
One-Click Enable in the ClickHouse Console
Log on to the ApsaraDB for ClickHouse console. In the upper-left corner, select the region where the cluster resides.
In the Clusters page, select the instance list of the corresponding version and click the target cluster ID.
In the left-side navigation pane, click All-in-one Observe Suite。
In the Internet access prompt bar, click Enable Internet Access to LLM。
The Unified Observability service enters the Internet access enabling status. This process takes approximately 1 to 2 minutes. During this process, the Unified Observability service is inaccessible. The service resumes after the process is complete.
After the process is complete, you can view the automatically created Internet NAT instance ID, EIP instance ID, and EIP public IP address on the Unified Observability page.
Manual Configuration
If you need more flexible network configurations, you can manually create an EIP and a NAT gateway.
Step 1: Create an Elastic IP Address (EIP)
Log on to the Elastic IP Addresses console.
Select the same region as the ClickHouse cluster and create an Elastic IP address instance.
Step 2: Create an Internet NAT Gateway and bind the EIP
If no Internet NAT gateway instance exists in the VPC to which the ClickHouse cluster belongs, click Create Internet NAT Gateway. Select the same region and VPC as the ClickHouse cluster, and select the EIP instance created in Step 1 to bind the EIP.
If an Internet NAT gateway instance already exists in the VPC to which the ClickHouse cluster belongs, on the instance list page of the Internet NAT Gateway console, click More > Bind Elastic IP Address. Select the EIP created in Step 1 to bind the EIP.
Step 3: Create an SNAT Entry
Go to the Internet NAT Gateway page. Go to the details page of the target NAT gateway instance.
Click SNAT Management tab, and then click Create SNAT Entry。
For the SNAT entry granularity, select ECS/ENI Granularity。
In the ECS/ENI option, select the secondary ENI named
rds-eni-<ClickHouse instance ID>-webui.Select the EIP created in Step 1 as the Elastic IP Address.
Click OK. Wait for the SNAT entry to be created.
Public Network Access Resource Release
For business security reasons, when a ClickHouse instance is released, the NAT gateway and EIP instances created for public network access will not be automatically deleted. After releasing the instance, you need to manually release these resources in the respective consoles.
Resource Release:
For one-click enabled public network resources
The NAT gateway and EIP resources automatically created by the Unified Observability service can be filtered and deleted by using the tag
createdby:<instance ID>.For manually created public network resources
You need to determine whether to delete them based on your business usage.
Usage
Main Page
In the left-side navigation pane of the instance details page, click All-in-one Observe Suite. Follow the prompt at the top of the page to go to the service main page.
Enter the username and password to log on to the main page. To create a database account, see Manage database accounts for Enterprise Edition or Manage database accounts for Community-compatible Edition。
After you log on, you are directed to the main page (search page). You can select the data source, set the time range, and specify filter conditions to query data at the top of the page.
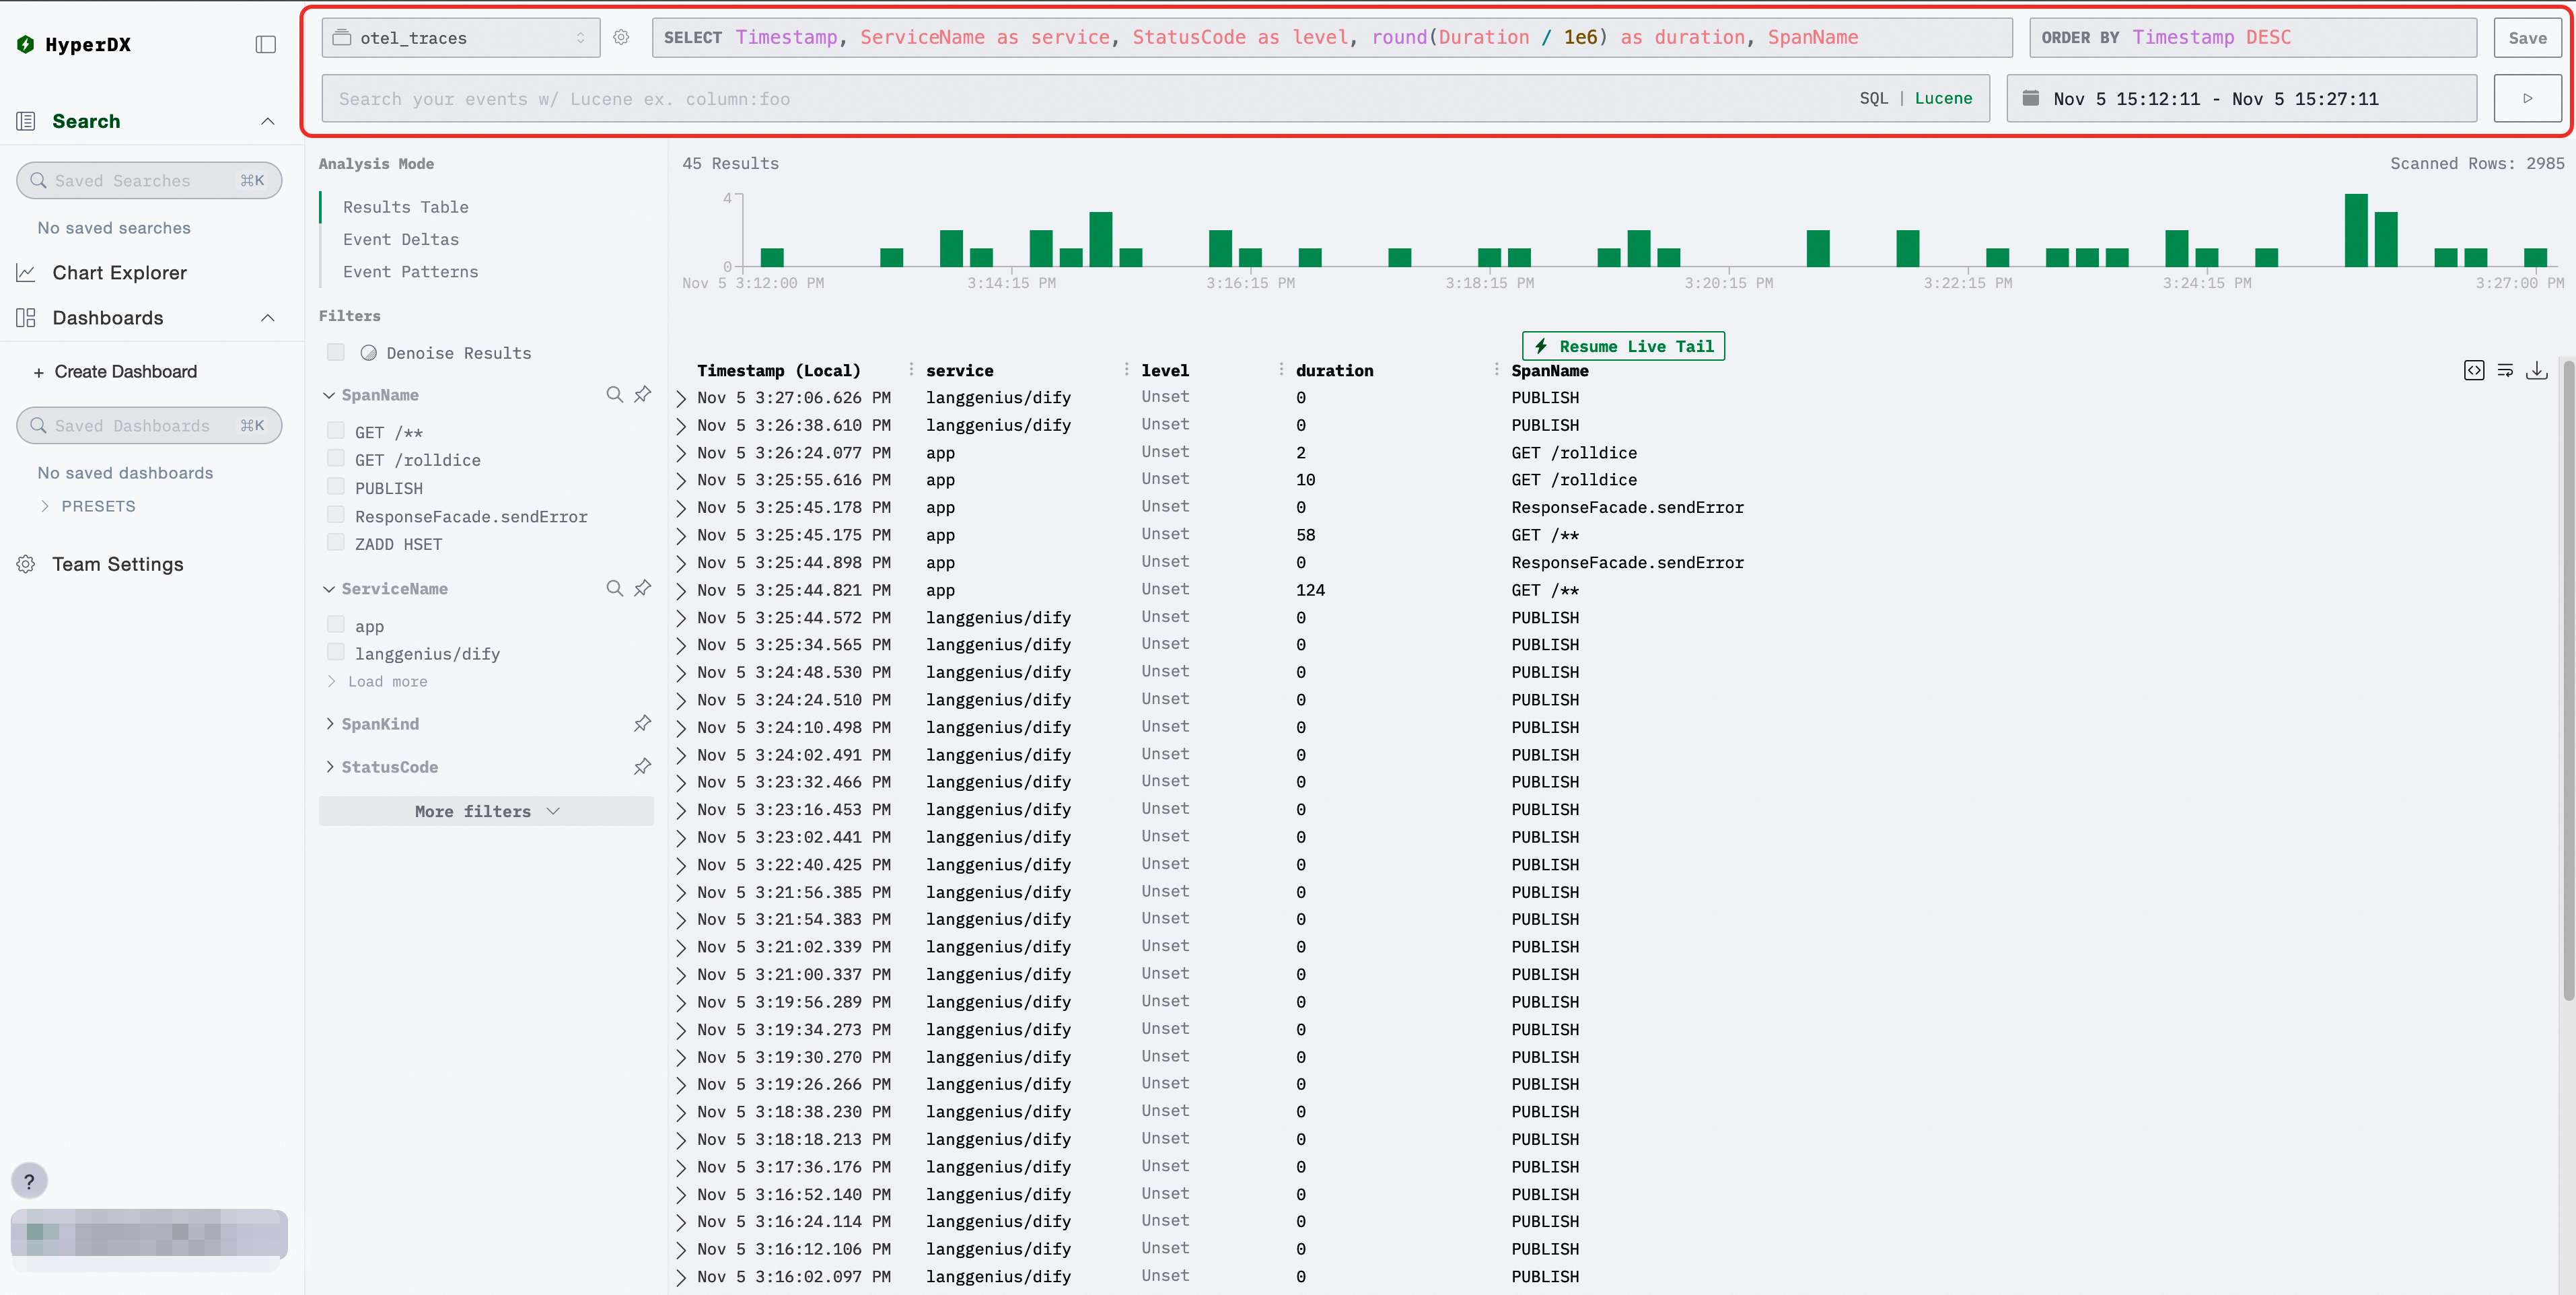
In the Filters area, after you select filter conditions, logs that meet the conditions are automatically filtered.
Click
 to view the information of the corresponding log on the current page.
Click the row where a log is located to view its detailed information, including complete attributes, the duration information of the associated trace, and the context information of the log.
Intelligent AI Assistant for Observability Data
The intelligent AI assistant for observability data can assist with data analysis of OTEL observability data tables. It can automatically identify the database and table information related to OTEL observability data in the instance, automatically construct query statements based on business requirements to retrieve observability data, and then automatically analyze and return diagnostic results. The main application scenarios include business trend analysis, data volume analysis, and RCA root cause diagnosis.
Prerequisites
Internet access to LLM has been enabled.
Usage
On the Unified Observability main page, click the AI NoteBook button in the left-side navigation pane.
In the AI assistant chat window, enter the question you want to analyze. The AI assistant automatically queries the observability data and returns the analysis results.
Common Scenarios
(1) Identify Business Log Error Rates
Example queries:
Analyze whether my OpenClaw program had any anomalies in the past hour
Analyze which components in my management trace data had higher error rates in the past 10 minutes
Diagnostic Results
Conclusion
Based on sampling analysis of the clickobserve_service.otel_traces table from 2026-05-06 19:50:00 to 2026-05-06 20:00:00:

Error Rate Statistics
- The overall error rate is approximately  0.32% (based on sampling data from 7 time windows of 0.5 seconds each, totaling 248,077 spans)
- Total error spans: 917
- Normal spans (OK + UNSET): 207,150

StatusCode Distribution
StatusCode    Count       Ratio     Remarks
UNSET         139,911     74.7%     -
OK            66,247      23.08%    -
ERROR         919         0.32%     -

Evidence
- View artifacts from /artifacts/sessions/c-b859bd2-3942-4d85-b636-51dae0d18ae/sql_results.json

Limitations
- Sampling bias: Due to the ClickHouse max_rows_to_read limit (200,000 rows), not all data within the 10-minute window can be covered, and the actual sample may be biased
- Time window representativeness: Sampling points are distributed between 19:50~20:00, and intervals with large data volumes may be missed
- Margin of error: The actual error rate may fluctuate between 0.2% and 0.5%

Next Steps (for more precise analysis)
- For precise error rates, you may need to adjust the sampling ratio and quantity
- If interested in anomalies, you can query the StatusMessage or Events fields for error details
- Drill down by SpanName or ServiceName to identify which services are contributing to the errors
(2) Root Cause Diagnosis
Example queries:
Analyze whether my management component logs had any errors in the past hour and analyze the root causes
Why did one of my gateway requests fail? requestId/traceId = ea7d2925-3422-4920-9ab1-b22dd3d85b2f. Please analyze the detailed cause.
Diagnostic Results
Error Data Analysis Conclusion
Based on sampling analysis of the clickobserve_service.otel_traces table from 2026-05-06 19:50:00 to 20:00:00, the following are the error sampling data and error analysis results.

1. Error Type Distribution
HTTP Code    Error Count  Ratio    Type                 Description
404            81         -64%    Resource not found        -
500            19         -10%    Internal server error     -
503            3          -2%     Service unavailable         -
206            1          -2%     Partial content       Can be considered edge case in 10 million requests

2. Typical Error Case Analysis

Case 1: 404 Not Found — Resource file path does not exist
- TraceId:b1b97380c855083a23ec76ace14e53be
- SpanName: GET
- Request path: http://dbaas-meta-api-myb-bank-cloud.ipa.internal.myb.rds.alibyncs.com/api/v1.0/clusterInstances/34631706 etc.
- Error cause: Target resource ID 19 36317596 does not exist on the target server. All associated spans under this TraceId show 404, confirming service deployment and routing configuration issues
- Evidence link: /artifacts/sessions/c-b859bd2-3942-4d85-b636-51dae0d18ae/sql_results.json line 22

Case 2: 503 Service Unavailable — Service temporarily unavailable
- TraceId:b1b97380c855083a23ec76ace14e53be
- SpanName: GET / POST
- Request path: http://dbaas-meta-api-myb-minirds.ipa.internal.myb.rds.alibyncs.com/api/v1.0/replicatSets/3083517606/myfd
- Evidence link: /artifacts/sessions/c-b859bd2-3942-4d85-b636-51dae0d18ae/sql_results.json line 22

Case 3: STS Service Call Error
- SpanName: POST https://sts.cn-hangzhou.null/
- Error type: .null domain, indicating domain resolution error or DNS resolution failure
- STS service may be missing domain configuration
- Evidence link: /artifacts/sessions/c-b859bd2-3942-4d85-b636-51dae0d18ae/sql_results.json line 10

Case 4: Basic Error Type
...
Session Management
The AI assistant supports creating and managing multiple sessions. You can perform the following operations:
Create a session: On the service page, click the + button at the top, and enter the session name to create a new session.
Delete a session: On the service page, click the delete button at the top to delete the current session.
Rename a session: On the service page, click the edit button at the top, enter a new name, and then press Enter to confirm.
Switch Output Mode
The AI assistant supports two output modes. You can switch between them by using the toggle button in the chat window:
Streaming output (default): Displays analysis results incrementally in real time for faster response.
Standard output: Waits for the analysis to complete before displaying the full results at once.
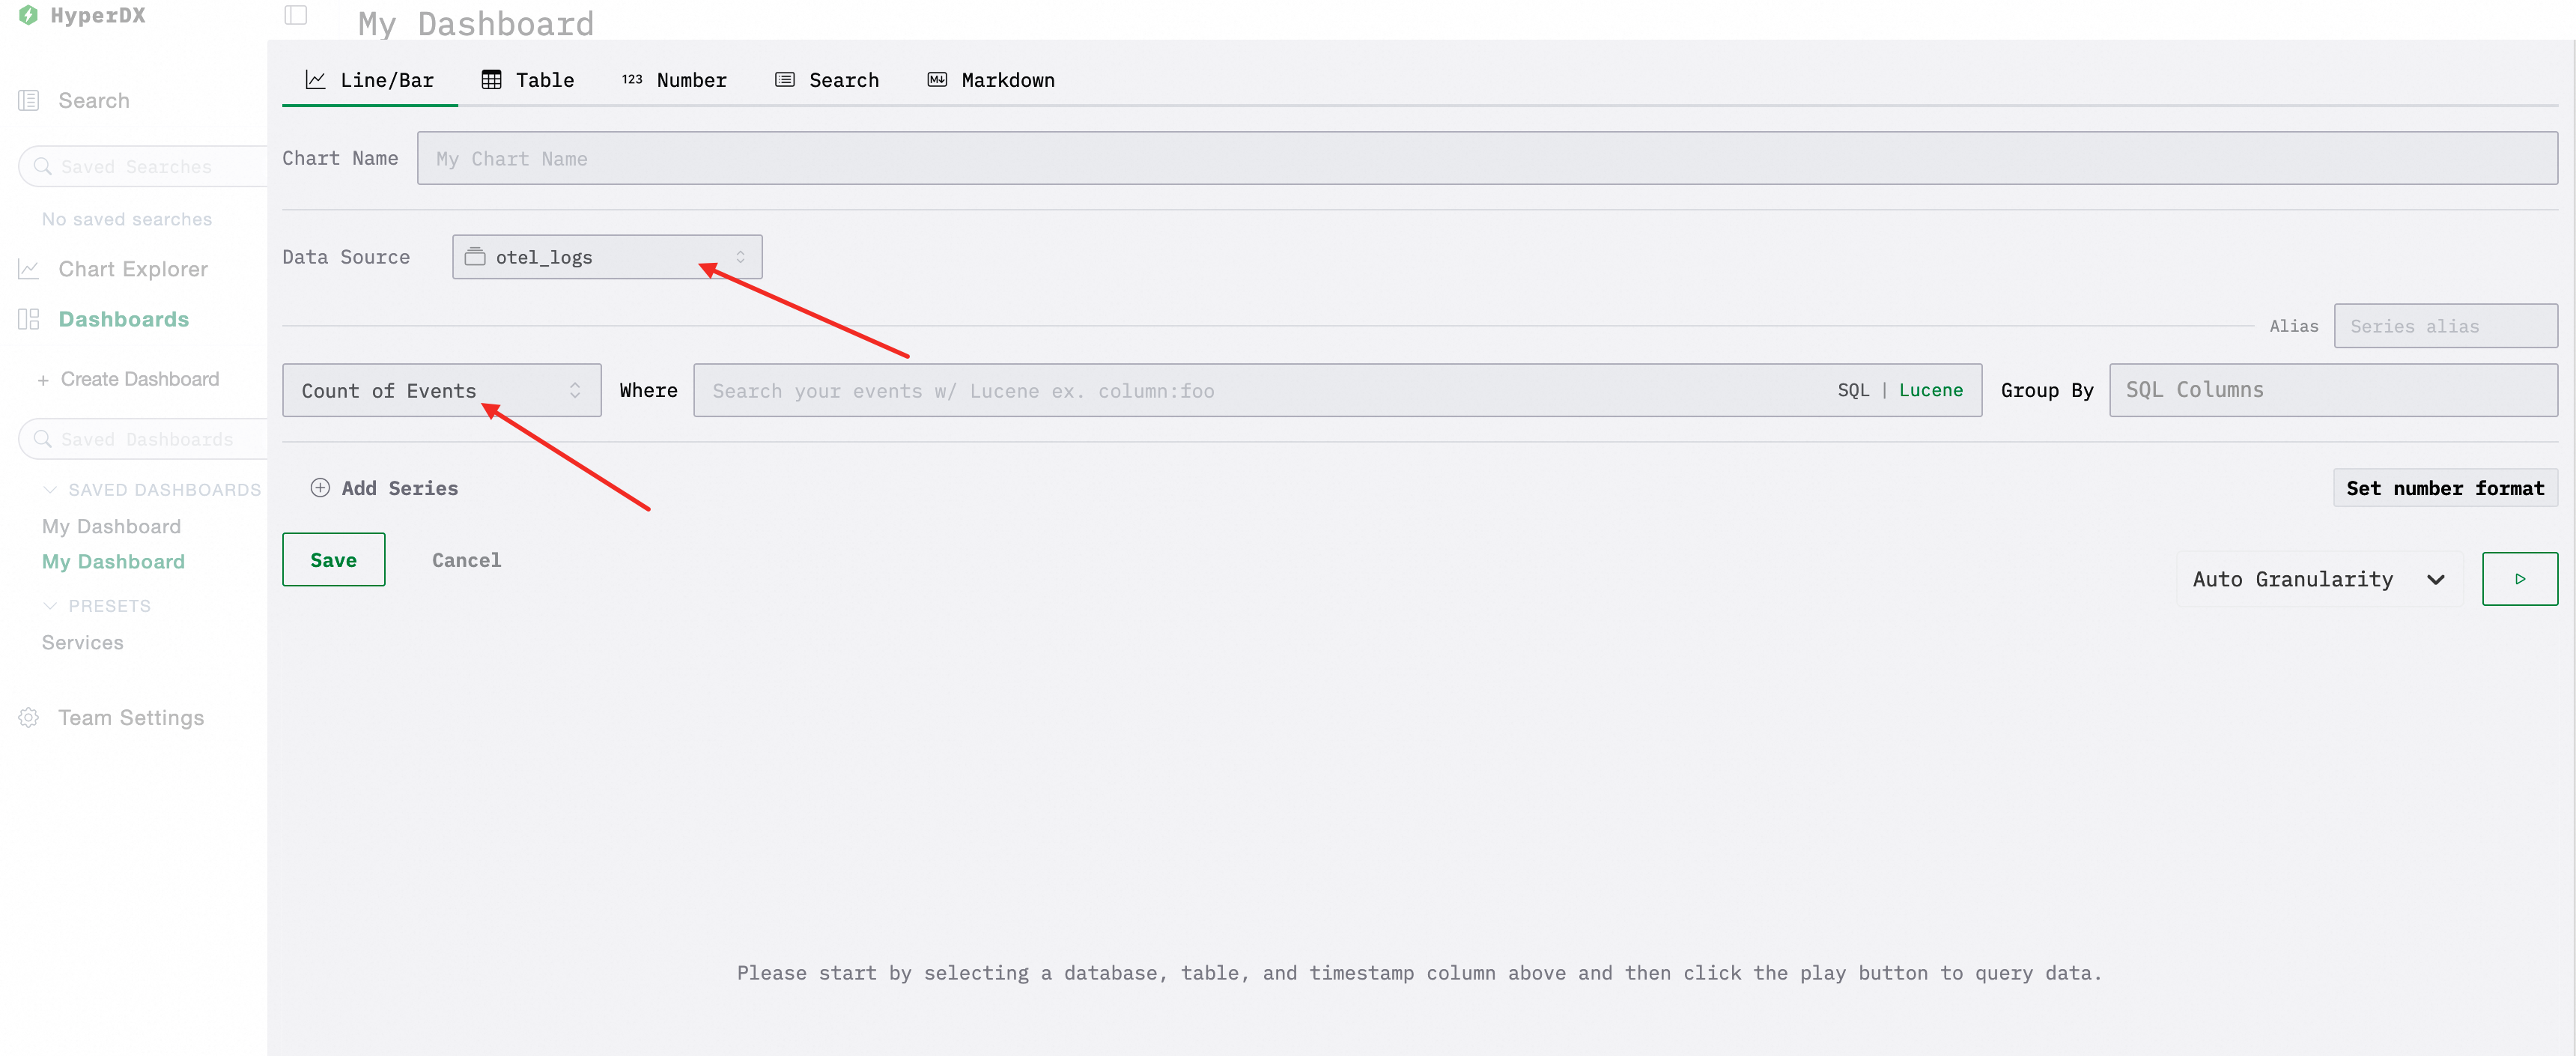
Custom Dashboard
The service provides preset dashboards for you to use directly. You can click PRESETS>Services in the left-side navigation pane to view them. You can also create custom dashboards to aggregate metrics of interest and display them in the same report.
In the left-side navigation pane, click Create Dashboard。
Click Add New Tile。
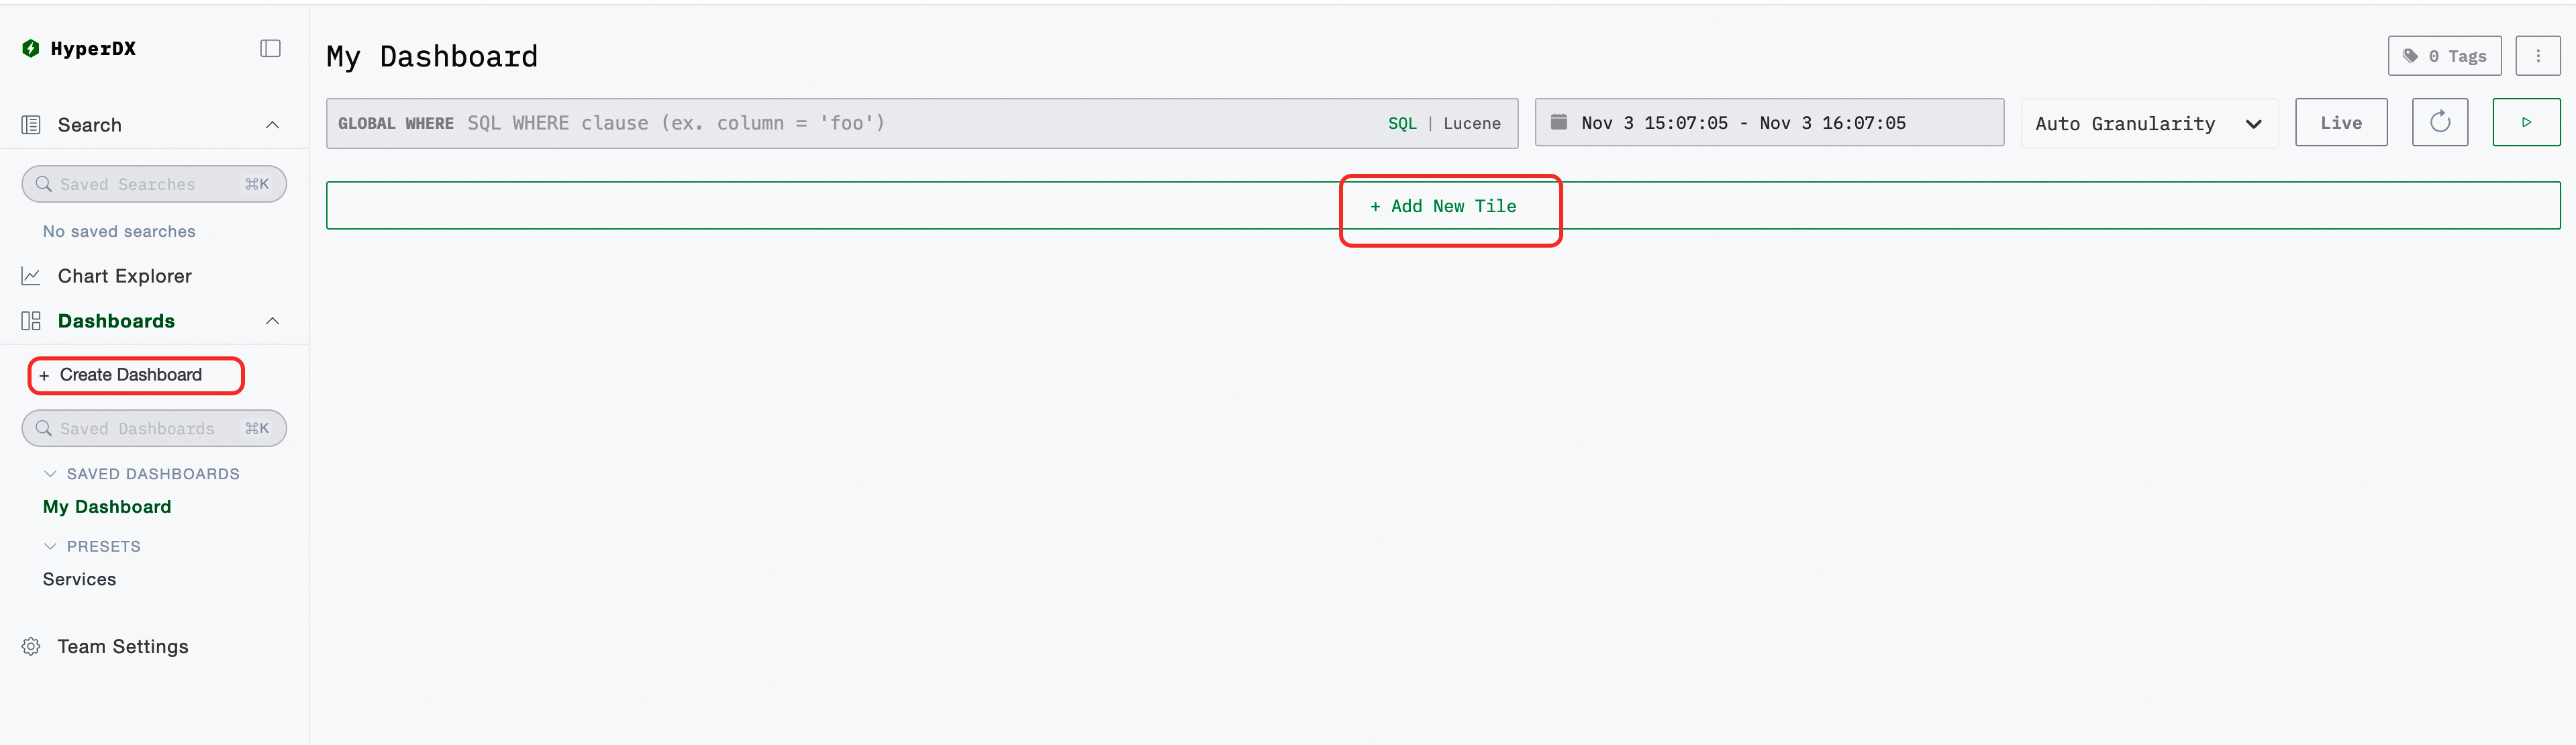
Set the data source and metrics, and then click Save.
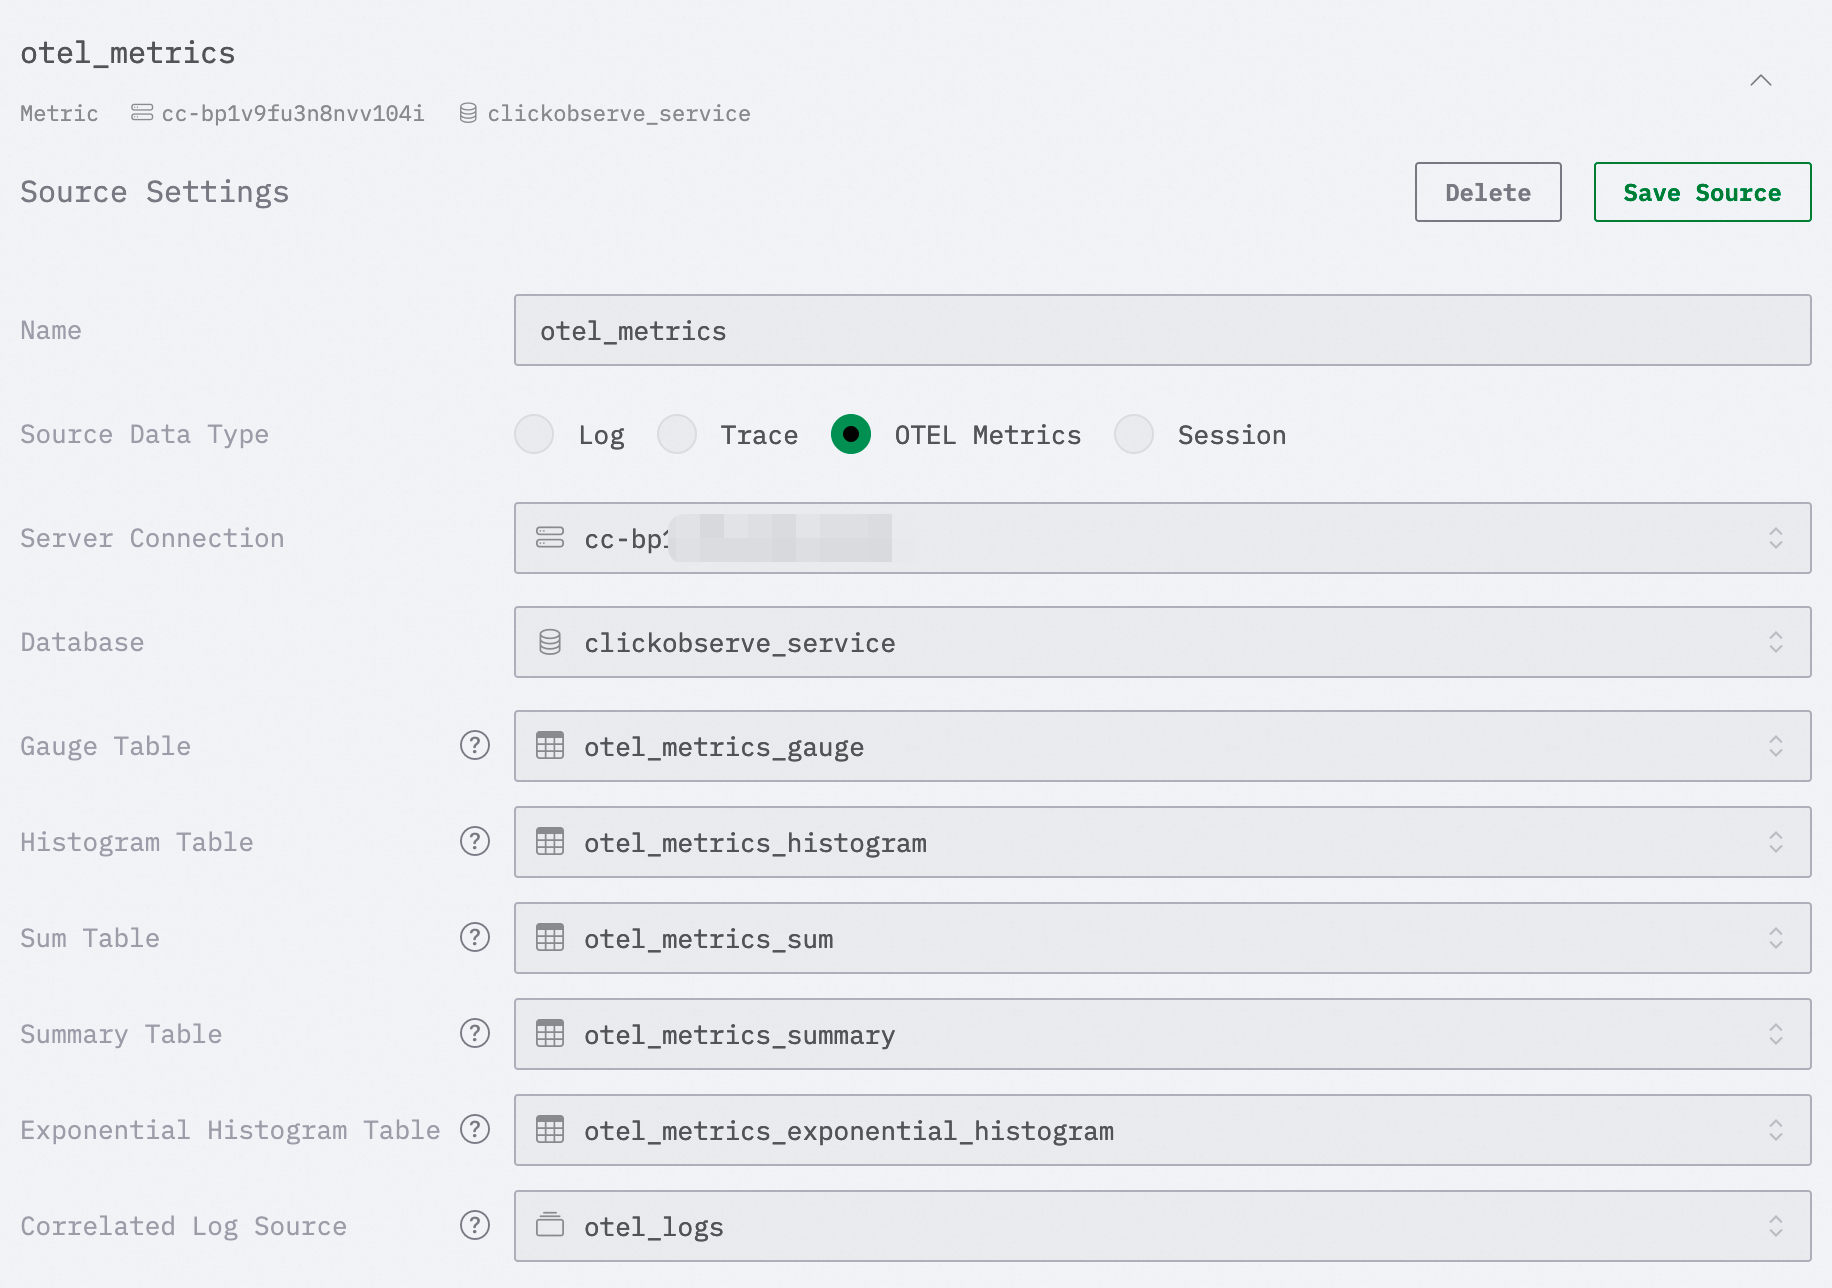
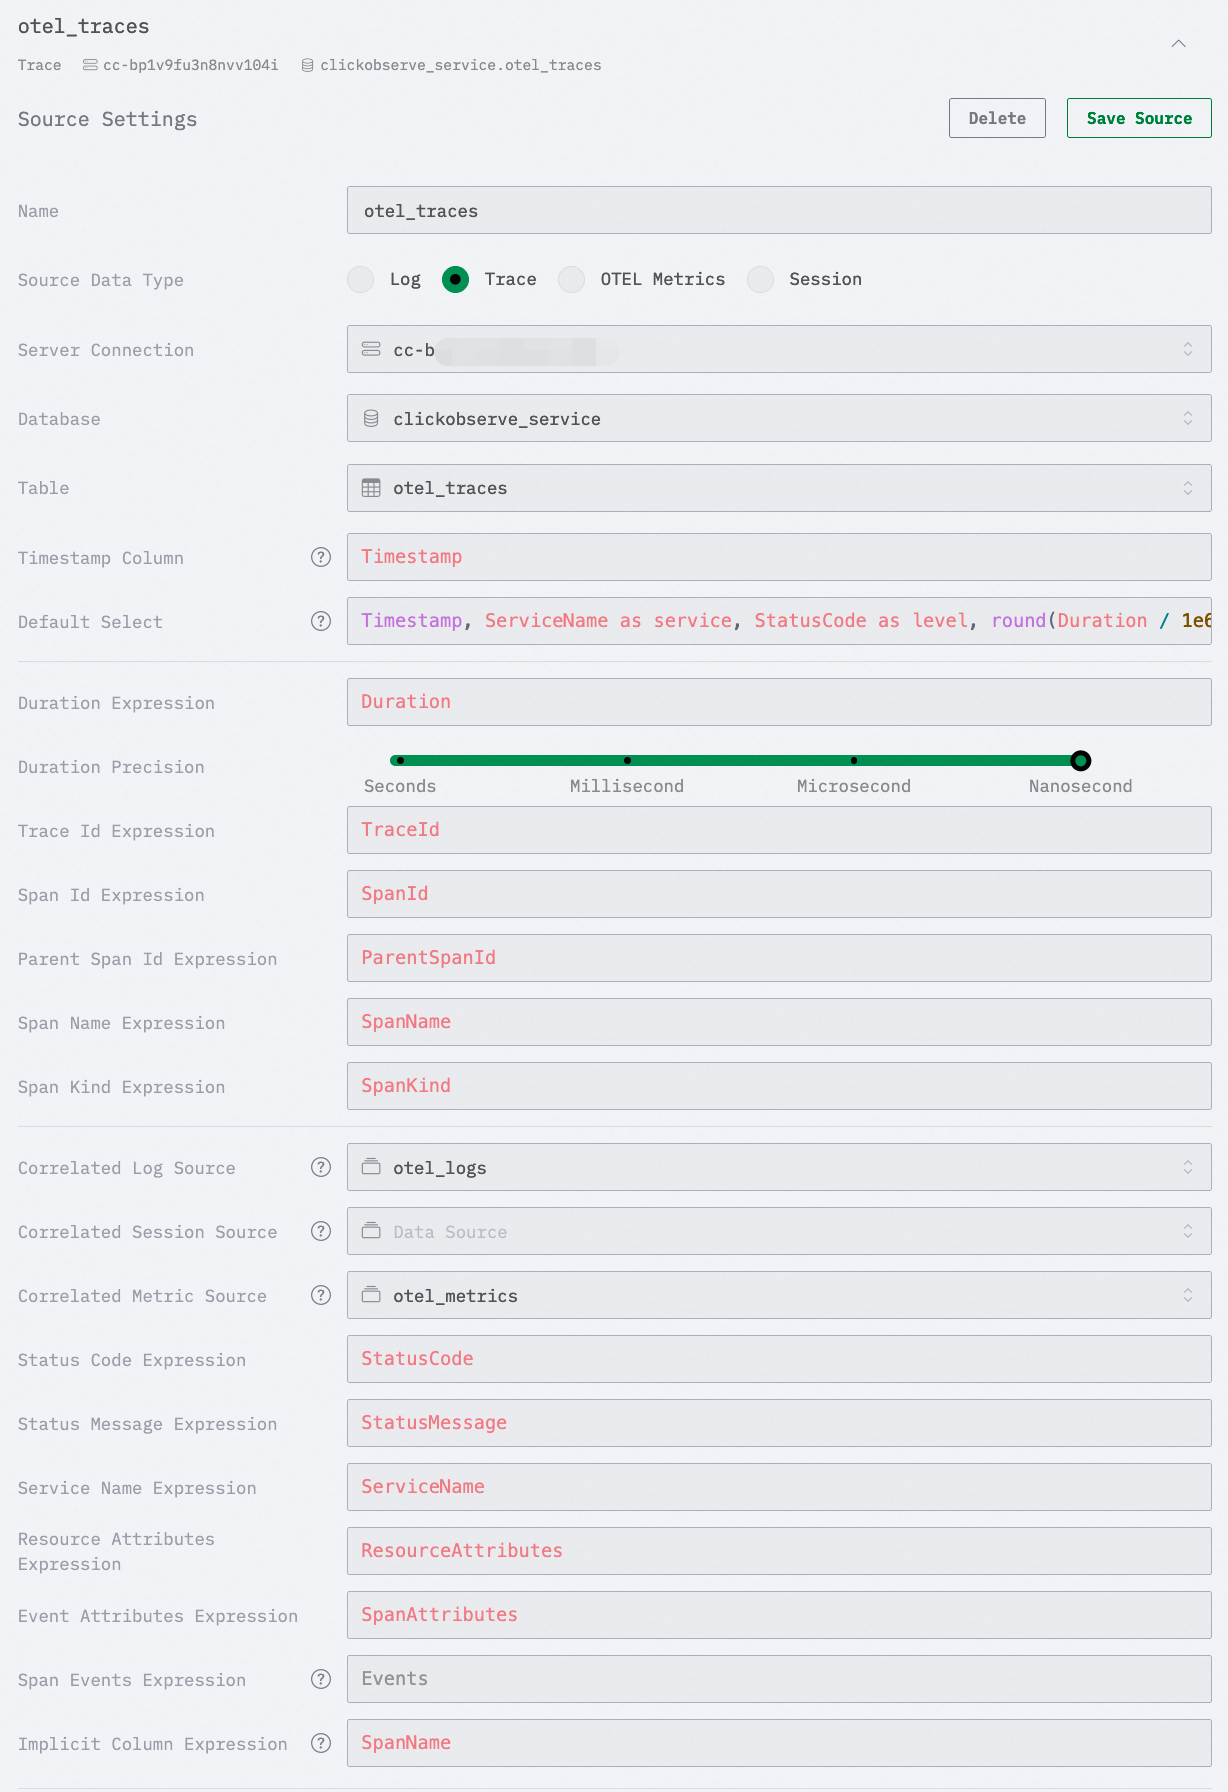
Service Configuration
If you selected Automatically Create Table when enabling the service, the service configuration for the corresponding tables has been automatically configured for you. You can also configure other tables as data sources based on your needs.
In the left-side navigation pane, click Team Settings。
In the Sources area to configure data sources, which define which tables the logs, metrics, and traces data comes from, and the column mapping. Refer to the following data configuration:
logs
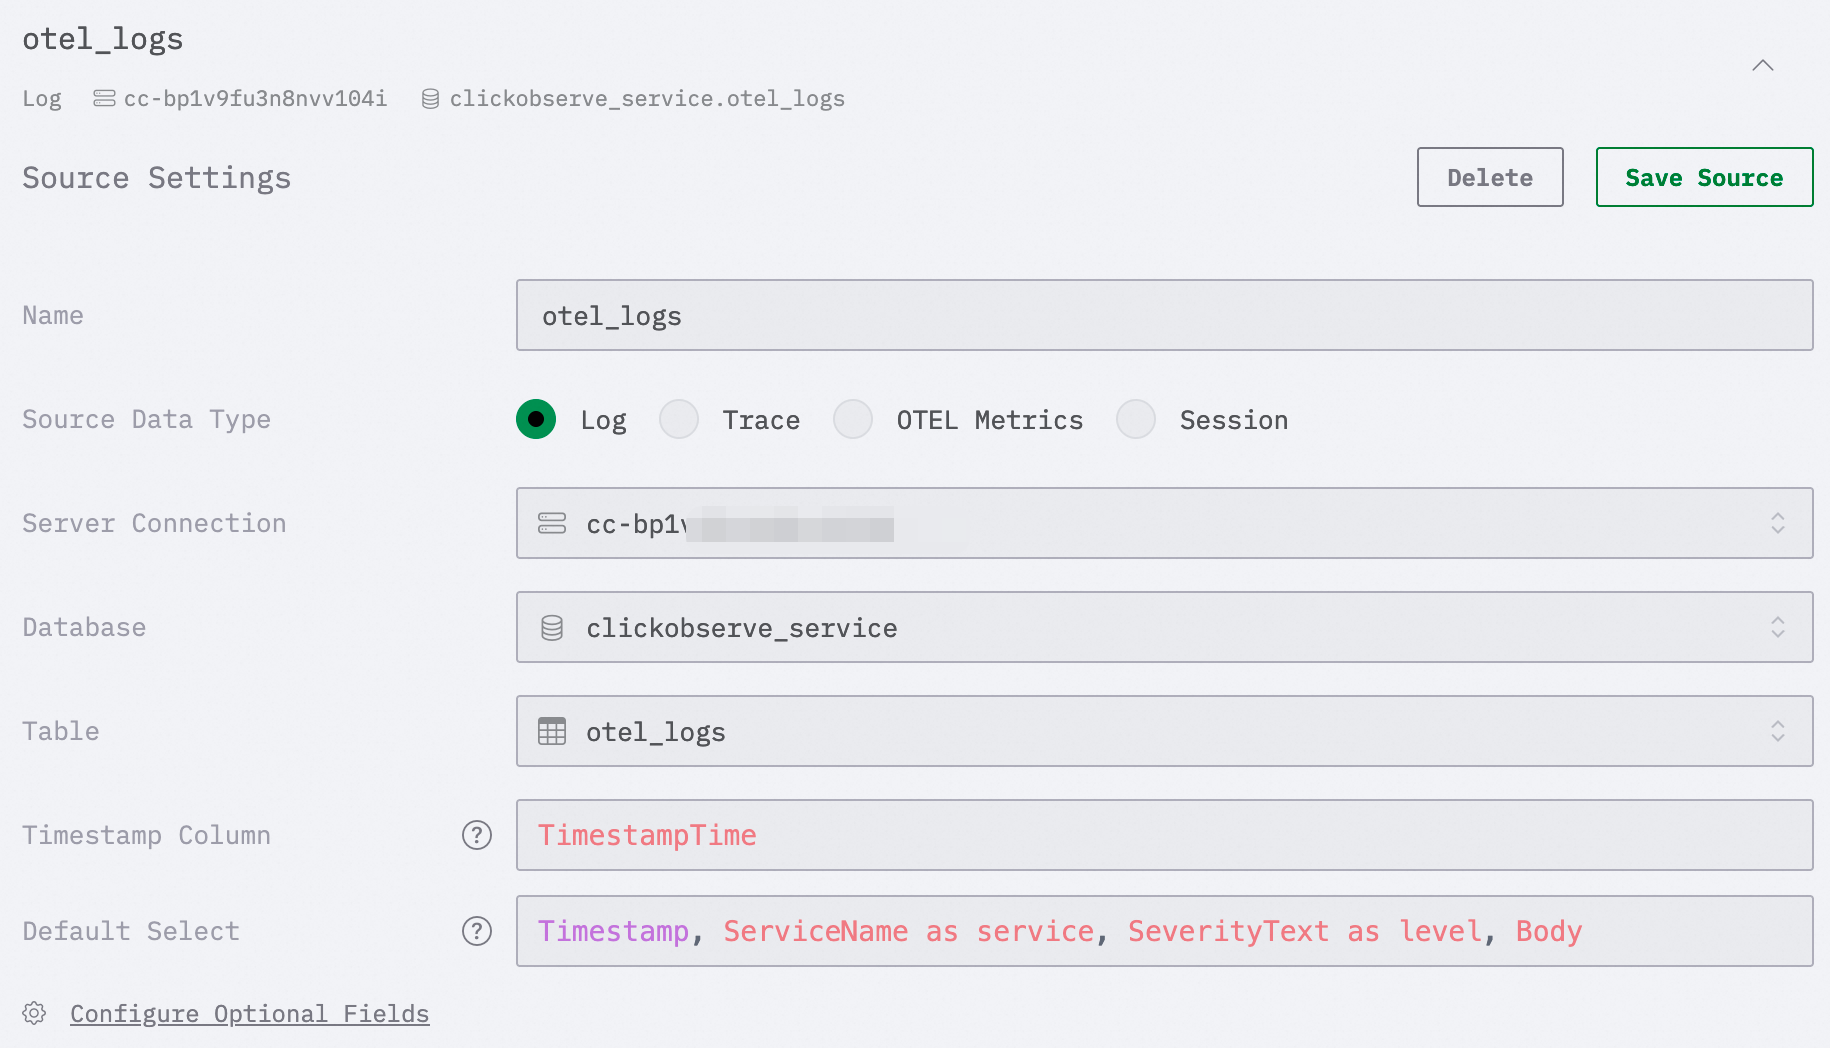
metrics
traces
In the Connections area to configure connection settings, which configure the connection between the observability service and the ApsaraDB for ClickHouse instance. A default connection configuration to the current instance is created. Host indicates the ApsaraDB for ClickHouse instance endpoint. Only VPC addresses are supported. If you modify the endpoint address in the instance console after configuring the instance endpoint, you need to reconfigure it.
In the ClickHouse Client Settings area to configure the query parameters of the observability service on the ApsaraDB for ClickHouse instance.
User Preferences
At the bottom of the left-side navigation pane, click your username and then select User Preferences to set user preferences.