ApsaraDB for ClickHouse allows you to configure alert rules for the key metrics of ApsaraDB for ClickHouse clusters. If the value of a metric is not within the range that you specify in the alert rule for the metric, the system sends an alert notification to the contacts in the alert contact group. This way, you can handle the issue at the earliest opportunity. This topic describes how to configure an alert rule for an ApsaraDB for ClickHouse cluster.
Prerequisites
An ApsaraDB for ClickHouse Community-compatible Edition or Enterprise Edition cluster is created.
Your RAM user must be granted the AliyunARMSFullAccess permission of Application Real-time Monitoring Service (ARMS). The alerting feature of ApsaraDB for ClickHouse depends on the alerting service provided by ARMS. For more information about how to grant the permission to a RAM user, see Grant permissions to a RAM user.
Usage notes
You cannot view the monitoring information about Enterprise Edition clusters in the CloudMonitor console.
Procedure
ApsaraDB for ClickHouse console
If your ApsaraDB for ClickHouse cluster meets the following conditions, configure an alert rule for the cluster based on the instructions in the Procedure in the old console section of this topic:
Your cluster was created before December 1, 2021.
Your cluster is deployed in the China (Qingdao) or China (Hohhot) region.
Log on to the ApsaraDB for ClickHouse console.
In the top navigation bar, select the region where the cluster is deployed.
On the Clusters page, click the Clusters of Community-compatible Edition tab or the Enterprise Edition Clusters tab and click the ID of the cluster that you want to manage.
In the left-side navigation pane, click Monitoring and Alerting.
On the page that appears, click Cluster Alerting.
Click Create ClickHouseAlert Rule or Create Enterprise EditionClickHouseAlert Rule.
NoteCreate ClickHouseAlert Rule is displayed if you create an alert rule for a Community-compatible Edition cluster.
Create Enterprise EditionClickHouseAlert Rule is displayed if you create an alert rule for an Enterprise Edition cluster.
On the Create ClickHouseAlert Rule or Create Enterprise EditionClickHouseAlert Rule page, configure the following parameters.
NoteWhen you configure an alert rule for an ApsaraDB for ClickHouse cluster, you can set the Check Type parameter to Static Threshold or Custom PromQL. The parameter settings vary with the values of the Check Type parameter.
If you set the Check Type parameter to Static Threshold, you can select a preset alert metric and create an alert rule for the metric.
If you set the Check Type parameter to Custom PromQL, you can create an alert rule for a custom metric.
Static Threshold
Parameter
Description
Example
Alert Rule Name
Enter a name for the alert rule.
CPU utilization alert
Check Type
The check type of the alert rule. Set this parameter to Static Threshold.
Static Threshold
Cluster
Select the cluster for which you want to create an alert rule.
cc-bp1lxbo89u95****
Alert Contact Group
Select an alert contact group.
The alert contact groups that are supported by a Prometheus instance vary based on the type of the Prometheus instance. The options in the drop-down list vary based on the type of the Prometheus instance that you specify.
ClickHouse
Alert Metric
Select the metric that you want to monitor by using the alert rule. Different alert contact groups provide different metrics.
cpu_usage
Alert Condition
Specify the condition based on which alert events are generated.
when cpu usage
>80%, trigger alertFilter Conditions
Specify the application scope of the alert rule.
No Filter
Data Preview
The Data Preview section displays the PromQL statement that corresponds to the alert condition. This section also displays the values of the specified metric in a time series graph.
By default, only the real-time values of one resource are displayed.
You can specify filter conditions to view the metric values of different resources in different time ranges.
NoteThe threshold in the time series graph is represented by a red line. The part of the curve that meets the alert condition is displayed in dark red, and the part of the curve that does not meet the alert condition is displayed in blue.
You can move the pointer over the curve to view resource details at a specific point in time.
You can also select a time period on the time series curve to view the time series curve of the selected time period.
None
Duration
If the alert condition is met, an alert event is generated: If the metric value at a point in time reaches the threshold, an alert event is generated.
If the alert condition is met continuously for N Minutes an alert event is generated: An alert event is generated only if the alert threshold is met for at least N minutes.
1
Alert Level
Specify the alert level. Valid values: Default, P4, P3, P2, and P1. Default value: Default. The preceding values are listed in ascending order of severity.
P2
Alert Message
Specify the alert message that you want to send to the specified contacts. You can specify custom variables in the alert message based on the Go template syntax.
node: {{$labels.pod_name}} CPU usage {{$labels.metrics_params_opt_label_value}} {{$labels.metrics_params_value}}%, current value {{ printf "%.2f" $value }}%
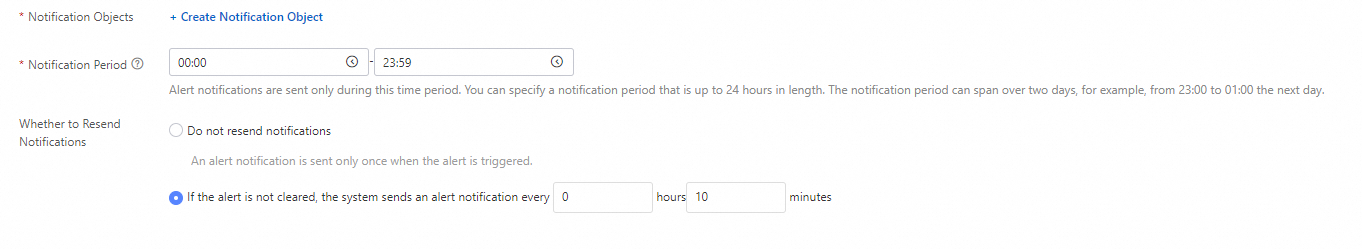
Alert Notification
Simple Mode
Notification Objects: the recipient who receives alert notifications.
Notification Period: Only alerts generated within the specified time period are sent. Alerts generated at other times are ignored.
Whether to Resend Notifications: specifies whether to resend alert notifications.
Standard Mode
Configure the Specify Notification Policy parameter.
ImportantAfter you select a notification policy, the alert events that are generated based on the alert rule can be matched by the notification policy and alerts can be generated. The alert events may also be matched by other notification policies that use fuzzy match, and alerts may be generated. One or more alert events can be matched by one or more notification policies.
Select Do Not Specify Notification Policy from the Specify Notification Policy drop-down list.
Select a notification policy that you create.
NoteYou can click Create Notification Policy to create a notification policy. For more information, see Create and manage a notification policy.
Do Not Specify Notification Policy
Advanced Settings
Alert Check Cycle
Specify the interval at which the alert rule is triggered to check whether the data meets the alert condition. Default value: 1. Minimum value: 1. Unit: minutes.
1 Minutes
Check after the data is complete
Specify whether to perform an alert check after data is collected, transmitted, and written to the storage. By default, Yes is selected. In most cases, you do not need to modify this parameter.
Yes
Tags
Specify tags for the alert rule. The specified tags can be used to match notification policies.
None
Annotations
Specify annotations for the alert rule.
None
Custom PromQL
Parameter
Description
Example
Alert Rule Name
Enter a name for the alert rule.
Pod CPU utilization exceeds 8%
Check Type
The check type of the alert rule. Set this parameter to Custom PromQL.
Custom PromQL
Cluster
Select the cluster for which you want to create an alert rule.
cc-bp1lxbo89u95****
Reference Alert Contact Group
Select an alert contact group.
The alert contact groups that are supported by a Prometheus instance vary based on the type of the Prometheus instance. The options in the drop-down list vary based on the type of the Prometheus instance that you specify.
ClickHouse
Reference Metrics
Optional. The Reference Metrics drop-down list displays common metrics. After you select a metric, the PromQL statement of the metric is displayed in the Custom PromQL Statements field. You can modify the statement based on your business requirements.
The values in the Reference Metrics drop-down list vary based on the type of the Prometheus instance.
http_conn_usage_count
Custom PromQL Statements
Specify the PromQL statement based on which alert events are generated.
clickhouse_http_conn_usage_count{} > 1000Data Preview
Duration
If the alert condition is met, an alert event is generated: If the metric value at a point in time reaches the threshold, an alert event is generated.
If the alert condition is met continuously for N Minutes an alert event is generated: An alert event is generated only if the alert threshold is met for at least N minutes.
1
Alert Level
Specify the alert level. Valid values: Default, P4, P3, P2, and P1. Default value: Default. The preceding values are listed in ascending order of severity.
Default
Alert Message
Specify the alert message that you want to send to the specified contacts. You can specify custom variables in the alert message based on the Go template syntax.
Namespace: {{$labels.namespace}} / Pod: {{$labels.pod_name}} / The utilization of the {{$labels.device}} disk exceeds 90%. Current value: {{ printf "%.2f" $value }}%
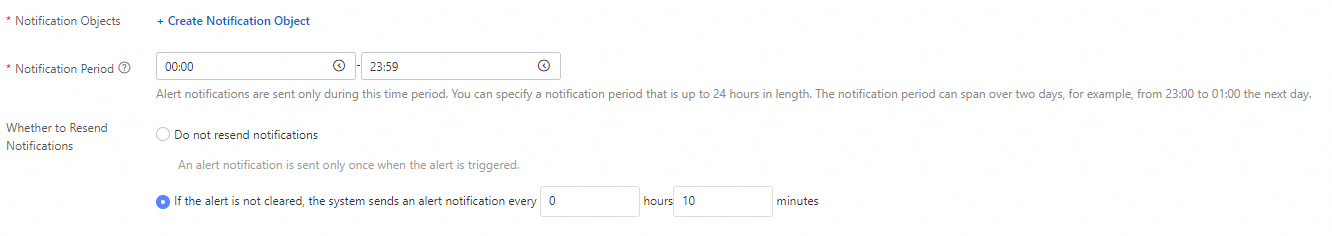
Alert Notification
Simple Mode
Notification Objects: the recipient who receives alert notifications.
Notification Period: Only alerts generated within the specified time period are sent. Alerts generated at other times are ignored.
Whether to Resend Notifications: specifies whether to resend alert notifications.
Standard Mode
Configure the Specify Notification Policy parameter.
ImportantAfter you select a notification policy, the alert events that are generated based on the alert rule can be matched by the notification policy and alerts can be generated. The alert events may also be matched by other notification policies that use fuzzy match, and alerts may be generated. One or more alert events can be matched by one or more notification policies.
Select Do Not Specify Notification Policy from the Specify Notification Policy drop-down list.
Select a notification policy that you create.
NoteYou can click Create Notification Policy to create a notification policy. For more information, see Create and manage a notification policy.
Do Not Specify Notification Policy
Advanced Settings
Alert Check Cycle
Specify the interval at which the alert rule is triggered to check whether the data meets the alert condition. Default value: 1. Minimum value: 1. Unit: minutes.
1 Minutes
Check after the data is complete
Specify whether to perform an alert check after data is collected, transmitted, and written to the storage. By default, Yes is selected. In most cases, you do not need to modify this parameter.
Yes
Tags
Specify tags for the alert rule. The specified tags can be used to match notification policies.
None
Annotations
Specify annotations for the alert rule.
None
Then, click Completed.
CloudMonitor console
Log on to the CloudMonitor console.
In the left-side navigation pane, choose .
On the Alert Rules page, click Create Alert Rule.
In the Create Alert Rule panel, configure the following parameters.
Parameter
Description
Product
Select a value based on your ApsaraDB for ClickHouse cluster. Valid values:
ClickHouse: This value is selected if your ApsaraDB for ClickHouse Community-compatible Edition cluster was purchased before December 1, 2021.
ClickHouse Community-compatible Edition: This value is selected if your ApsaraDB for ClickHouse Community-compatible Edition cluster was purchased after December 1, 2021.
Resource Range
The range of resources to which you want to apply the alert rule. Valid values:
All Resources: The alert rule applies to all resources of the specified cloud service.
Application Groups: The alert rule applies to all resources in the specified application group of the specified cloud service.
Instances: The alert rule applies to the specified resources of the specified cloud service.
Rule Description
The content of the alert rule. If a metric meets the specified condition, an alert is triggered. To specify a condition, perform the following steps:
Click Add Rule.
In the Configure Rule Description panel, enter a rule name in Alert Rule and then configure the Metric Type parameter. Valid values of the Metric Type parameter:
Single Metric: Select a metric and set the threshold and alert level for the metric.
Multiple Metrics: Select an alert level and specify alert conditions for two or more metrics.
Dynamic Threshold: For more information about dynamic thresholds, see Overview and Create dynamic threshold-triggered alert rules.
NoteThe dynamic threshold feature is in invitational preview. To use the feature, submit a ticket.
Click OK.
NoteFor more information about how to specify complex alert conditions, see Alert rule expressions.
Mute For
The interval at which CloudMonitor resends alert notifications if the alert is not cleared. Valid values: 5 Minutes, 15 Minutes, 30 Minutes, 60 Minutes, 3 Hours, 6 Hours, 12 Hours, and 24 Hours.
If a metric value reaches the threshold, CloudMonitor sends an alert notification. If the metric value reaches the threshold again within the mute period, CloudMonitor does not resend an alert notification. If the alert is not cleared after the mute period ends, CloudMonitor resends an alert notification.
For example, if the Mute For parameter is set to 12 Hours and the alert is not cleared, CloudMonitor resends an alert notification after 12 hours.
Effective Period
The period during which the alert rule is effective. CloudMonitor sends alert notifications based on the alert rule only within the effective period.
NoteIf an alert rule is not effective, no alert notification is sent. However, the alert record is still displayed on the Alert History tab.
Alert Contact Group
The alert contact groups to which alert notifications are sent.
The alert notifications of the application group are sent to the alert contacts that belong to the specified alert contact groups. An alert contact group can contain one or more alert contacts.
For more information about how to create an alert contact and an alert contact group, see Create an alert contact or alert contact group.
Tag
Specify tags for the alert rule. A tag consists of a tag key and a tag value.
NoteYou can set a maximum of six tags.
Advanced Settings
Alert Callback
Specify the callback URL that can be accessed over the Internet. CloudMonitor sends POST requests to push alert notifications to the specified callback URL. Only the HTTP protocol is supported. For information about how to configure an alert callback, see Use the alert callback feature to send notifications about threshold-triggered alerts.
To test the connectivity of an alert callback URL, perform the following steps:
Click Test next to the callback URL.
In the WebHook test panel, you can check and troubleshoot the connectivity of the alert callback URL based on the returned status code and test result details.
NoteTo obtain the details of the test result, configure the Test Template Type and Language parameters and click Test.
Click Close.
Auto Scaling
If you turn on Auto Scaling, the specified scaling rule is enabled when an alert is triggered based on the alert rule. In this case, you must configure the Region, ESS Group, and ESS Rule parameters.
For more information about how to create a scaling group, see Manage scaling groups.
For more information about how to create a scaling rule, see Configure scaling rules.
Simple Log Service
If you turn on Simple Log Service, the alert information is sent to the specified Logstore when an alert is triggered based on the alert rule. In this case, you must configure the Region, ProjectName, and Logstore parameters.
For more information about how to create a project and a Logstore, see Getting Started.
Simple Message Queue(formerly MNS) - topic
If you turn on Simple Message Queue(formerly MNS) - topic, the alert information is sent to the specified topic in Simple Message Queue (formerly MNS) when an alert is triggered based on the alert rule. In this case, you must configure the Region and topicName parameters.
For more information about how to create a topic, see Create a topic.
Function Compute
If you turn on Function Compute, an alert notification is sent to Function Compute for format processing when an alert is triggered based on the alert rule. In this case, you must configure the Region, Service, and Function parameters.
For more information about how to create a service and a function, see Quickly create a function.
Method to handle alerts when no monitoring data is found
Specify how to handle alerts when no monitoring data is found. Valid values:
Do not do anything (default)
Send alert notifications
Treated as normal
(Optional) Procedure in the old console
What to do next
For more information about how to manage alert rules that are configured by using the ApsaraDB for ClickHouse console, see Manage alert rules.
References
For more information about CloudMonitor, see What is CloudMonitor?