The real-time monitoring feature collects data at a 1-minute granularity. You can view traffic, bandwidth, and origin fetch status for CDN and from the previous minute. You can query data from the last 7 days. The maximum timestamp range for a single query is 24 hours. The 1-minute real-time monitoring data helps you quickly detect CDN and traffic exceptions and locate issues.
Features
Compared to Resource Monitoring, real-time monitoring provides a shorter query time range and lets you access historical data for a shorter period, as shown in the following table.
Supported time granularities for queries
You can query monitoring data using the console or by calling API operations. The following table describes the maximum timestamp range for a single query, data latency, and the time range for historical data queries at different time granularities.
The following are the time granularity, the maximum time span for a single query, and the queryable time range for historical data:
Query data in the console:
Time granularity
Maximum time range per query
Historical data available
Data latency
1 minute
1 hour
7 days
5 minutes
5 minutes
3 days
7 days
15 minutes
Query data by calling API operations:
Time granularity
Maximum time range per query
Historical data available
Data latency
1 minute
1 hour
7 days
5 minutes
5 minutes
3 days
93 days
15 minutes
1 hour
31 days
186 days
4 hours
Metrics and monitoring indicators
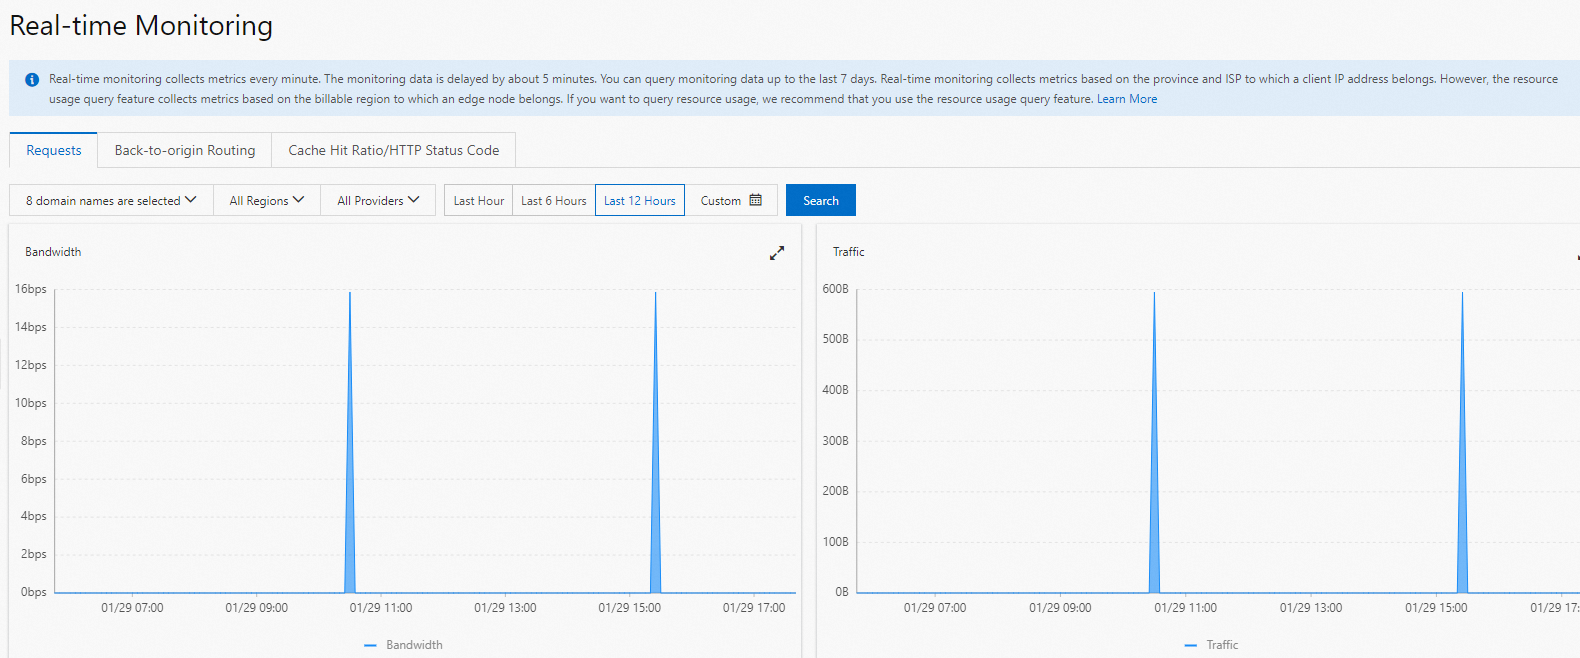
The real-time monitoring feature includes three metrics. You can select a domain name, region, carrier, and time range to view details about monitoring indicators such as bandwidth and traffic.
Real-time monitoring collects data based on client IP addresses. In contrast, billing is calculated based on the traffic, bandwidth, and number of requests on CDN points of presence (POPs) in each billable region. The results from these two methods may differ because different statistical methods are used. The line charts for real-time monitoring are mainly used to show bandwidth trends. To query the metering data that corresponds to your bills, see Usage overview.
Data is calculated and collected by calling API operations. For more information, see the API references in the following table.
Metric | Metrics | Related API operations |
Requests | Displays the bandwidth, traffic, number of requests, and queries per second (QPS) for accelerated domain names. | |
Back-to-origin Routing | Displays the back-to-origin bandwidth and back-to-origin traffic for accelerated domain names. | |
Cache Hit Ratio/HTTP Status Code | Displays the request hit ratio, byte hit ratio, and the number of 2xx, 3xx, 4xx, and 5xx HTTP status codes for accelerated domain names. For more information about the status codes and their solutions, see HTTP status codes.
|
Notes
The traffic data for an accelerated domain name that is queried using the monitoring or usage query features in the console (or using OpenAPI) differs from the traffic data that is calculated from logs. Typically, the traffic data from monitoring and usage queries is 1.1 times the traffic data that is calculated from logs. For more information, see Why is there a discrepancy between traffic data from monitoring queries, usage queries, and log analysis?.
Usage vs. Resource Monitoring vs. Real-time Monitoring
Usage: Usage collects usage data based on POPs. Each POP belongs to a specific billing region. Therefore, you can query usage data only by billing region, such as the Chinese mainland, Asia Pacific 1, and North America. For more information, see Query resource usage.
Resource Monitoring and Real-time Monitoring: These features collect monitoring data based on client IP addresses. Each client IP address belongs to a specific region or carrier. Therefore, you can query monitoring data only by region or carrier (or a combination of both). For more information, see Resource Monitoring and Real-time Monitoring.
Resource Monitoring vs. Real-time Monitoring
Minimum data latency: Real-time Monitoring provides data with lower latency. In Real-time Monitoring, if the data granularity is 1 minute, the data latency is approximately 5 minutes. In Resource Monitoring, the minimum data granularity is 5 minutes, and the data latency is approximately 15 minutes.
Minimum data granularity: Real-time Monitoring provides data with a finer granularity. The minimum data granularity is 1 minute for Real-time Monitoring and 5 minutes for Resource Monitoring.
Queryable protocol layers: Resource Monitoring lets you query data by more protocol layers. Resource Monitoring supports querying data by protocol layer, such as HTTP, HTTPS, QUIC, IPv4, and IPv6. Real-time Monitoring does not support this feature.
Procedure
- Log on to the Alibaba Cloud CDN console.
In the navigation pane on the left, choose .
On the Real-time Monitoring page, select a metric and query conditions, and then click Search.
The system displays the query results based on the selected metric and query conditions. You can analyze the results on the page.