Alibaba Cloud CDN streams access logs from points of presence (POPs) worldwide to Simple Log Service (SLS) within 3 minutes of each request. Once the logs land in SLS, you can run queries and view preset dashboards to analyze traffic patterns, diagnose errors, and understand your audience — without downloading or preprocessing data yourself.
Prerequisites
Before you begin, ensure that you have:
Alibaba Cloud CDN activated and an accelerated domain name configured. See Activate Alibaba Cloud CDN.
SLS activated. See Collect and analyze ECS text logs using LoongCollector.
Real-time log delivery configured for the accelerated domain name you want to analyze. See Configure real-time log delivery.
Limitations
| Constraint | Details |
|---|---|
| Logstore type | Standard; default data retention of 7 days |
| Logstore write access | Only real-time CDN logs can be written to the dedicated Logstore |
| Index modification | Indexes in a dedicated Logstore can be modified; if modification fails, contact technical support |
| Supported regions | China (Hangzhou), China (Shanghai), China (Qingdao), China (Beijing), China (Shenzhen), China (Hong Kong), Asia Pacific SE 1 (Singapore) |
| Query, alerting, and consumption | No special limits |
Real-time logs vs. offline logs
| Real-time log delivery | Offline log | |
|---|---|---|
| Log latency | Within 3 minutes | Within 24 hours |
| Log analysis | 4 preset report templates + custom queries, powered by SLS | Export to Object Storage Service (OSS) only; no built-in analysis |
Create a real-time log delivery project
To store real-time logs, create a project in SLS and associate it with your accelerated domain name. See Configure real-time log delivery.
The following figure shows an example project with the name project-example, stored in the China (Hangzhou) region (cn-hangzhou).
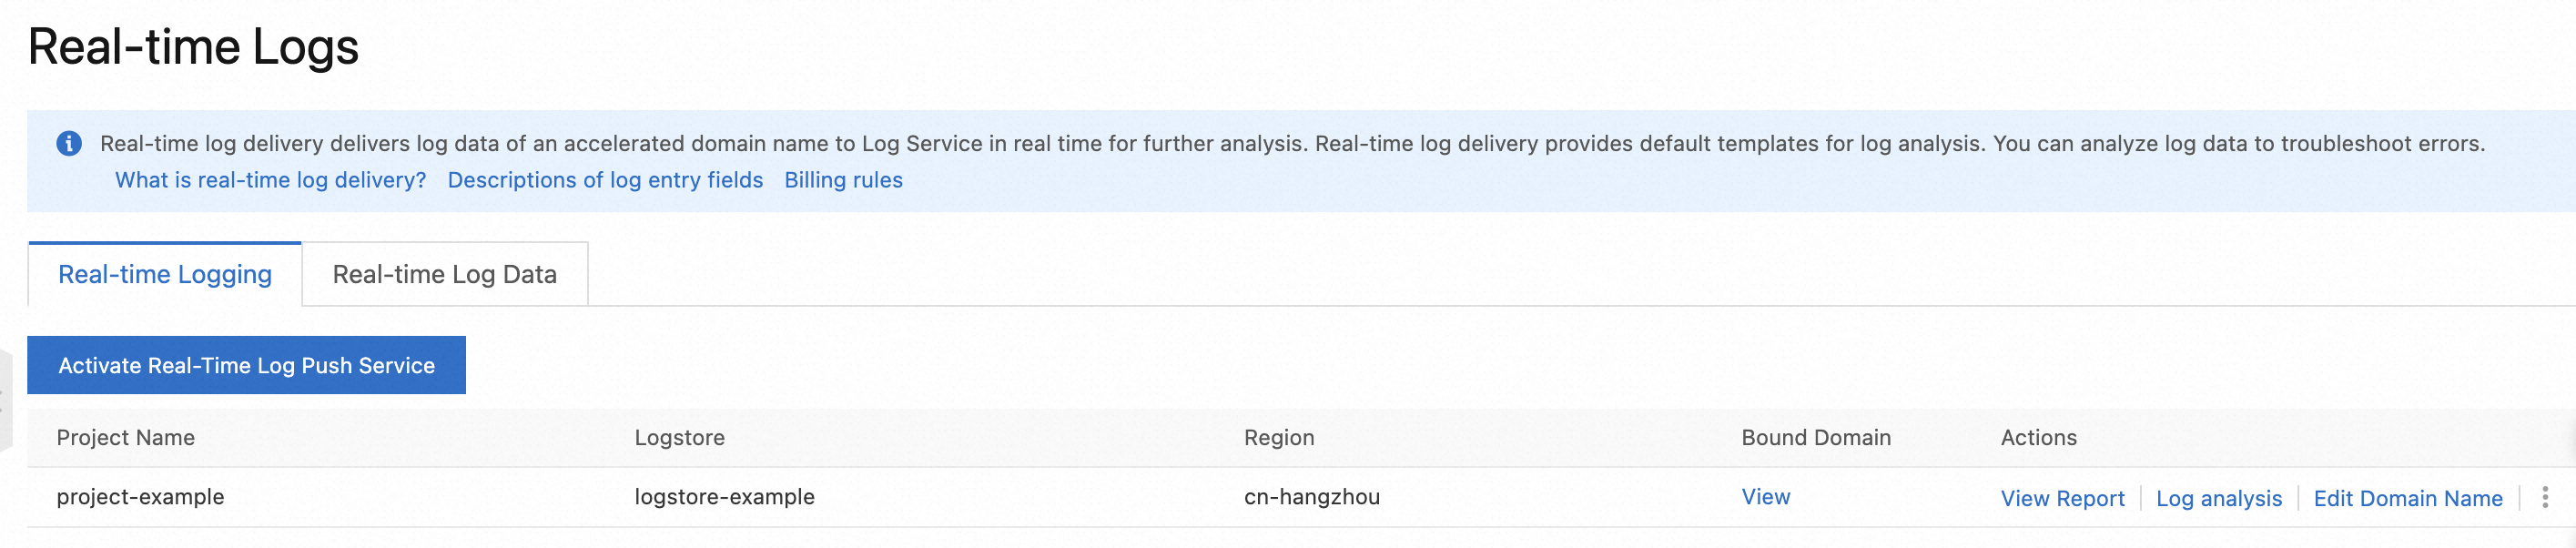
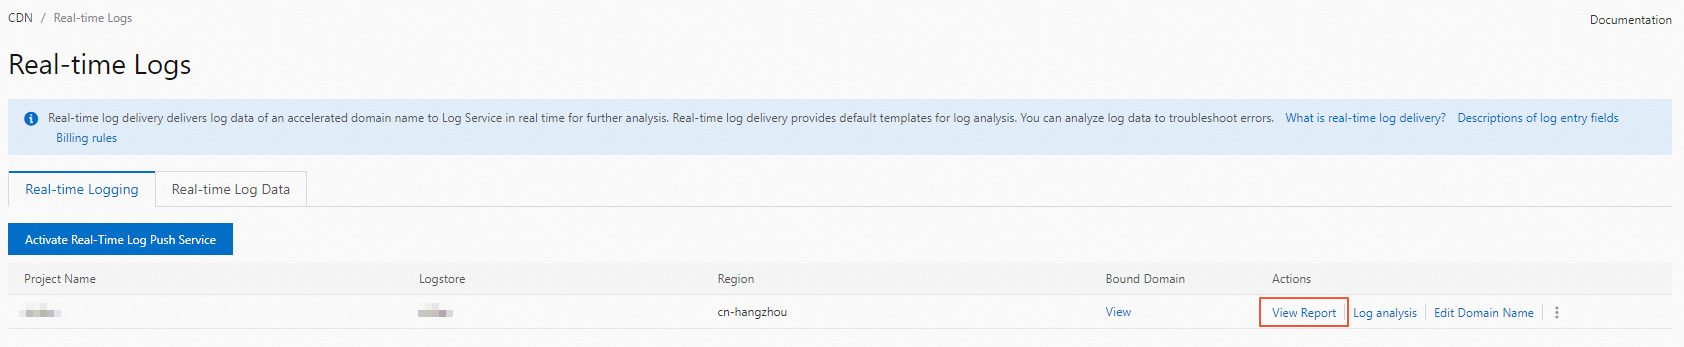
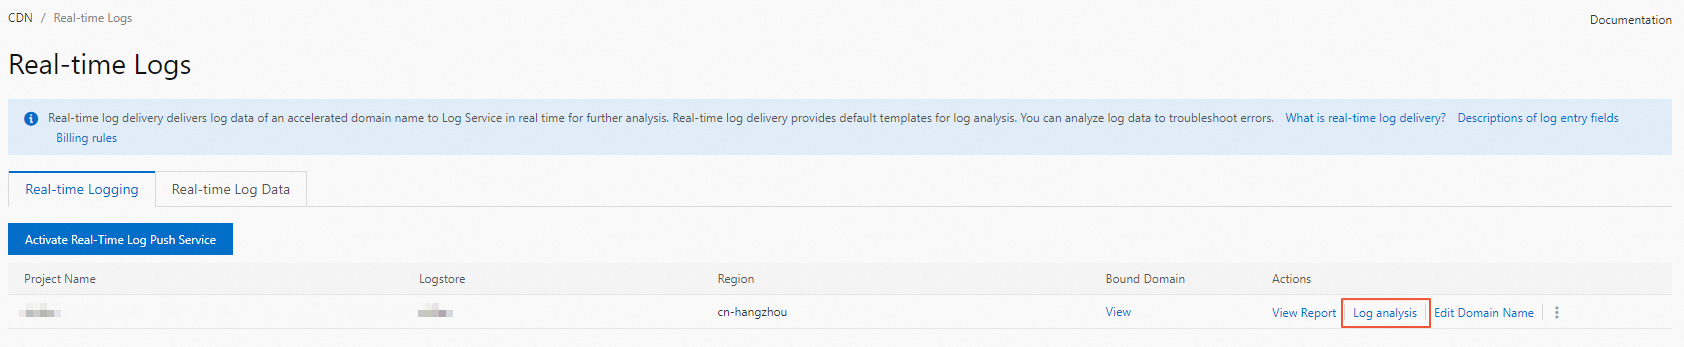
View preset reports
CDN real-time log delivery includes four preset analysis reports. On the real-time log feature page, find your project and click View Reports to open the report templates.
By default, reports show data across all domain names. Filter by domain name or URI to narrow the scope.
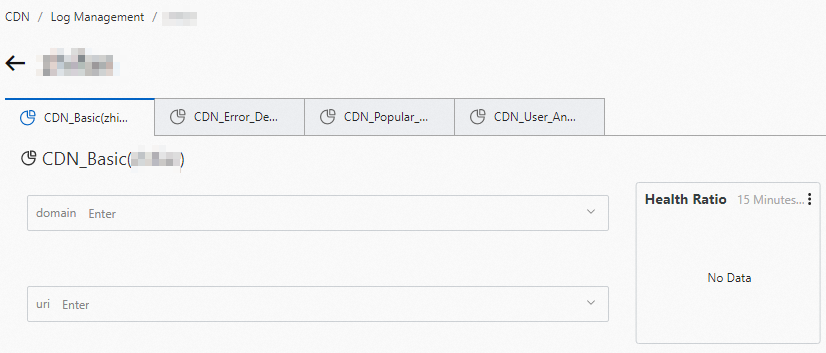
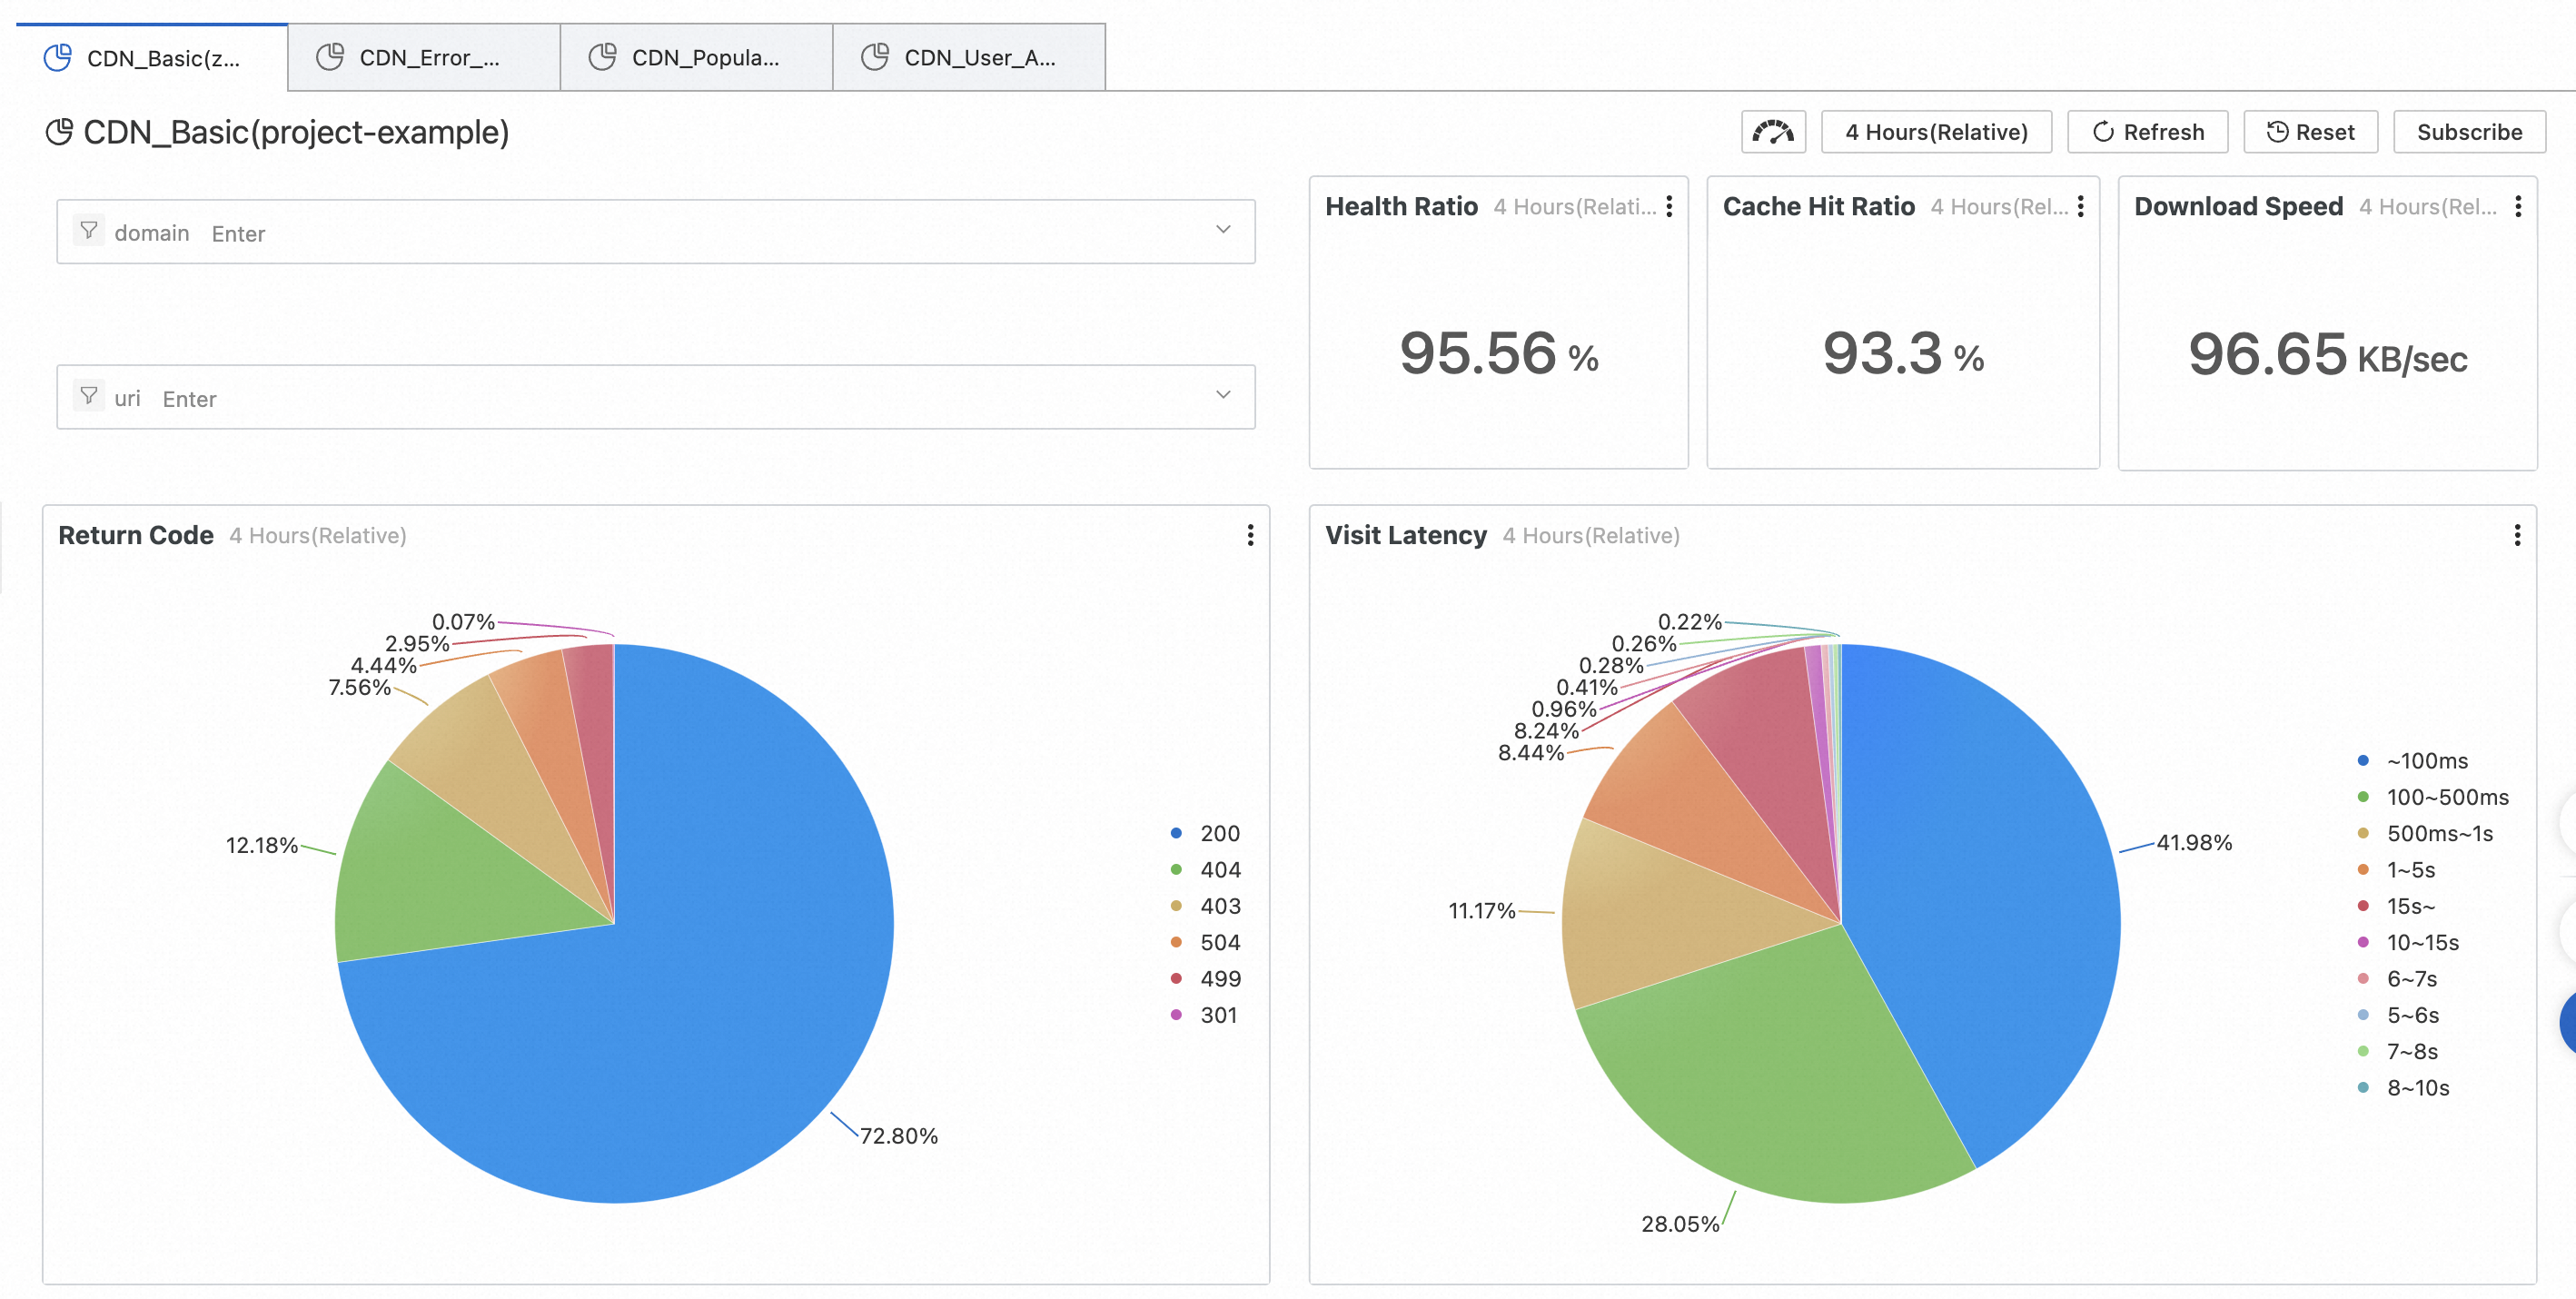
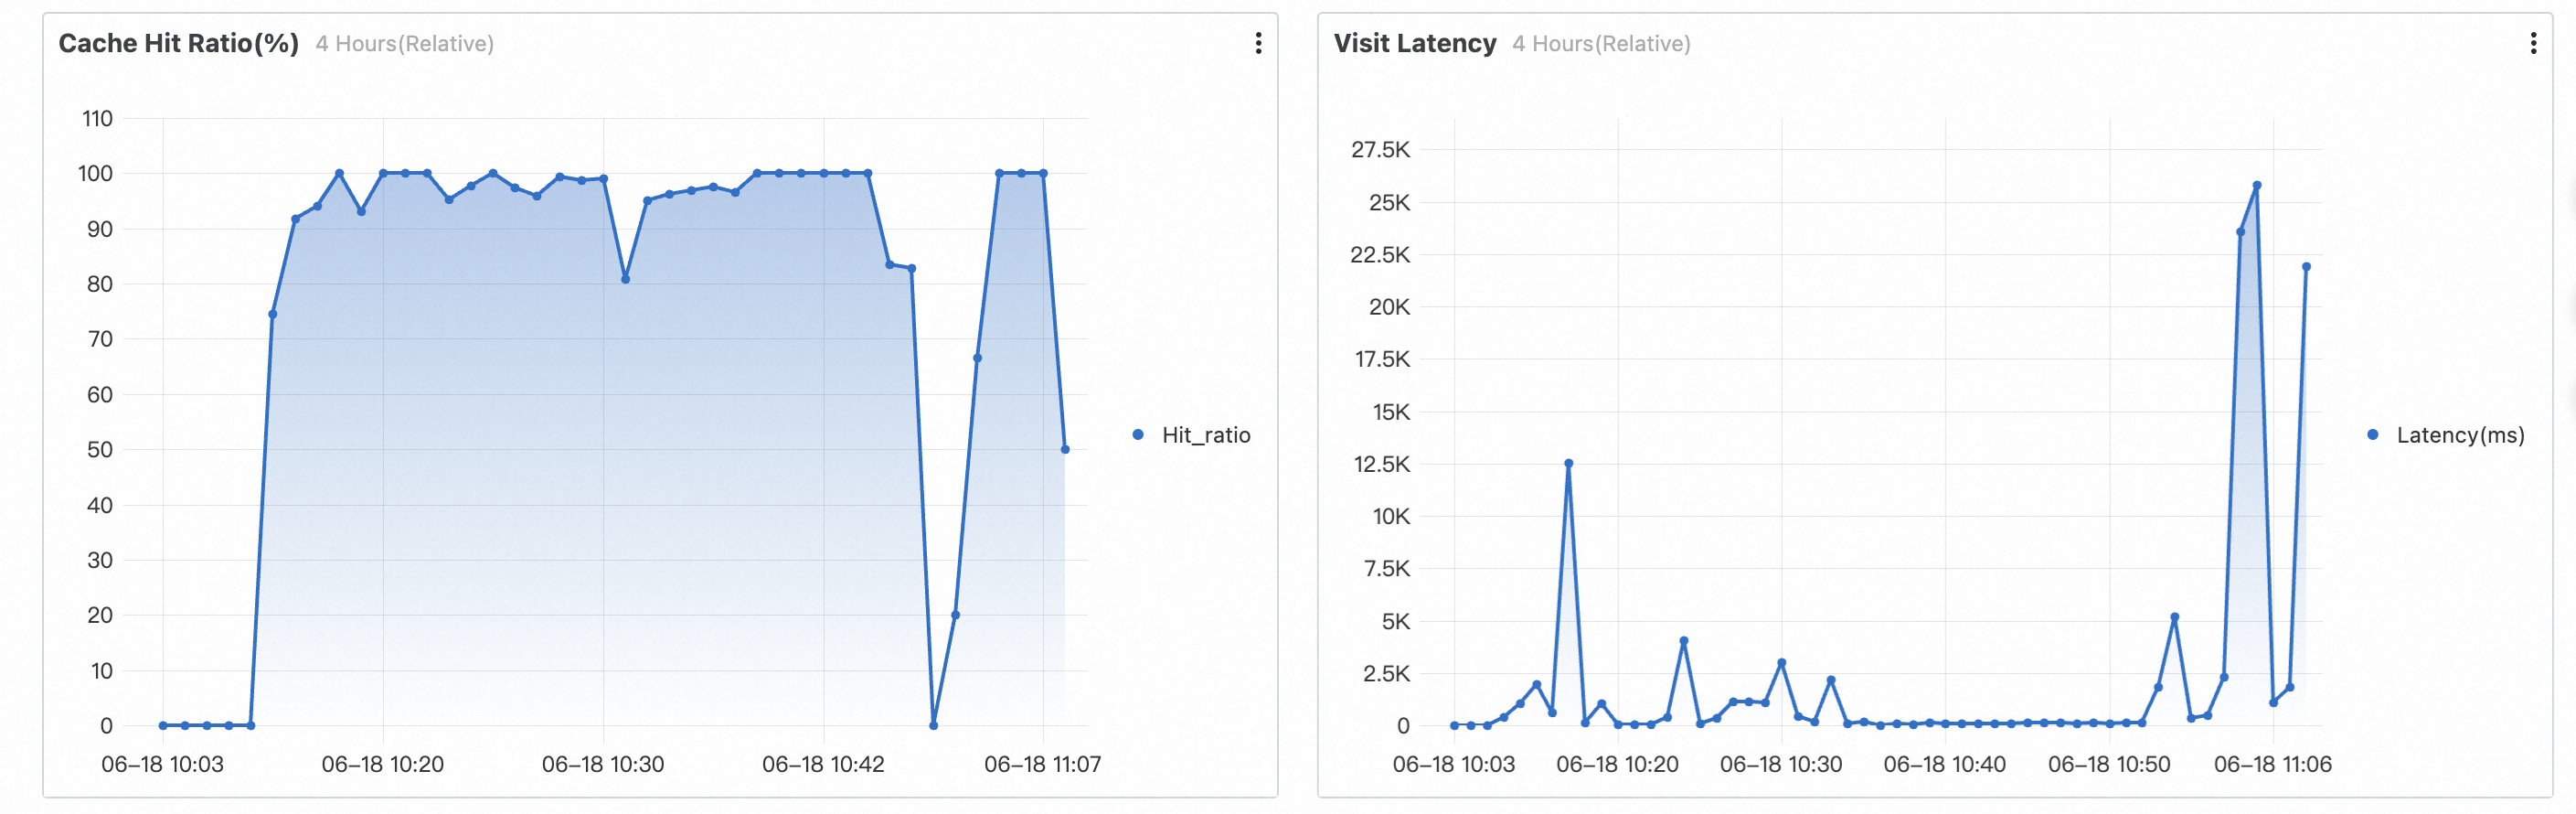
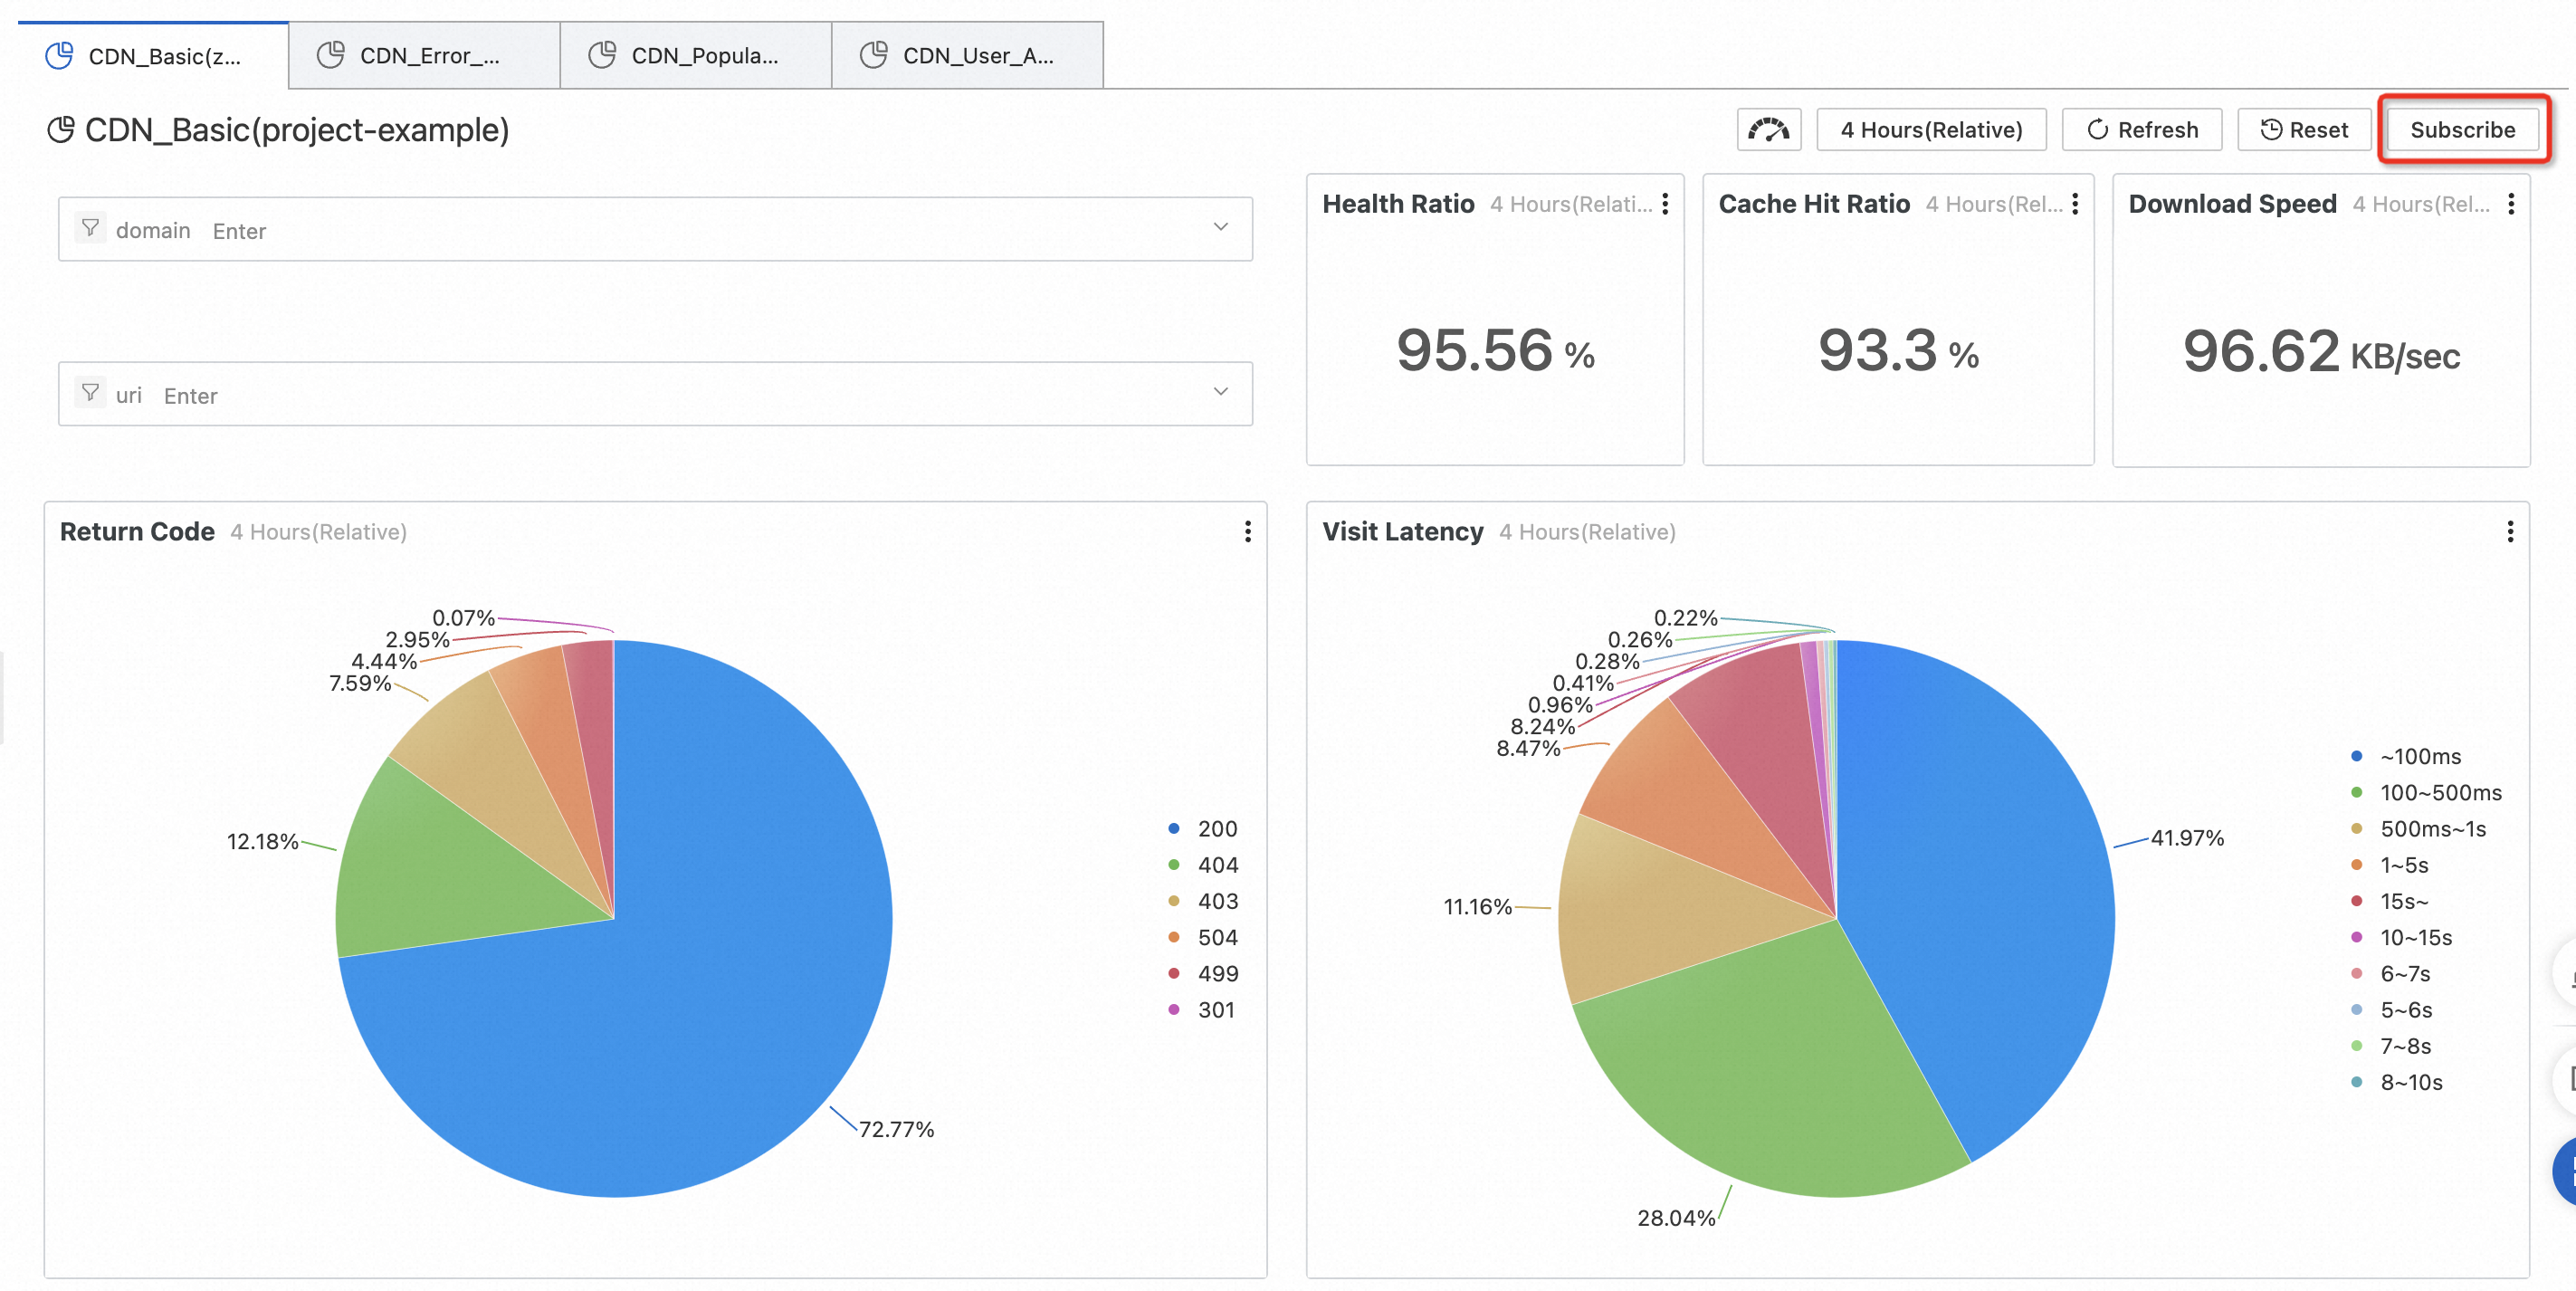
CDN basic data
Tracks overall CDN service quality and end-user access efficiency. Use this report to monitor cache performance and spot service quality issues as they happen.
| Metric | Description |
|---|---|
| Health | Percentage of responses with normal status codes |
| Cache hit ratio | Average cache hit ratio, calculated by bytes |
| Request hit ratio | Hit ratio calculated by number of requests |
| Download speed | Average download speed of resources |
| Access latency | Average latency for resource downloads |
| Access latency distribution | Percentage breakdown by latency range |
| Request bandwidth | Bandwidth at 1-minute granularity |
| Access status | Percentage breakdown by response status code |
| Number of visits/visitors | Page views (PV) and unique visitors (UV) |
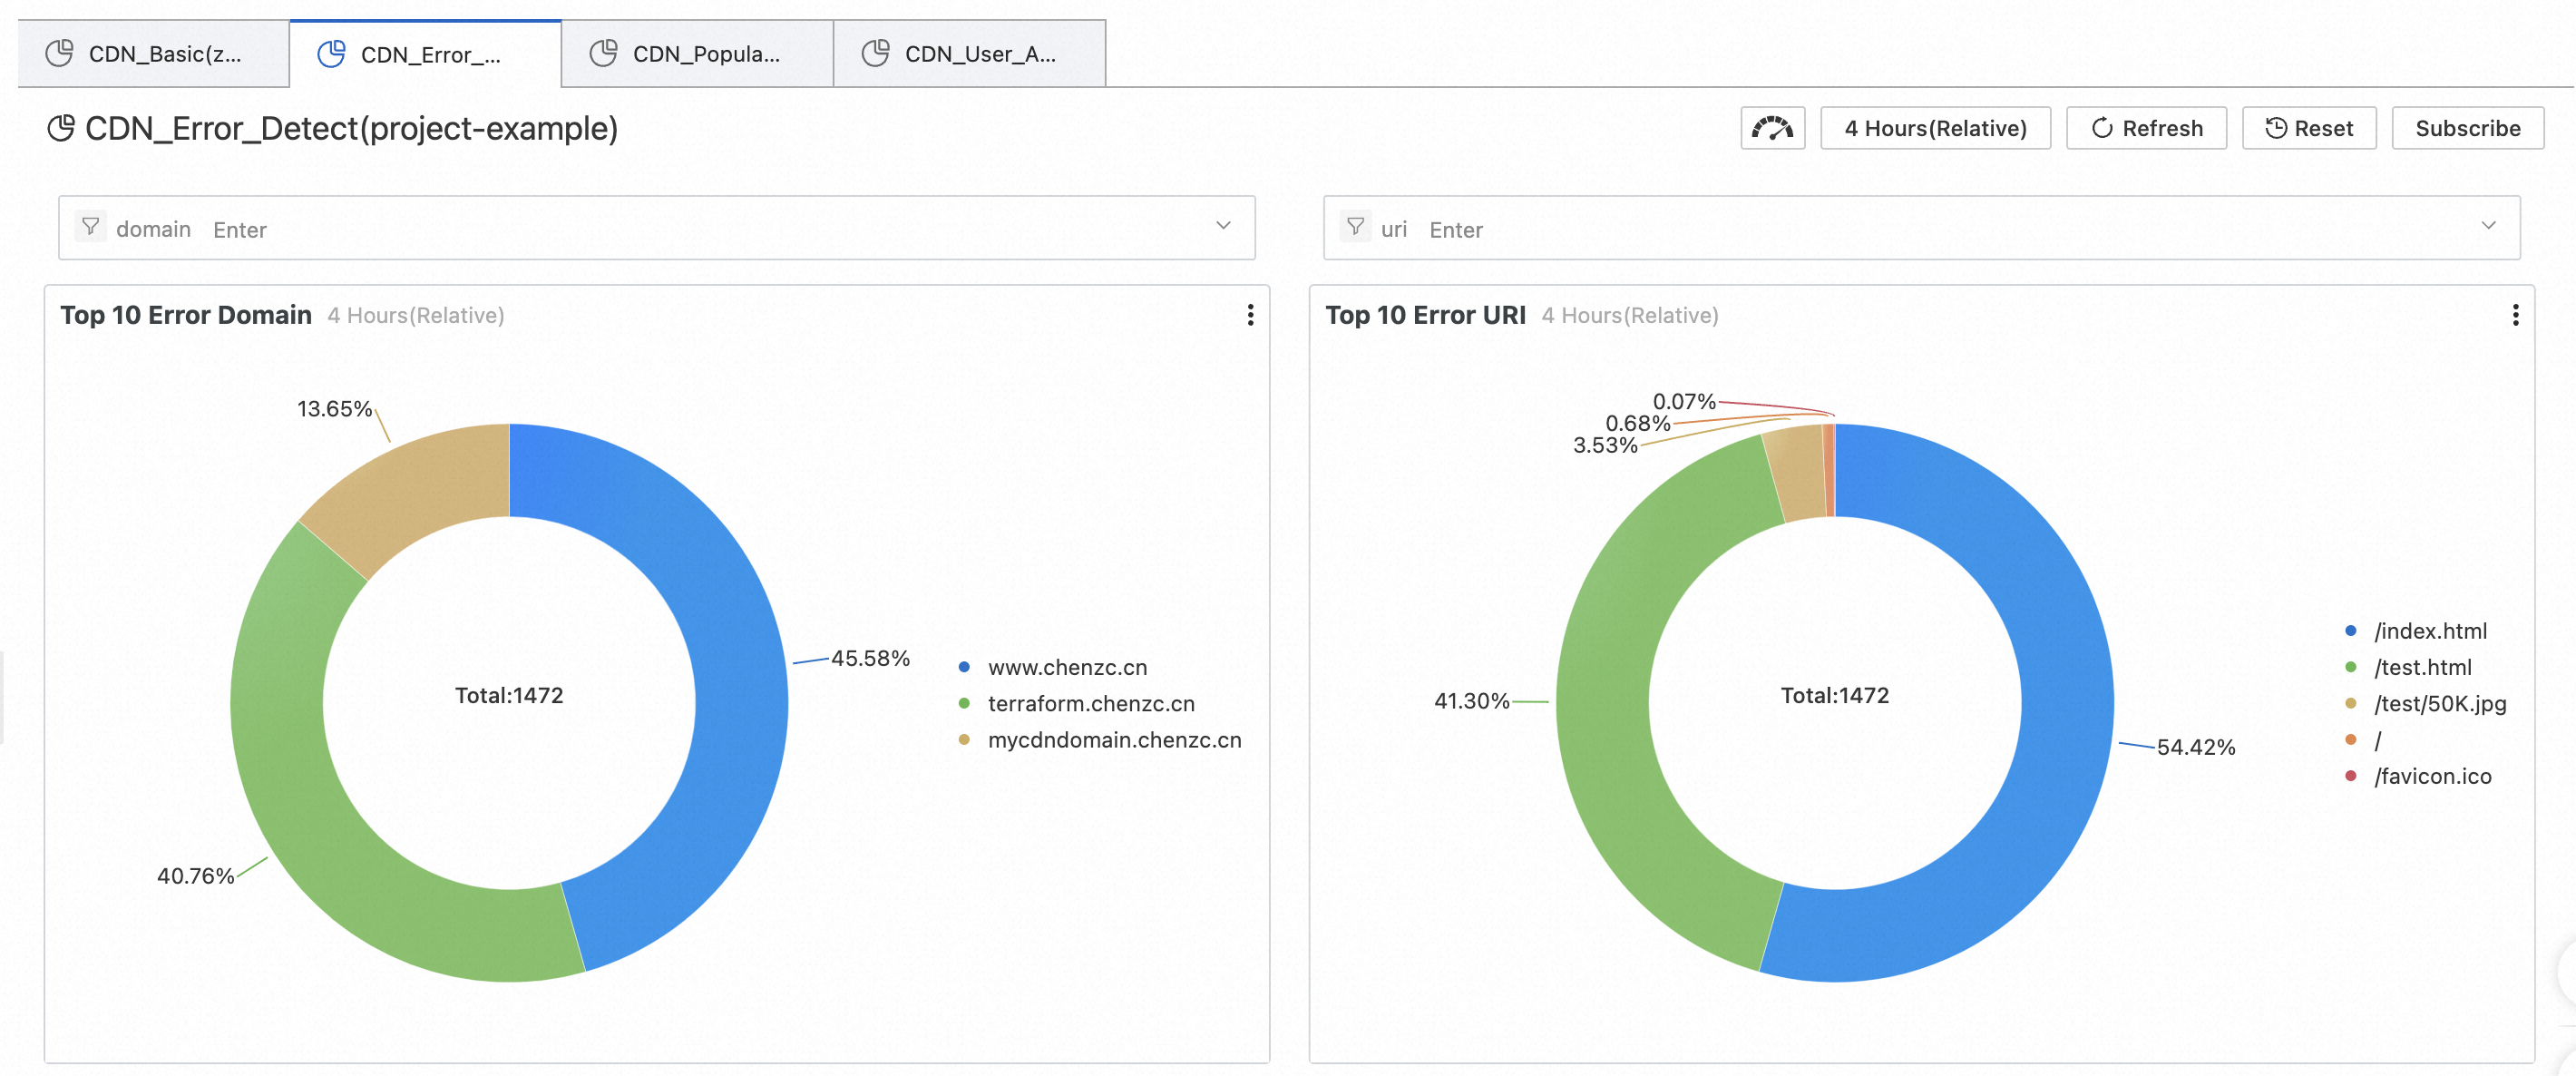
CDN access errors
Pinpoints the source of CDN service errors when requests are failing — such as problematic URIs, origin server issues, unavailable nodes, or regional carrier problems.
| Metric | Description |
|---|---|
| Top 10 error domain names | Domain names with the highest error percentages |
| Top 10 error URIs | URIs with the highest error percentages |
| Request error percentage | 4xx and 5xx status codes over time |
| Error request status distribution | Count and percentage per status code |
| Error statistics by carrier | 4xx and 5xx counts per carrier |
| Error statistics by province | 4xx and 5xx counts per province |
| Error details (4xx) | Count and percentage per province and carrier |
| Error details (5xx) | Count and percentage per province and carrier |
| Error distribution by client | 4xx and 5xx counts by User-Agent (UA) |
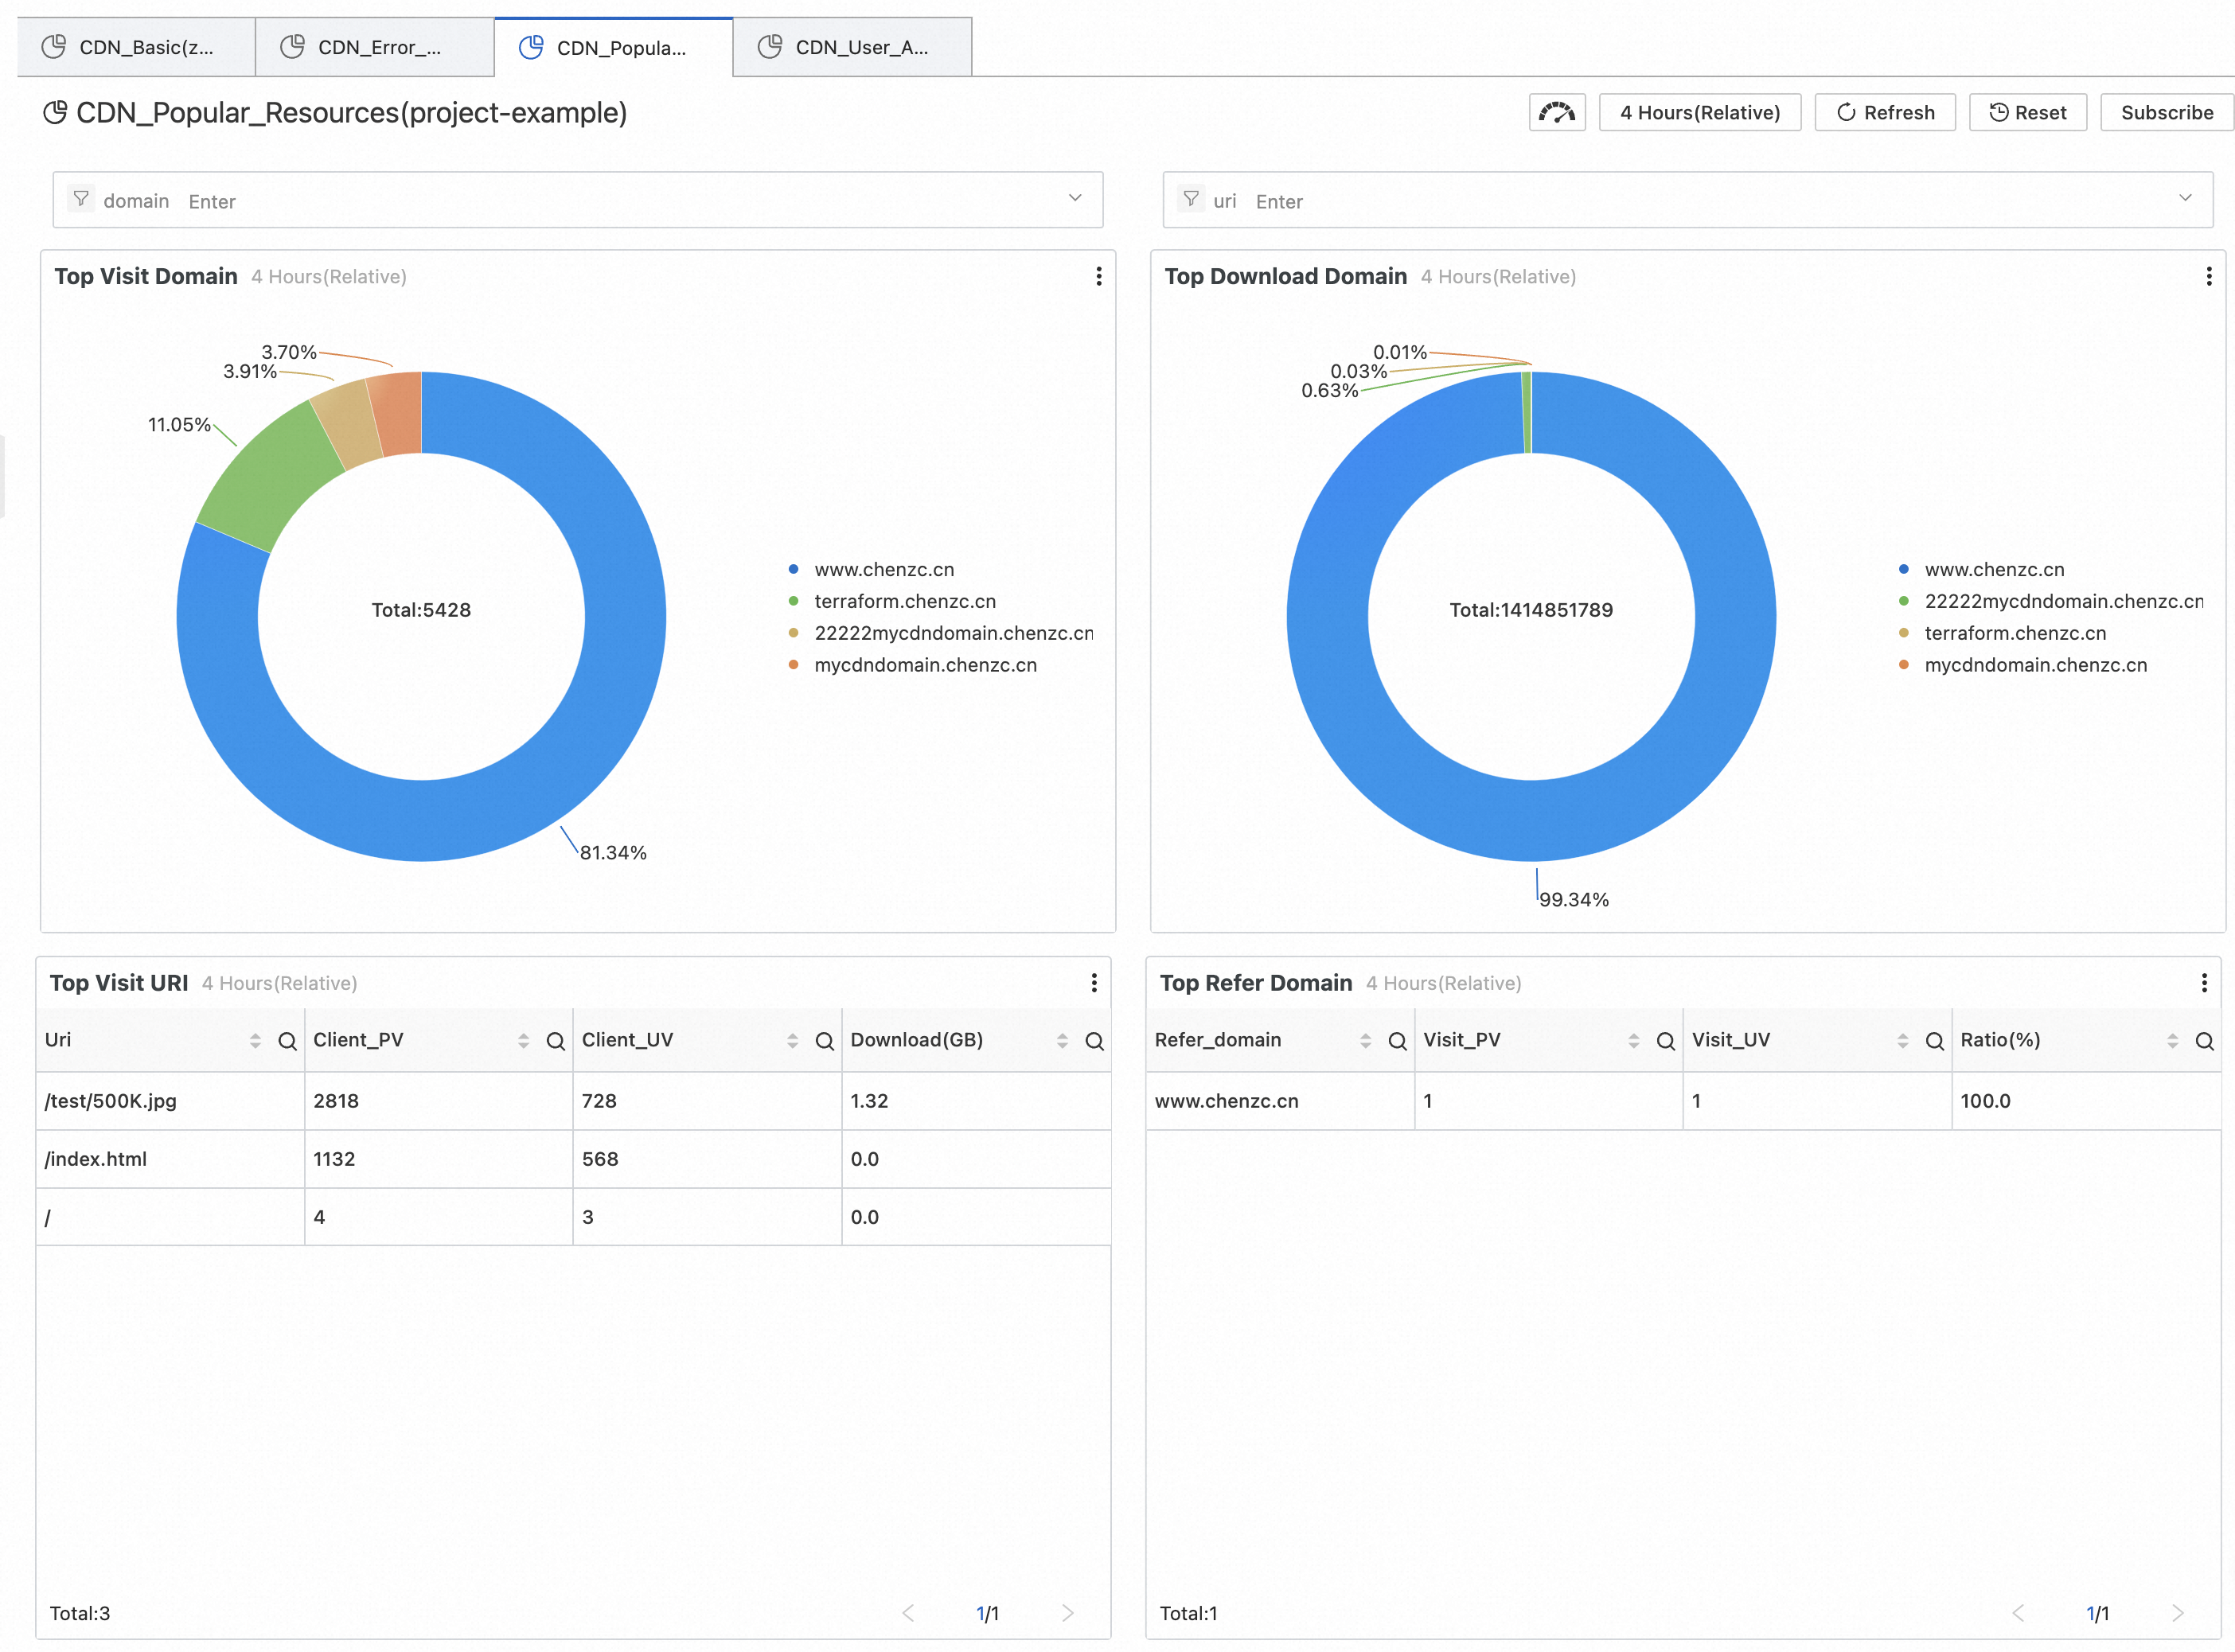
CDN hot spot resources
Shows which domain names, URIs, provinces, and carriers drive the most traffic. Use this report to assess the impact of campaigns and verify whether traffic spikes meet expectations.
| Metric | Description |
|---|---|
| Top domain names by number of visits | Domain names with the highest visit share |
| Top domain names by download traffic | Domain names with the highest download traffic share |
| Popular access URIs | Visit count, unique visitors (UV), and total download volume per URI |
| Popular access sources | Referer domain names with visit counts, UVs, and percentages |
| Nationwide visit statistics | Visit counts per province |
| Nationwide download speed | Average download speed per province |
| Statistics by province | Total visits, download traffic, and average download speed per province |
| Carrier traffic and speed | Total download volume and average download speed per carrier |
| Statistics by carrier | Total visits, download traffic, and average download speed per carrier |
CDN user composition
Breaks down who is accessing your content — by client type, province, and carrier. Also ranks users by access volume and download volume.
| Metric | Description |
|---|---|
| Number of visits | Total page views (PV) |
| Number of visitors | Total unique visitors (UV) |
| Access region distribution | Visit count and percentage per province |
| Access client statistics | Visit count and percentage per client type |
| Visit statistics by carrier | Visit count and percentage per carrier |
| Top users by download volume | Visits, error visits, and download volume grouped by IP address |
| Top users by valid visits | Visits, error visits, and download volume by IP address, excluding 4xx and 5xx responses |
Run custom log analysis
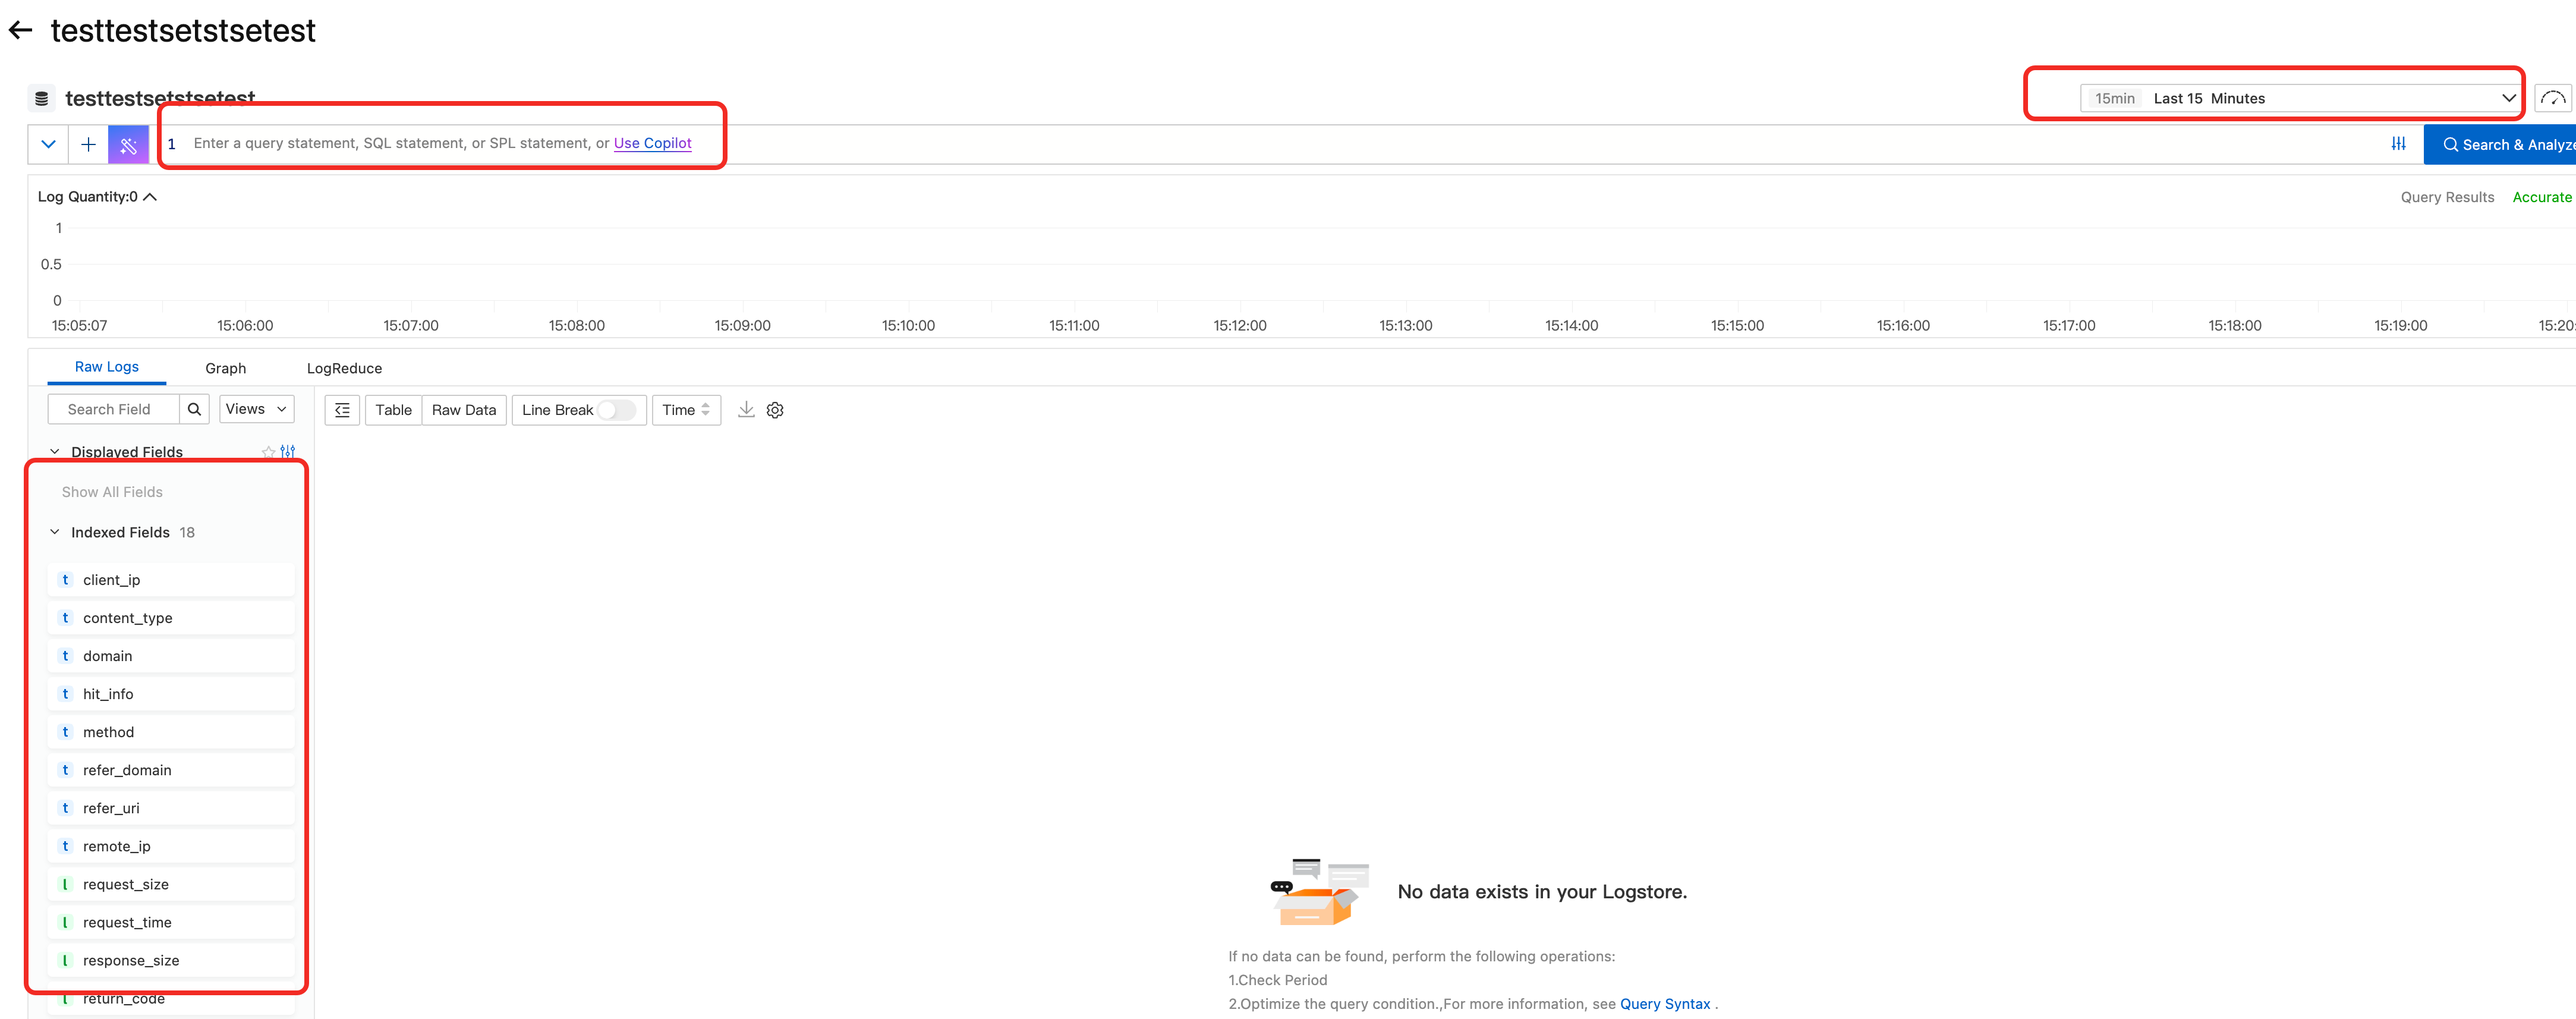
If the preset reports don't cover your use case, query the raw logs directly. On the real-time log feature page, find your project and click Log Analysis to open the query interface.
Enter a search statement in the search box for complex filter conditions. For simple filtering, click a field value in the Raw Logs panel on the left.
Example 1: Rank domain names by the number of 499 responses in the last 30 days.
return_code = 499| select domain , count(*) as c group by domain order by c desc limit 10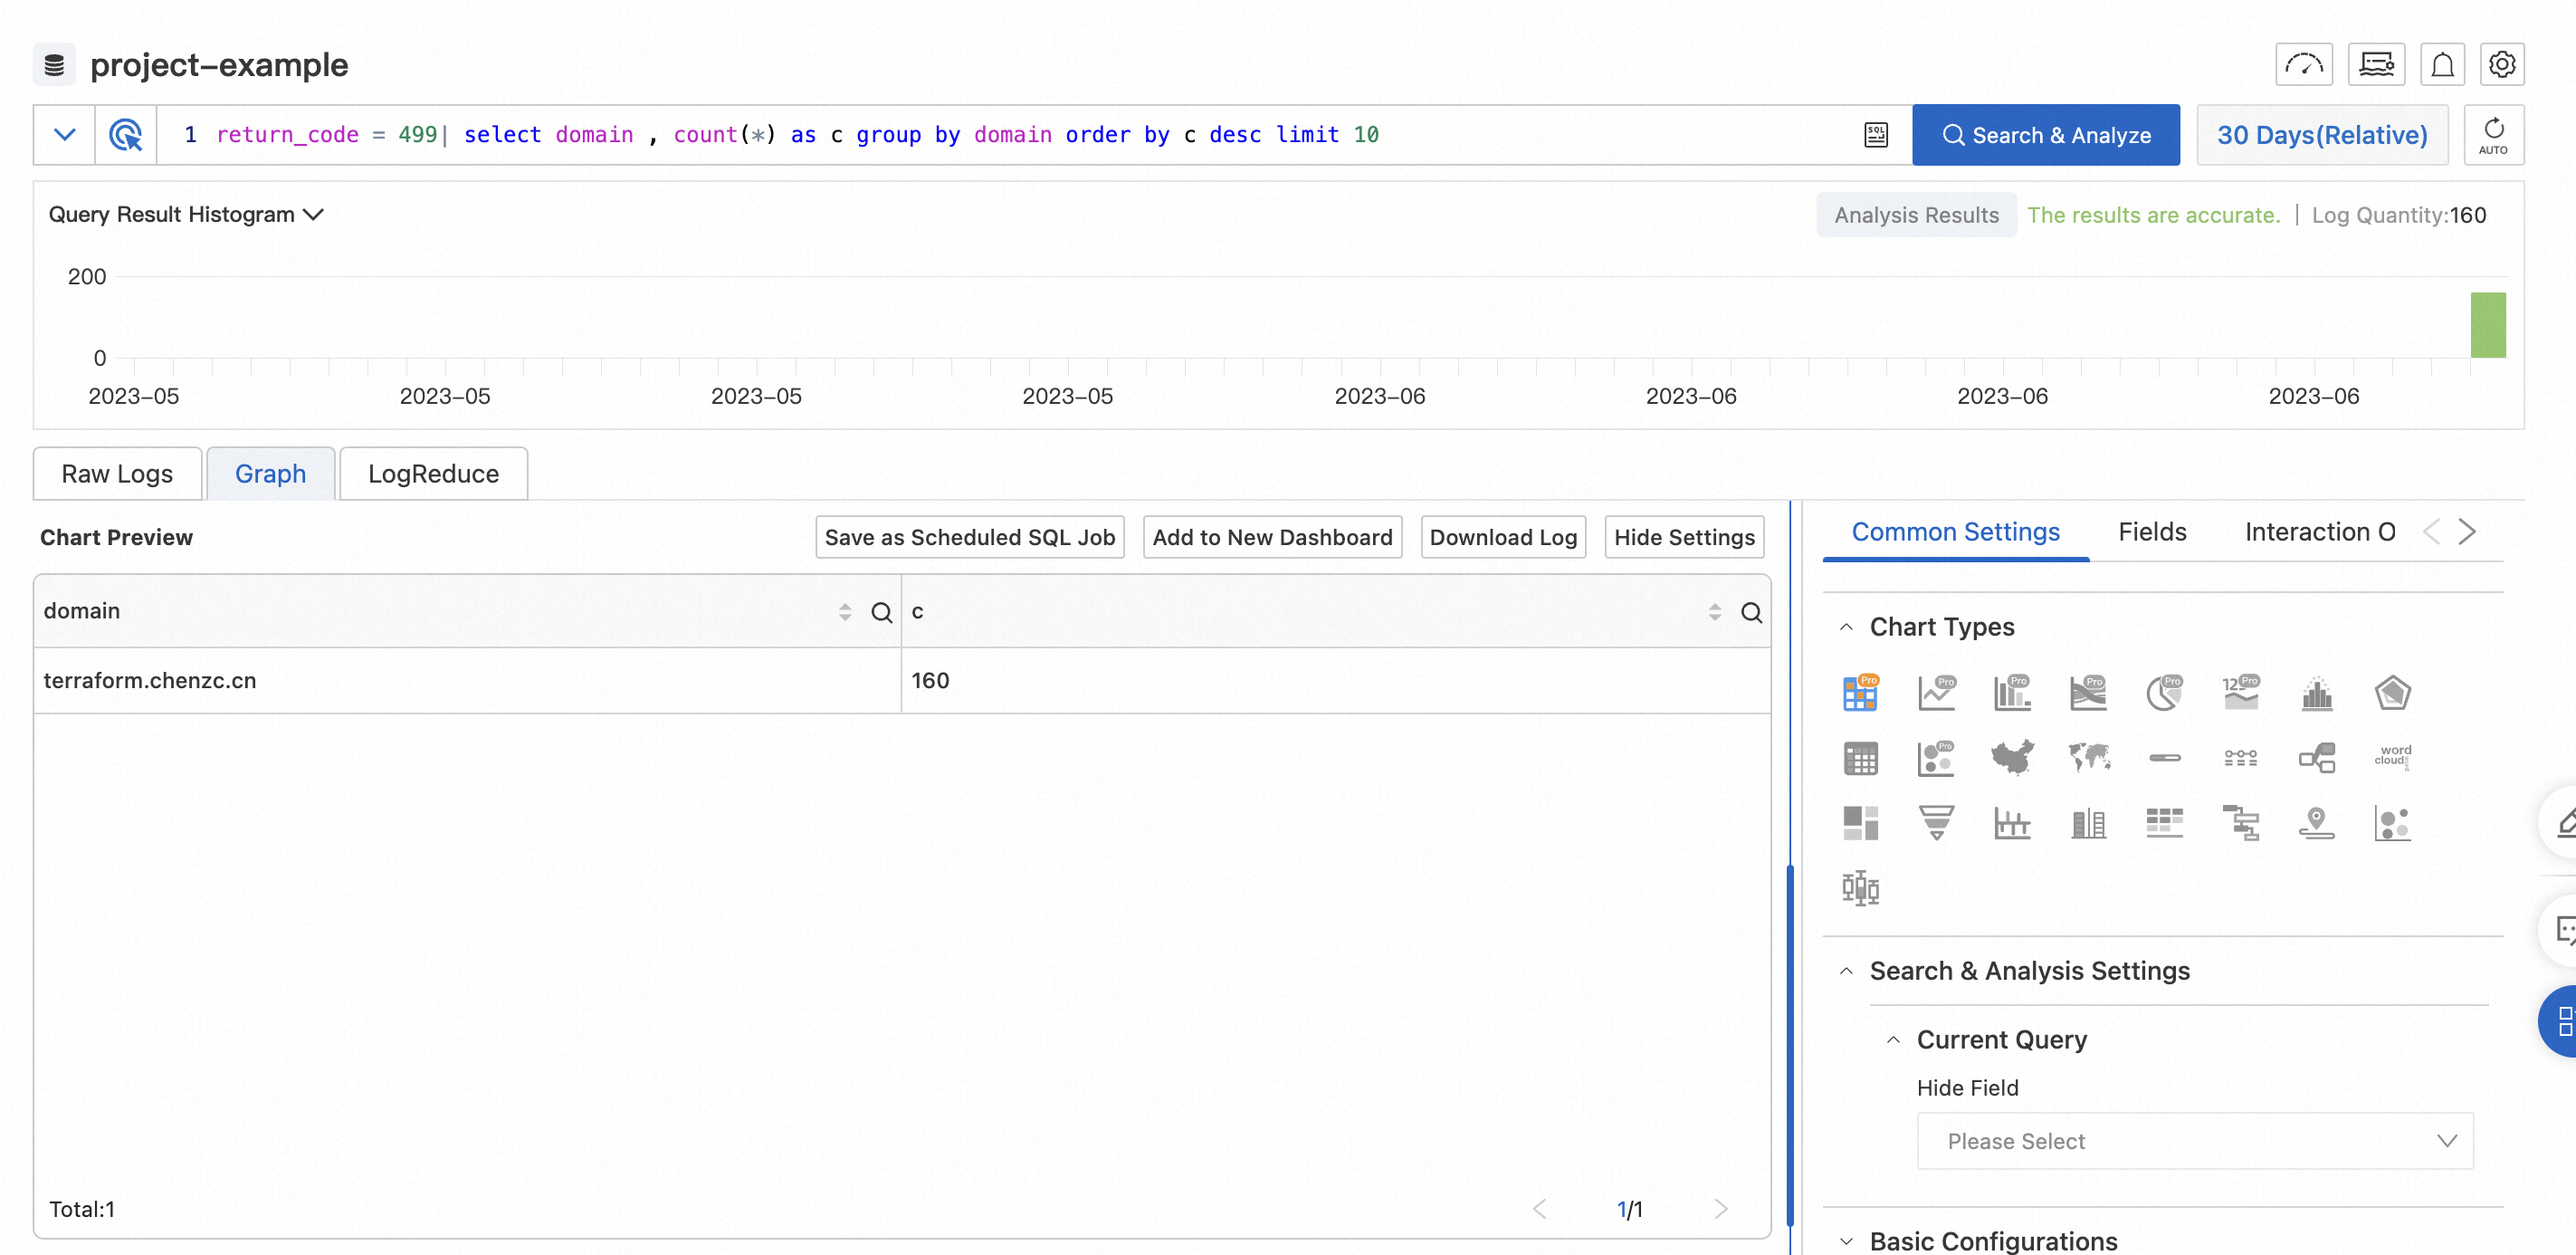
Example 2: Rank domain names by the number of 502 responses in the last 30 days.
return_code = 502| select domain , count(*) as c group by domain order by c desc limit 10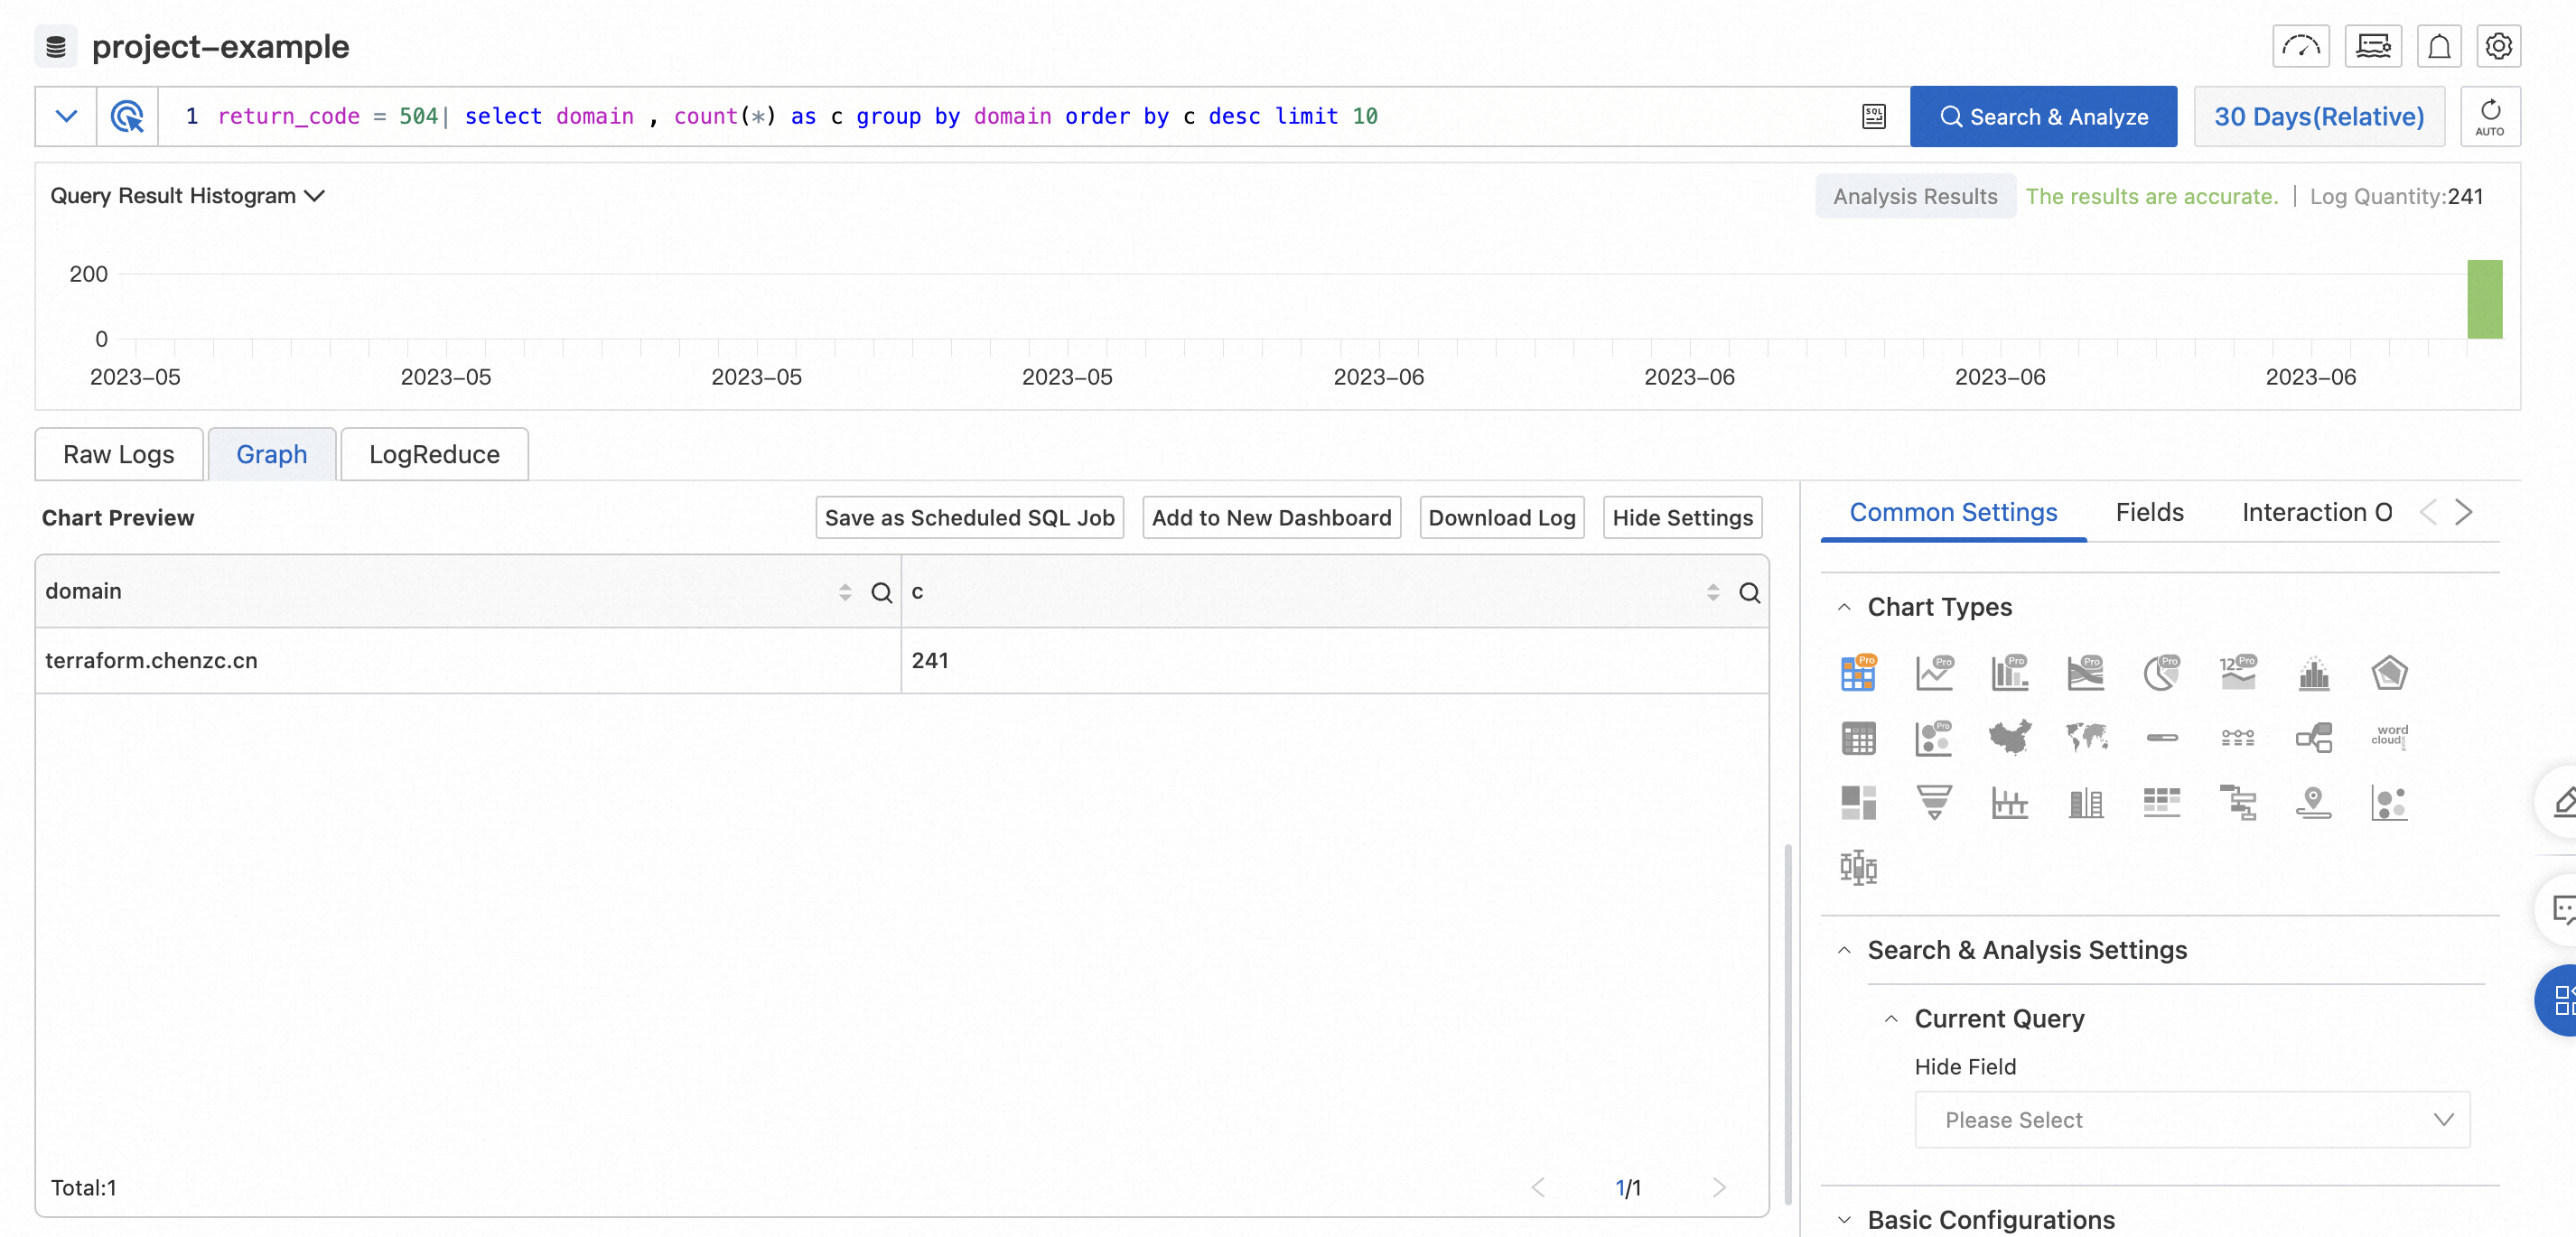
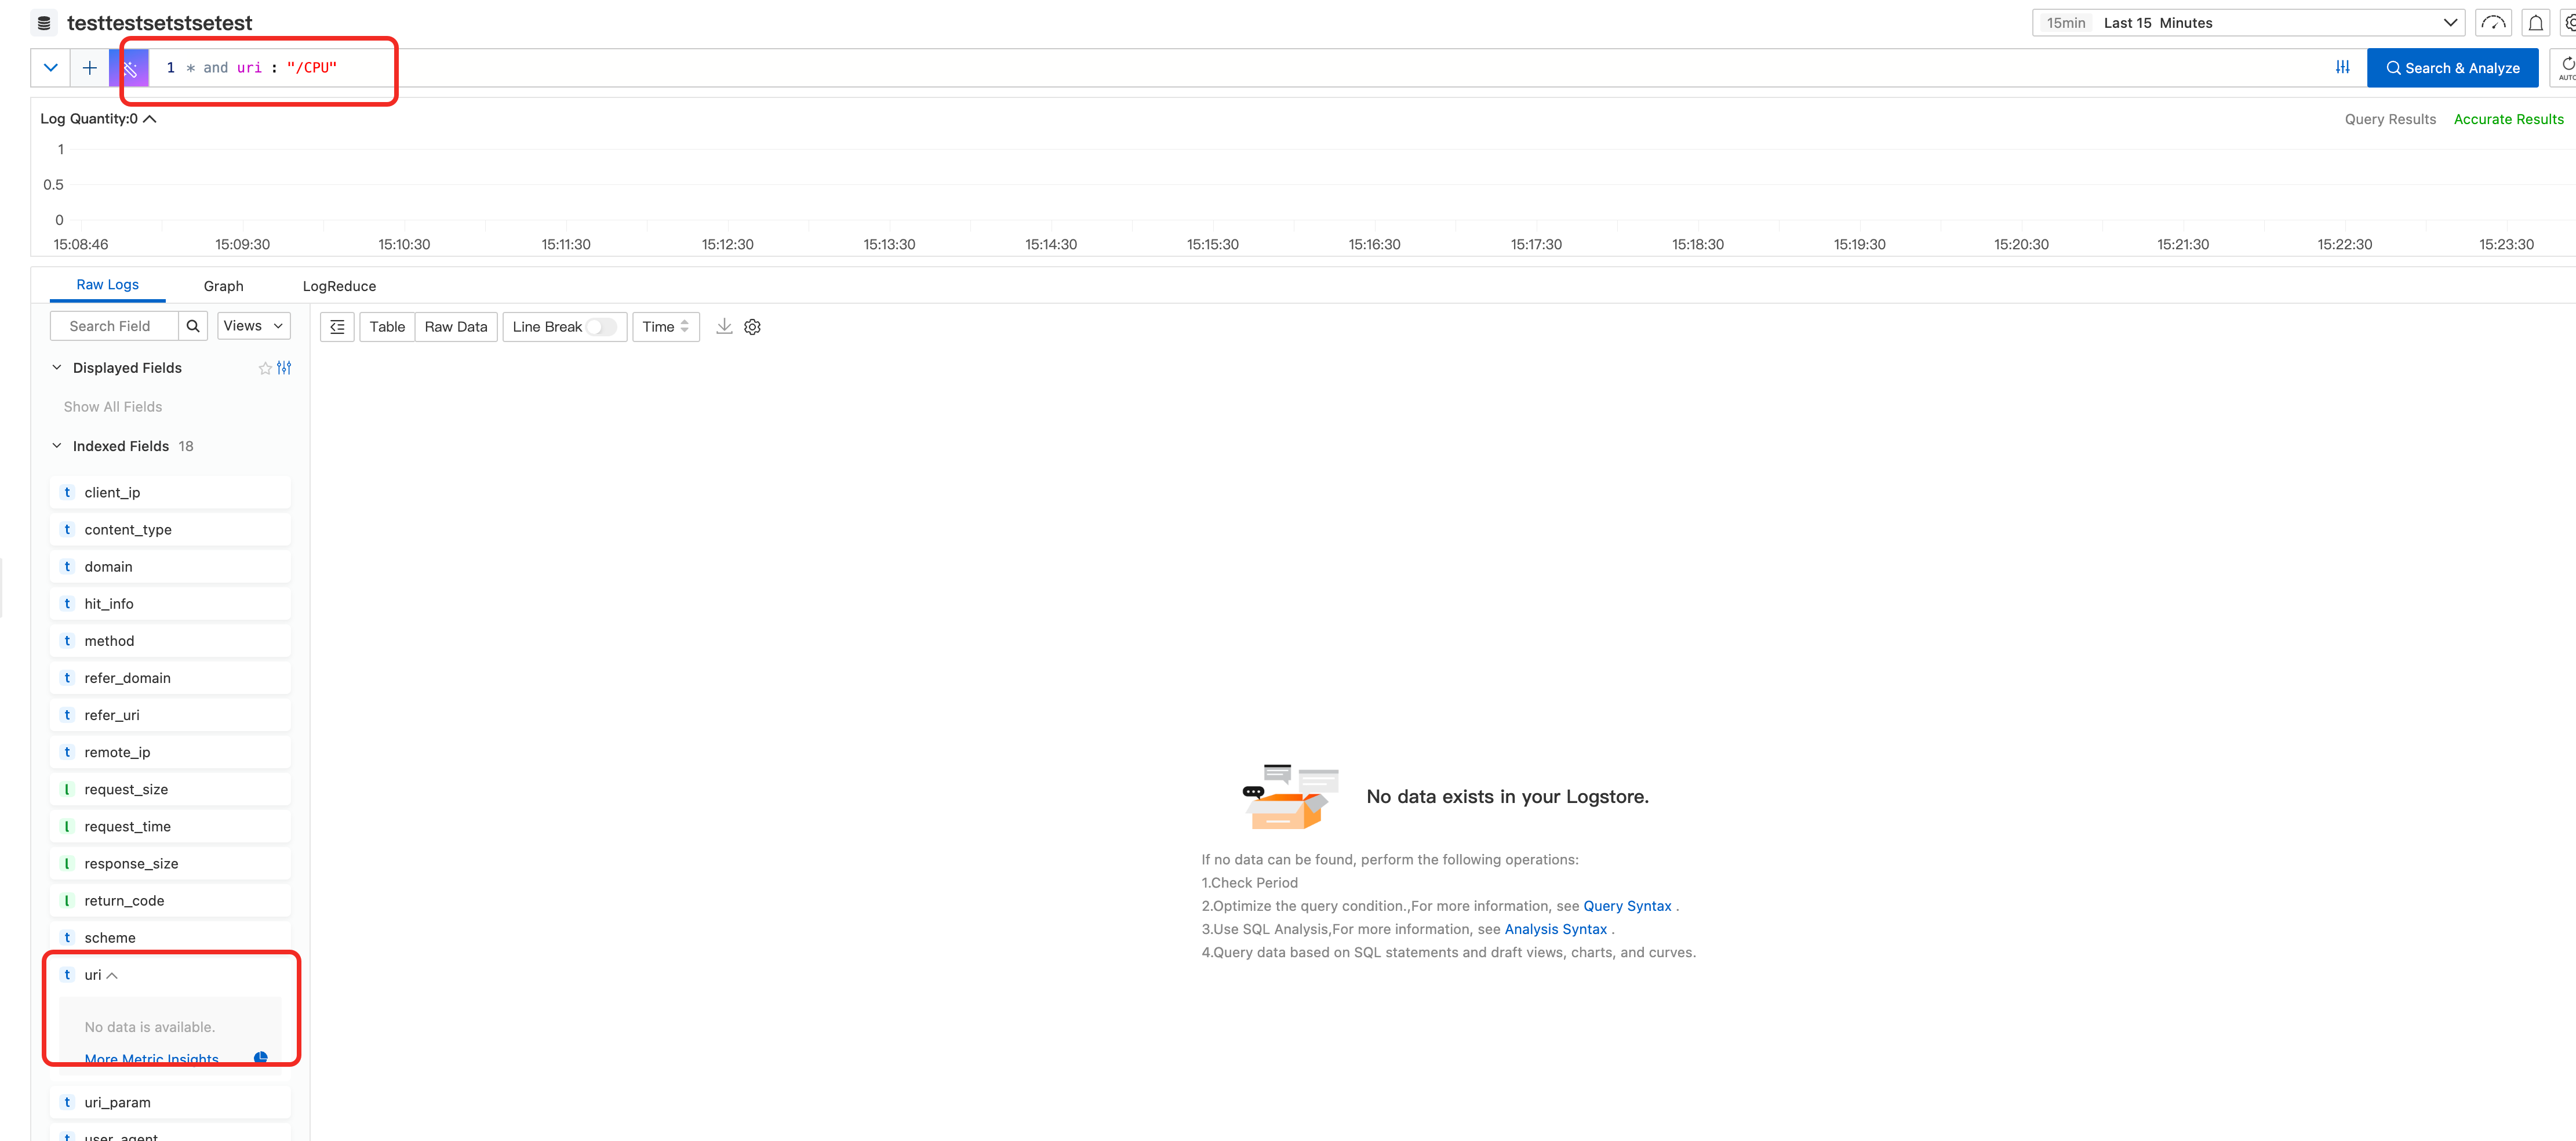
Example 3: Filter log data for a specific URI — for example, /cpu — in the last 30 days.
Click the URI field in the Raw Logs panel, then click /cpu to apply the filter.
Subscribe to report data
To receive periodic snapshots of a report template by notification, use the subscription feature.
On a report page (for example, CDN basic data), click Subscribe in the upper-right corner, then click Create.
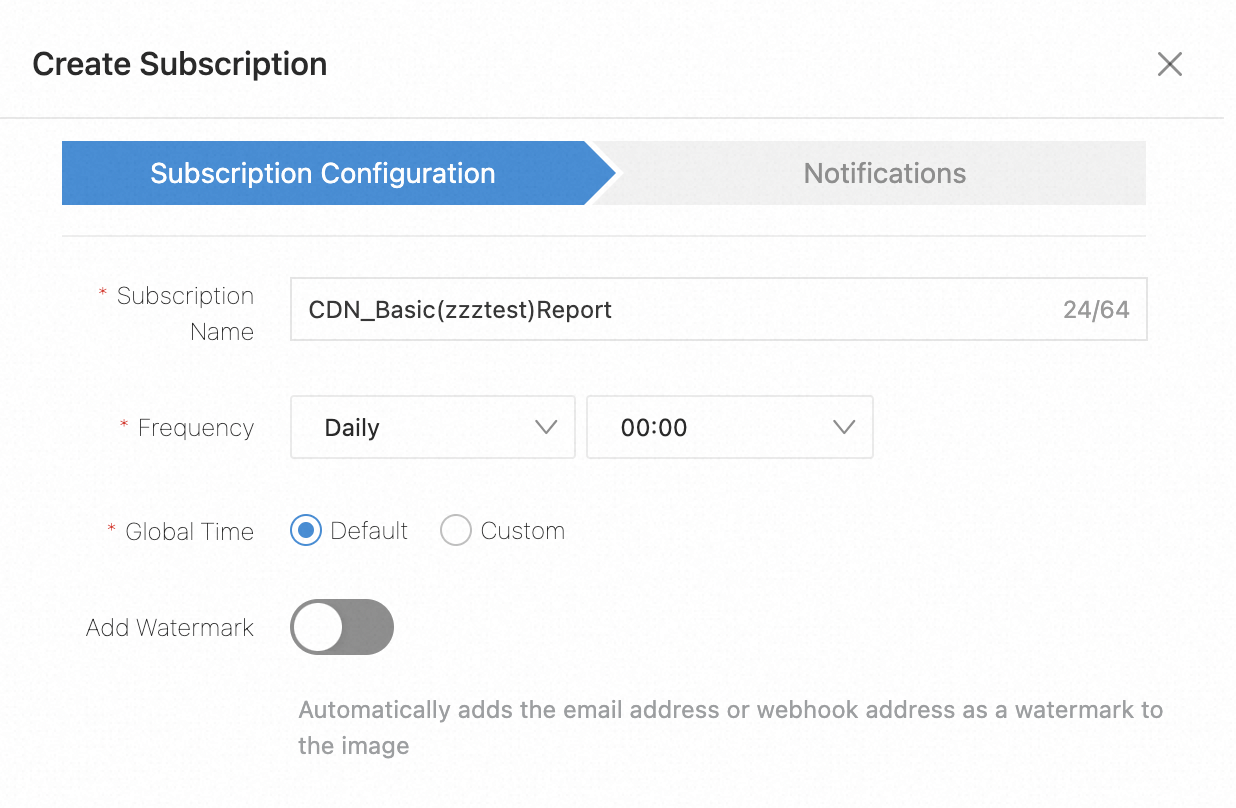
Enter a Subscription Name, Frequency, and Global Time, then click Next.
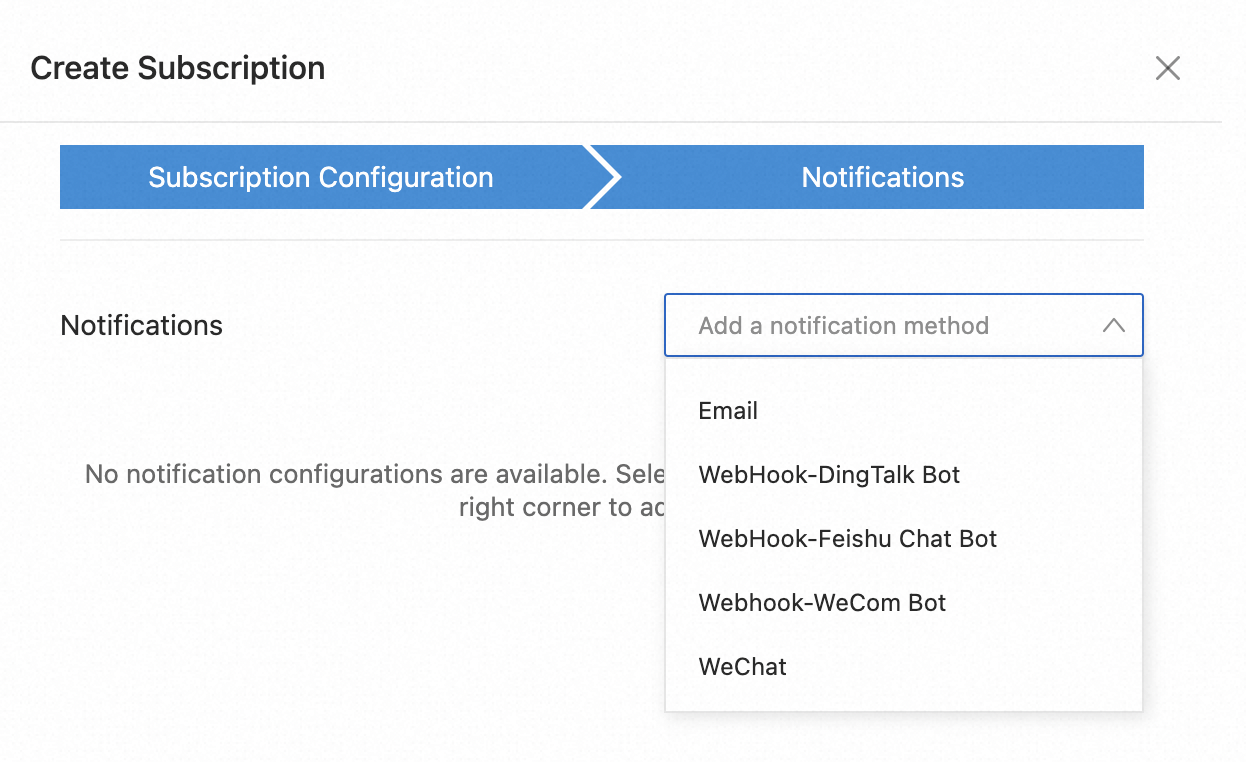
From the Notification List drop-down menu, select a notification method, fill in the required information, and click Submit. Supported notification methods: Email, webhook-DingTalk Robot, webhook-Lark Robot, webhook-WeCom Robot, and WeChat.
What's next
Preset report: CDN basic data
Preset report: CDN access errors
Preset report: CDN hot spot resources
Preset report: CDN user composition
Custom reports