CAPTCHA 2.0 log service records every initialization and authentication request and stores them in Simple Log Service (SLS). SLS provides built-in query, charting, and alerting capabilities, so you get a ready-to-use platform for security analytics — no additional infrastructure required. Use the logs to monitor pass rates, investigate failures, detect bot activity, and identify high-volume or anomalous clients.
Billing
Log fees are charged directly by SLS and are not included in your CAPTCHA bill. CAPTCHA does not charge any fees for log service usage.
After you enable the log service, all costs are billed by SLS.
Enable the log service
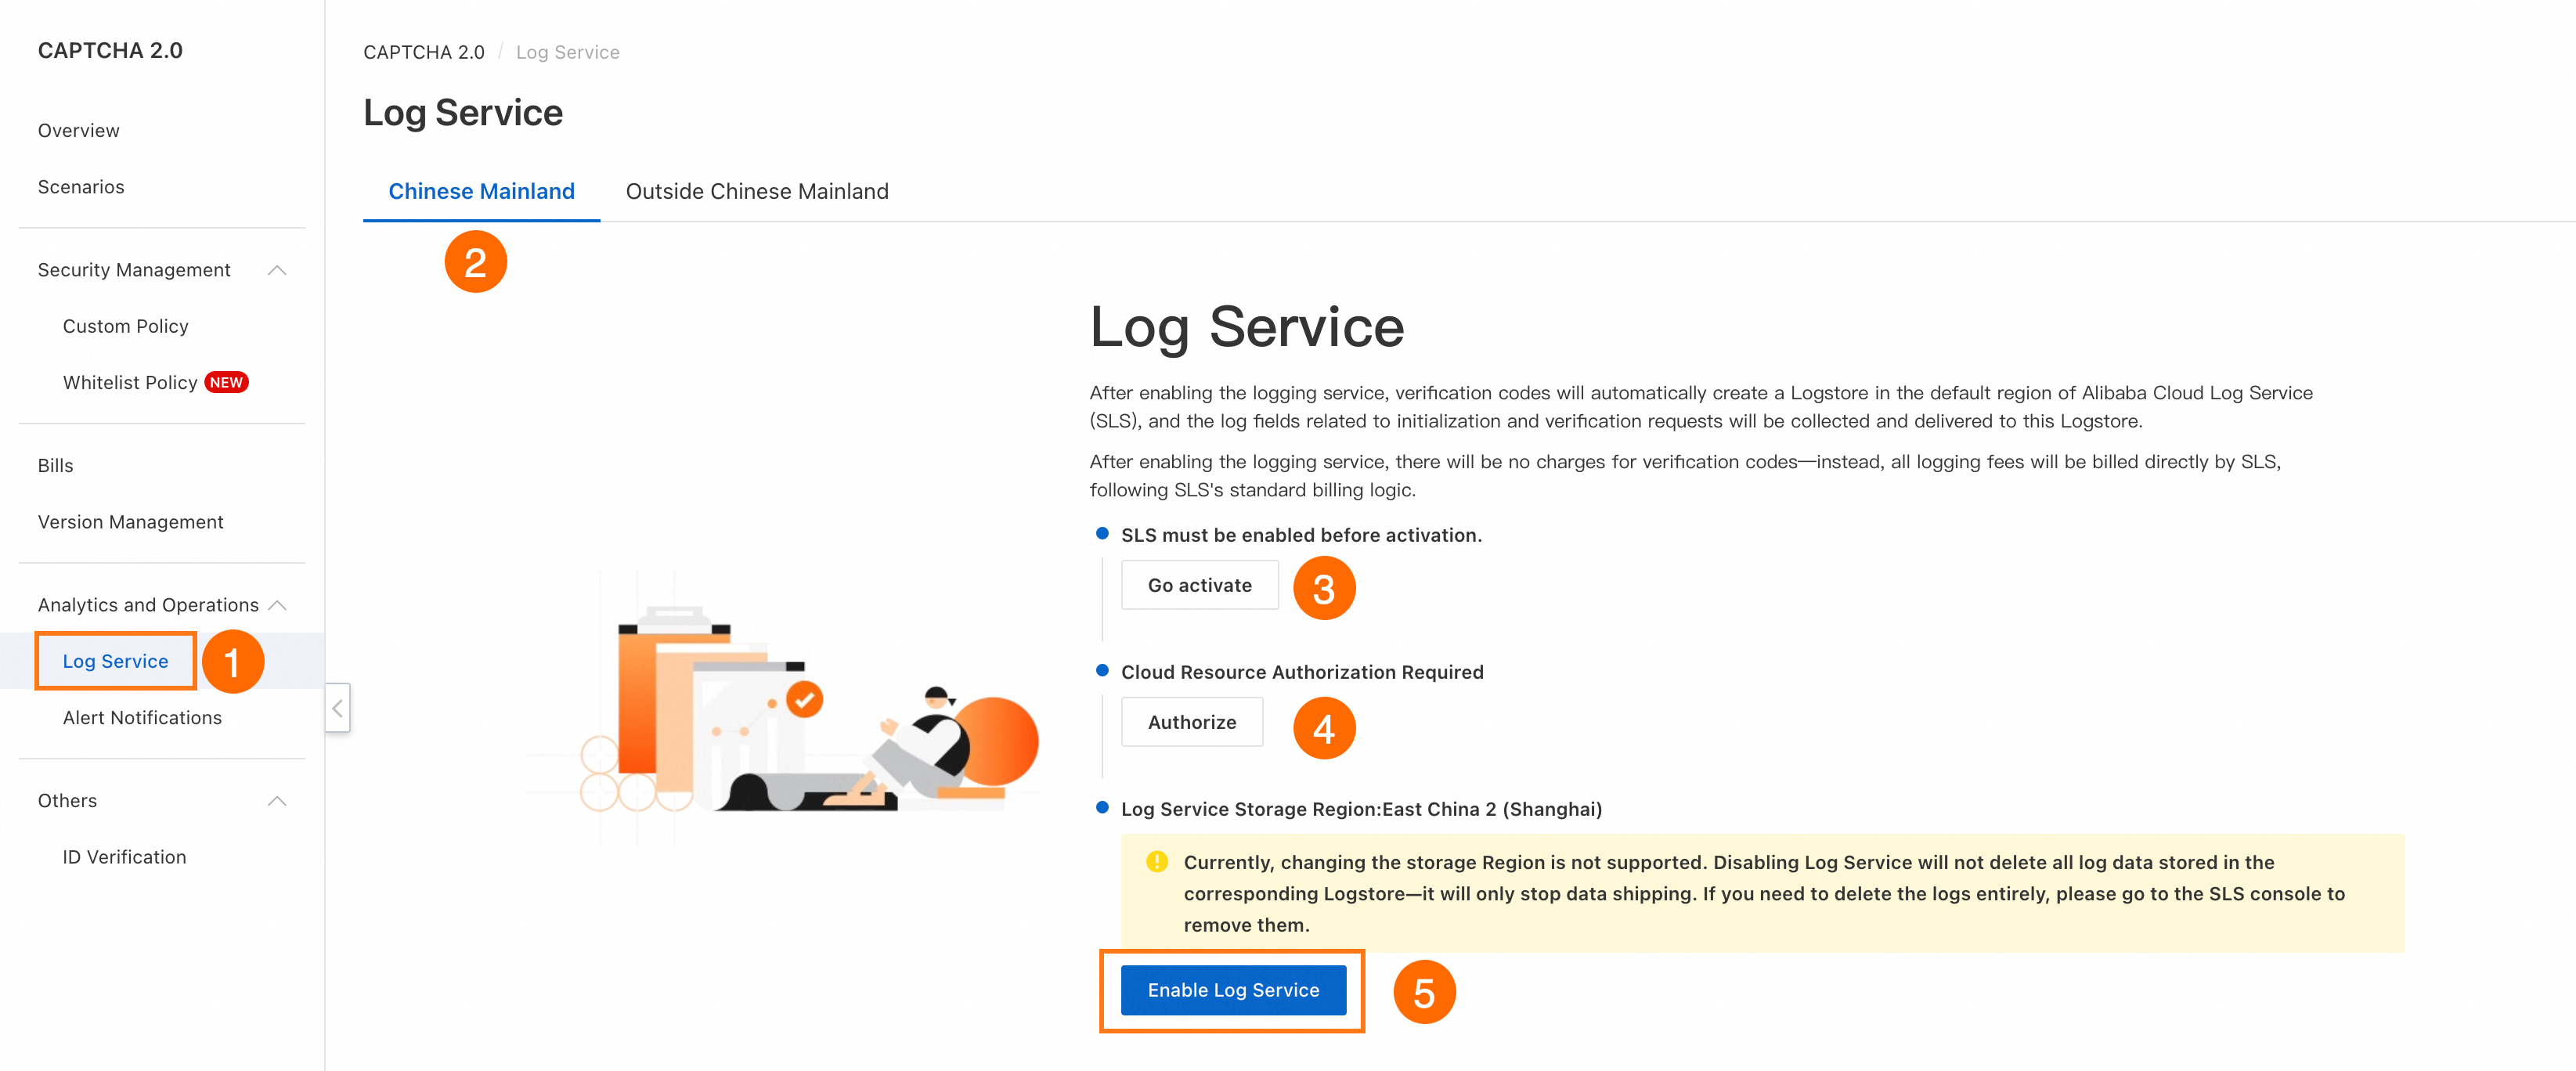
Log on to the CAPTCHA 2.0 consoleCAPTCHA 2.0 console and go to the Log Service page.
Select the region that matches your CAPTCHA requests: Chinese Mainland or Outside Chinese Mainland.
NoteLogs are stored in the region's default location and are never transferred cross-region. Default storage locations:
Chinese Mainland: China (Shanghai)
Outside Chinese Mainland: Singapore
If SLS is not activated for your account, click Activate to activate it.
Click Authorize and follow the on-screen instructions to grant CAPTCHA access to your cloud resources.
Click Enable Log Service. Creating the Logstore and building the indexes takes 1 to 2 minutes.
Disable the log service
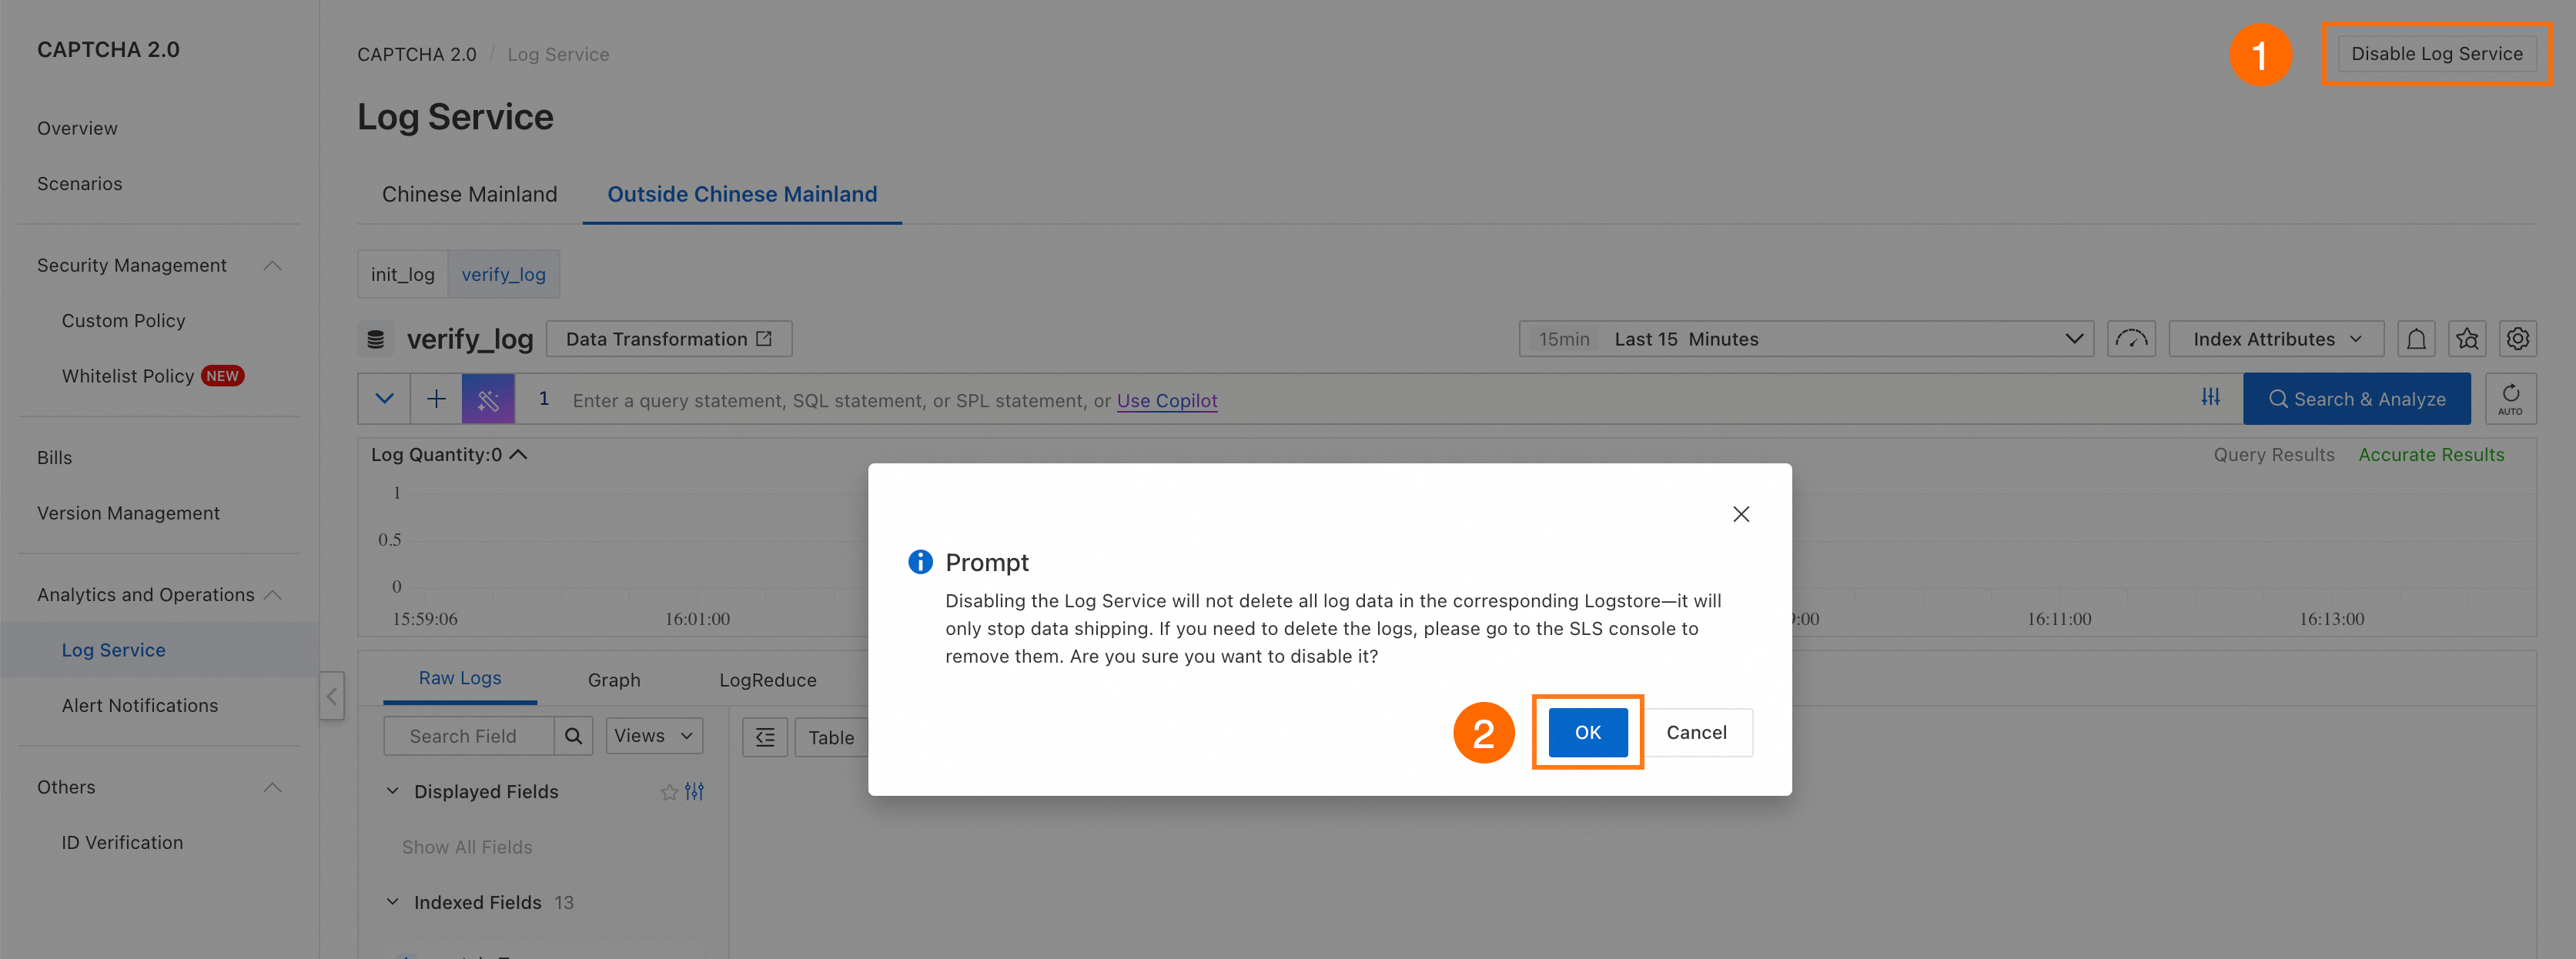
Log on to the CAPTCHA 2.0 consoleCAPTCHA 2.0 console, go to the Log Service page, and select your region.
In the upper-right corner, click Disable Log Service, then click OK to confirm. After the service is disabled, the SLS page shows that the service is not enabled.
Log field reference
Initialization request log fields
Field | Description | Example |
| Unique ID for a single authentication session. Correlate with the authentication log to trace a complete authentication attempt. |
|
| Challenge type presented in the initial authentication. The following values are available:
|
|
| Challenge type used in the secondary JavaScript Challenge. Equals The following values are available:
|
|
| Unix timestamp (milliseconds) of the initialization request. |
|
| Unique ID for this individual request. |
|
| ID of the scenario configured in the console. Filter logs by this field to scope analysis to a specific business scenario. |
|
| IP address of the client. Use to detect high-volume sources or geographic anomalies. |
|
| Browser type, version, and OS reported by the client. |
|
Authentication request log fields
Field | Description | Example |
| Unique ID for the authentication session. Matches the |
|
| Challenge type used in the initial authentication. The following values are available:
|
|
| Challenge type used in the secondary JavaScript Challenge. Equals |
|
| Unique ID for this individual request. |
|
| ID of the scenario configured in the console. |
|
| Unix timestamp (milliseconds) of the authentication request. |
|
| Authentication outcome: |
|
| Result code providing detail on the authentication outcome. See V3 client architecture response data for the full list of codes. |
|
| IP address of the client. Use with |
|
| Browser type, version, and OS reported by the client. |
|
| Business page URL where CAPTCHA was triggered. Use to identify which pages generate the most authentication requests. |
|
| Device-level unique ID. Use to calculate per-device metrics and detect repeated attempts from the same device. |
|
Log query examples
Run the following queries in the SLS query console after enabling the log service.
Look up a specific authentication session
Use certifyId to retrieve the full details of a single user's authentication attempt:
certifyId: xxxxxx | select from_unixtime(verifyTime / 1000) as time, clientIp, verifyResult, verifyCodeUse requestId to retrieve the same information by request ID:
requestId: xxxxxxxx-xxxx-xxxx-xxxx-xxxxxxxx | select from_unixtime(verifyTime / 1000) as time, clientIp, verifyResult, verifyCodeAnalyze traffic by page URL
Identify which pages generate the most authentication requests for a given scenario:
sceneId: xxxxxx | select url, count(1) as t group by url order by t descCheck pass and fail rates
See the distribution of verifyResult values for a scenario to understand overall authentication success:
sceneId: xxxxxx | select verifyResult, count(1) as t group by verifyResult order by t descDiagnose failure patterns
For failed authentications, group by verifyCode to identify the most common failure reasons:
sceneId: xxxxxx and verifyResult: false | select verifyCode, count(1) as t group by verifyCode order by t descMap client IP locations
Identify the highest-volume client IPs and their geographic locations. A sudden spike from an unexpected region may indicate bot activity:
sceneId: xxxxxx | select clientIp, ip_to_country(clientIp) as country, ip_to_province(clientIp) as province, count(1) as t group by clientIp, country, province order by t descDetect repeated attempts by device
Find devices generating the most authentication requests. A high request count for a single umid may indicate automated or replay attacks:
sceneId: xxxxxx | select umid, count(1) as t group by umid order by t desc