The Auto Scaling monitoring feature enables you to view the monitoring metrics of all ECS instances in a scaling group, such as CPU, memory, load, system disk, and network metrics. This helps you understand the resource utilization of the scaling group over a period of time.
Background information
This topic applies only to ECS scaling groups. The monitoring metrics include the following sub-metrics:
-
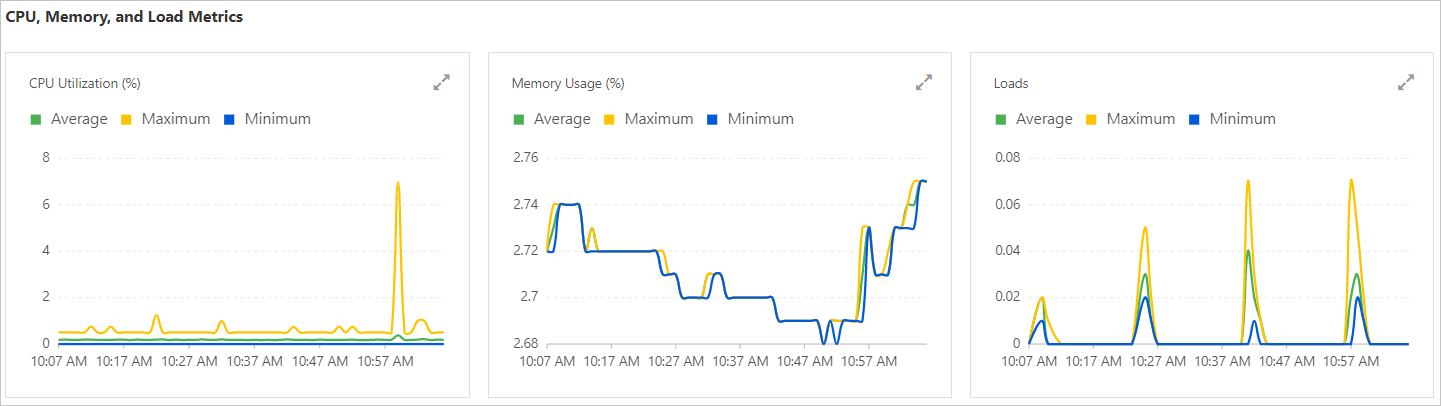
CPU/Memory/Load metrics: Includes the CPU Utilization (%), Memory Usage (%), and Loads monitoring metrics.
-
System disk metrics: Includes the System Disk Read/Write BPS (byte/s) and System Disk IOPS (count/s) monitoring metrics.
-
Network metrics: Includes the Public Bandwidth (bit/s) and Internal Bandwidth (bit/s) monitoring metrics.
-
QPS metrics: Includes the (ALB) QPS per Backend Server monitoring metric.
For more information about the monitoring metrics supported by system monitoring event-triggered tasks, see System monitoring event-triggered tasks.
Procedure
Log on to the Auto Scaling console.
In the navigation pane on the left, click Scaling Groups.
In the top navigation bar, select a region.
Find the scaling group that you want to manage and open its details page in one of the following ways:
In the Scaling Group Name/ID column, click the ID of the scaling group.
In the Actions column, click Details.
-
At the top of the page, click the Monitoring tab.
-
View the changes in the monitoring metrics of the instances in the scaling group.
The following figure shows an example of a monitoring chart for CPU/Memory/Load metrics.
-
Click a monitoring dimension above the monitoring chart, such as Average or Maximum, to hide or show the corresponding data in the chart.
-
Click the
 button in the chart to zoom in. In the zoomed-in view, you can select a time range to view monitoring data for a specific period.
 -
If a monitoring chart displays no data, it is because you have not created an event-triggered task for the corresponding metric. Create an event-triggered task by following the on-screen instructions. For more information, see Configure an event-triggered task.
-
If you select a different Monitoring Metrics when you create a system monitoring event-triggered task, you can view monitoring charts for different metrics. For example, if you set Monitoring Metrics to (ECS) System Disk Read BPS or (ECS) System Disk Write BPS, you can view the monitoring chart for System Disk Read/Write BPS (byte/s) on the System Disk Metrics page.
NoteFor more information about the relationship between metrics and their corresponding monitoring charts, see System monitoring event-triggered tasks. The information displayed in the console takes precedence.
-