Envoy sidecar proxies on the Service Mesh (ASM) data plane generate access logs for every inbound and outbound request. By integrating Container Service for Kubernetes (ACK) with Simple Log Service (SLS), you can collect these logs centrally, run queries, and monitor traffic through built-in dashboards -- replacing manual kubectl logs calls on individual pods.
How it works
The Logtail agent (
logtail-dsadd-on) runs in the ACK cluster and streams sidecar proxy logs to SLS.SLS stores logs in a Logstore under a project -- either one you select or one created automatically as
k8s-log-{ClusterID}.Built-in dashboards in the ASM console surface both raw log entries and aggregated traffic metrics.
Prerequisites
Before you begin, make sure that you have:
An ASM instance (version 1.17.2.35 or later recommended). For more information, see Create an ASM instance
An ACK cluster added to the ASM instance. For more information, see Add a cluster to an ASM instance
The
logtail-dsadd-on (version 0.16.24.0 or later) installed in the ACK cluster
If you have not created an ACK cluster yet, enable SLS during cluster creation. See the Install Logtail when creating a cluster tab in Step 1.
Step 1: Install Logtail
Install Logtail on an existing cluster
Log on to the ACK console. In the left-side navigation pane, click Clusters.
On the Clusters page, find the cluster and click its name. In the left-side navigation pane, choose Operations > Add-ons.
On the Add-ons page, search for logtail-ds and click Install on the logtail-ds card.
In the Install logtail-ds dialog box, click OK.
logtail-ds must be version 0.16.24.0 or later. To upgrade, see Manage components.
Install Logtail when creating a cluster
If you do not have an ACK cluster, install Logtail as part of cluster creation.
Log on to the ACK console. In the left-side navigation pane, click Clusters.
On the Clusters page, click Create Kubernetes Cluster.
In the Component Configurations step, locate the Log Service section and select Enable Log Service.
Select Project -- Use an existing SLS project to store logs.
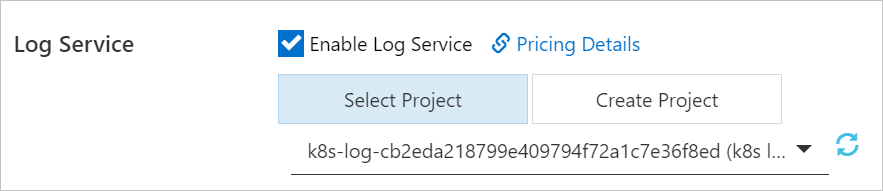
Create Project -- The system creates a project named
k8s-log-{ClusterID}, where{ClusterID}is the unique ID of the new cluster.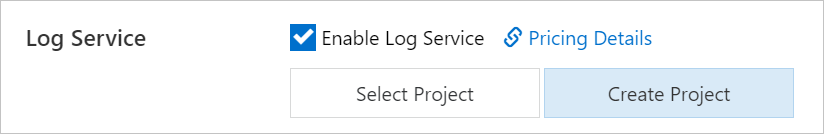
Complete the remaining settings and click Create Cluster.
After the cluster is ready, add it to your ASM instance. For more information, see Add a cluster to an ASM instance.
Step 2: Enable log collection
ASM version 1.17.2.35 or later (recommended)
Log on to the ASM console. In the left-side navigation pane, choose Service Mesh > Mesh Management.
On the Mesh Management page, click the name of the target instance. In the left-side navigation pane, choose Observability Management Center > Log Center.
On the Log Center page, choose Data-Plane Logs > Sidecar Proxy Logs or Data-Plane Log Dashboard > Sidecar Proxy Dashboards, set the log storage duration, and click Enable Sidecar Log Collection.
In the Submit dialog box, click OK.
ASM versions earlier than 1.17.2.35
Log on to the ASM console. In the left-side navigation pane, choose Service Mesh > Mesh Management.
On the Mesh Management page, click the name of the ASM instance. In the left-side navigation pane, choose ASM Instance > Base Information.
On the Base Information page, click Settings. Select Collect access logs to Alibaba Cloud Log Service and click OK.
Step 3: View and analyze logs
After you enable log collection, Logtail collects Envoy access logs and stores the logs in the specified Logstore. To view the collected logs, perform the following steps:
Log on to the ASM console. In the left-side navigation pane, choose Service Mesh > Mesh Management.
On the Mesh Management page, click the name of the ASM instance. In the left-side navigation pane, choose Observability Management Center > Log Center.
On the Log Center page, choose Data-Plane Logs > Sidecar Proxy Logs to view log entries. Choose Data-Plane Log Dashboard > Sidecar Proxy Dashboards to view the built-in dashboards.
The Log Center provides two built-in dashboards for data-plane access logs:
| Dashboard | Path | Use case |
|---|---|---|
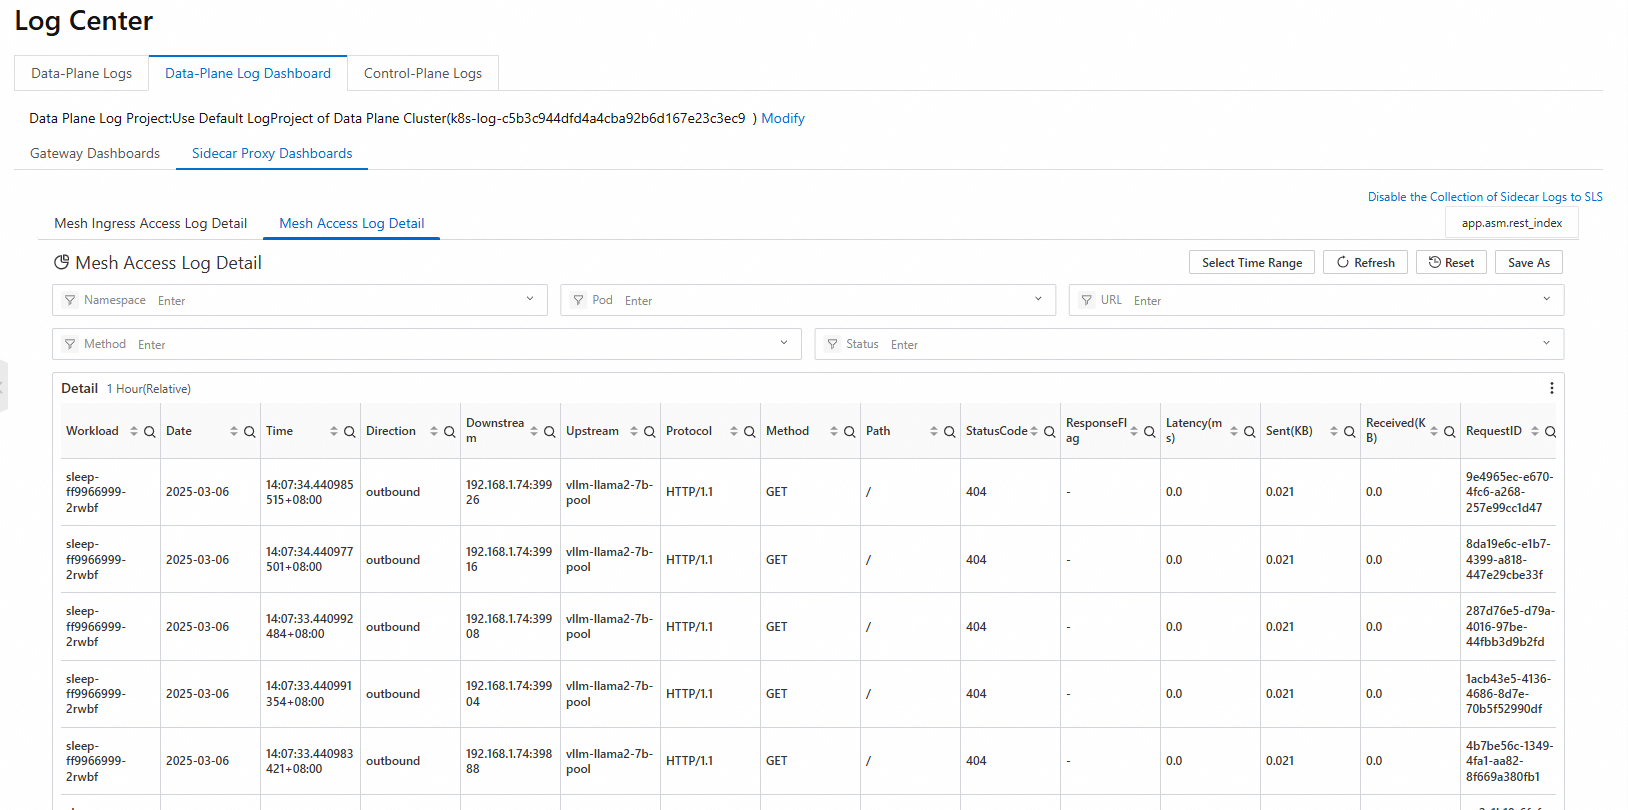
| Mesh Access Log Detail | Sidecar Proxy Dashboards > Mesh Access Log Detail | Search individual log entries by status code, upstream host, or request ID |
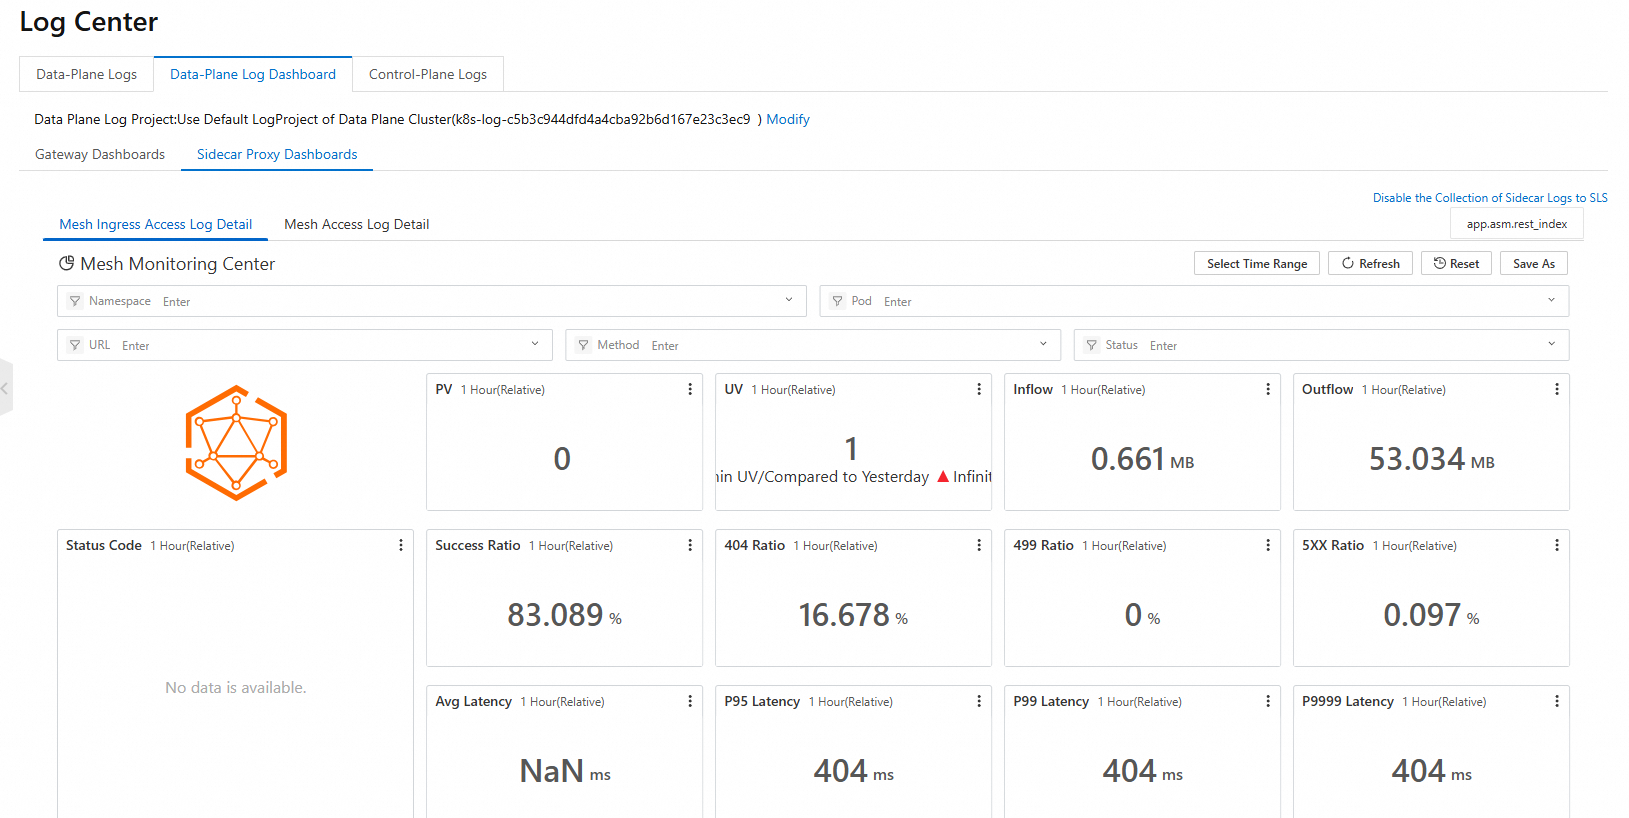
| Mesh Ingress Log Detail | Sidecar Proxy Dashboards > Mesh Ingress Log Detail | View aggregated metrics: response time distribution, status code breakdown, and traffic volume |
Mesh Access Log Detail
Displays individual access log entries in a structured, sortable table.
Mesh Ingress Log Detail
Shows aggregated traffic metrics across multiple dimensions such as response time, status code distribution, and traffic volume.
Related topics
Access logging -- Envoy access log format and field reference
Create an ASM instance -- Set up a new service mesh
Add a cluster to an ASM instance -- Connect a Kubernetes cluster to your mesh