When mutual TLS (mTLS) is enabled in a Service Mesh (ASM) instance, sidecar proxies intercept all inbound traffic to applications, including Prometheus scrape requests. To reach each application's metrics endpoint, Prometheus must present a valid certificate issued by the ASM root certificate authority (CA).
This guide walks you through configuring a self-managed Prometheus instance (Prometheus Operator) to scrape application metrics over mTLS in an ASM instance.
To collect metrics with Application Real-Time Monitoring Service (ARMS) instead, upgrade the ARMS agent to version 1.1.20 or later. In the ARMS console, click Integration Management in the left-side navigation pane, find your cluster, and click Configure Agent in the Actions column to check the agent version.
How it works
Prometheus needs certificates issued by the ASM control plane to scrape metrics over mTLS. The sidecar proxy's certificate-mounting feature handles this without manual certificate management:
An
emptyDirvolume (istio-certs) backed by memory is added to the Prometheus pod.Pod annotations instruct the sidecar proxy to write its certificates and key to this shared volume.
The Prometheus container mounts the same volume and reads the certificates from it.
A ServiceMonitor custom resource (CR) configures Prometheus to use these certificates when scraping over HTTPS.
The result: Prometheus attaches the sidecar-provided certificate and key to every scrape request, passing mTLS authentication transparently.
Prerequisites
Before you begin, make sure that you have:
A Kubernetes cluster associated with an ASM instance
The Bookinfo sample application deployed -- see Deploy an application in an ASM instance
kubectlconfigured with the kubeconfig file of the target cluster
Step 1: Install Prometheus Operator
Clone the Prometheus Operator repository:
git clone https://github.com/prometheus-operator/prometheus-operator.gitInstall Prometheus Operator:
   cd prometheus-operator/
   kubectl create -f bundle.yaml
Verify the installation:
kubectl get podsExpected output:
   NAME                                     READY   STATUS    RESTARTS
   prometheus-operator-58dd988c9c-qhrrp     2/2     Running   0
Step 2: Deploy a Prometheus instance with mTLS certificate mounts
This step creates the ServiceAccount, ClusterRole, and Prometheus CR required to run a Prometheus instance with access to ASM-issued certificates.
The CRs in this guide are for demonstration purposes. Adapt them to your production requirements.
Save the following YAML as
prometheus.yaml:apiVersion: v1 kind: ServiceAccount metadata: name: prometheus-full-access namespace: default --- apiVersion: rbac.authorization.k8s.io/v1 kind: ClusterRole metadata: name: prometheus-full-access rules: - apiGroups: [""] resources: - nodes - nodes/metrics - services - endpoints - pods verbs: ["get", "list", "watch"] - apiGroups: - extensions - apps resources: - deployments - replicasets verbs: ["get", "list", "watch"] - apiGroups: [""] resources: - configmaps verbs: ["get"] - nonResourceURLs: ["/metrics"] verbs: ["get"] --- apiVersion: monitoring.coreos.com/v1 kind: Prometheus metadata: name: default labels: prometheus: default spec: logLevel: debug podMetadata: annotations: traffic.sidecar.istio.io/includeInboundPorts: "" # do not intercept any inbound ports traffic.sidecar.istio.io/includeOutboundIPRanges: "" # do not intercept any outbound traffic proxy.istio.io/config: | # write certificates to the shared volume proxyMetadata: OUTPUT_CERTS: /etc/istio-output-certs sidecar.istio.io/userVolumeMount: '[{"name": "istio-certs", "mountPath": "/etc/istio-output-certs"}]' # mount the shared volume in the sidecar proxy volumes: - emptyDir: medium: Memory name: istio-certs volumeMounts: - mountPath: /etc/prom-certs/ # Prometheus reads certificates from this path name: istio-certs replicas: 2 version: v2.26.0 serviceAccountName: prometheus-full-access serviceMonitorSelector: matchLabels: team: bookinfo ruleSelector: matchLabels: role: alert-rules prometheus: exampleKey annotations explained:
Annotation Purpose traffic.sidecar.istio.io/includeInboundPorts: ""Prevents the sidecar from intercepting inbound traffic to Prometheus. Prometheus's direct-endpoint scraping model is incompatible with sidecar proxying. traffic.sidecar.istio.io/includeOutboundIPRanges: ""Prevents the sidecar from intercepting outbound scrape requests proxy.istio.io/configwithOUTPUT_CERTSTells the sidecar proxy to write certificates and keys to /etc/istio-output-certssidecar.istio.io/userVolumeMountMounts the istio-certsvolume at/etc/istio-output-certsinside the sidecar containerThe
volumeMountssection mounts the sameistio-certsvolume at/etc/prom-certs/inside the Prometheus container. Since both containers share the volume, Prometheus can read the certificates that the sidecar writes.Apply the configuration:
kubectl apply -f prometheus.yamlVerify that the Prometheus pods are running:
kubectl get podsExpected output:
   NAME                                   READY   STATUS    RESTARTS
   prometheus-default-0                   3/3     Running   0
   prometheus-default-1                   3/3     Running   0
   prometheus-operator-58dd988c9c-qhrrp   2/2     Running   0
Step 3: Create a ServiceMonitor to scrape metrics over mTLS
The ServiceMonitor CR tells Prometheus which workloads to scrape and how to authenticate over mTLS. Only workloads with injected sidecar proxies require mTLS scraping. The team: bookinfo label on the ServiceMonitor must match the serviceMonitorSelector in the Prometheus CR from Step 2.
The CRs in this guide are for demonstration purposes. Adapt them to your production requirements.
Save the following YAML as
service-monitor.yaml:apiVersion: monitoring.coreos.com/v1 kind: ServiceMonitor metadata: name: productpage labels: app: productpage team: bookinfo spec: selector: matchLabels: app: productpage endpoints: - port: http-9080 interval: 30s path: /metrics scheme: https # scrape over HTTPS tlsConfig: caFile: /etc/prom-certs/root-cert.pem # ASM root CA certificate certFile: /etc/prom-certs/cert-chain.pem # client certificate chain keyFile: /etc/prom-certs/key.pem # client private key insecureSkipVerify: true # skip server identity verification (see note below)Configuration details:
scheme: https-- Prometheus sends scrape requests over HTTPS, which is required for mTLS.tlsConfig-- Points to the certificate, CA certificate, and key files that the sidecar proxy wrote to the shared volume.insecureSkipVerify: true-- Prometheus does not support Istio's identity naming scheme (SPIFFE), so server certificate verification must be skipped. The mTLS handshake still provides mutual authentication through client certificate validation.
Apply the ServiceMonitor:
kubectl apply -f service-monitor.yaml
Step 4: Verify metrics collection
Set up port forwarding to the Prometheus service:
kubectl port-forward svc/prometheus-operated 9090Open
http://localhost:9090in a browser.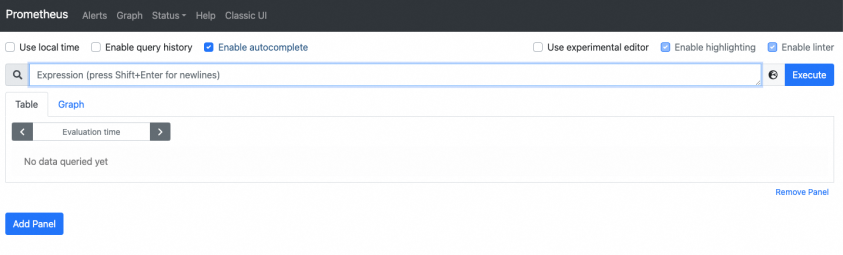
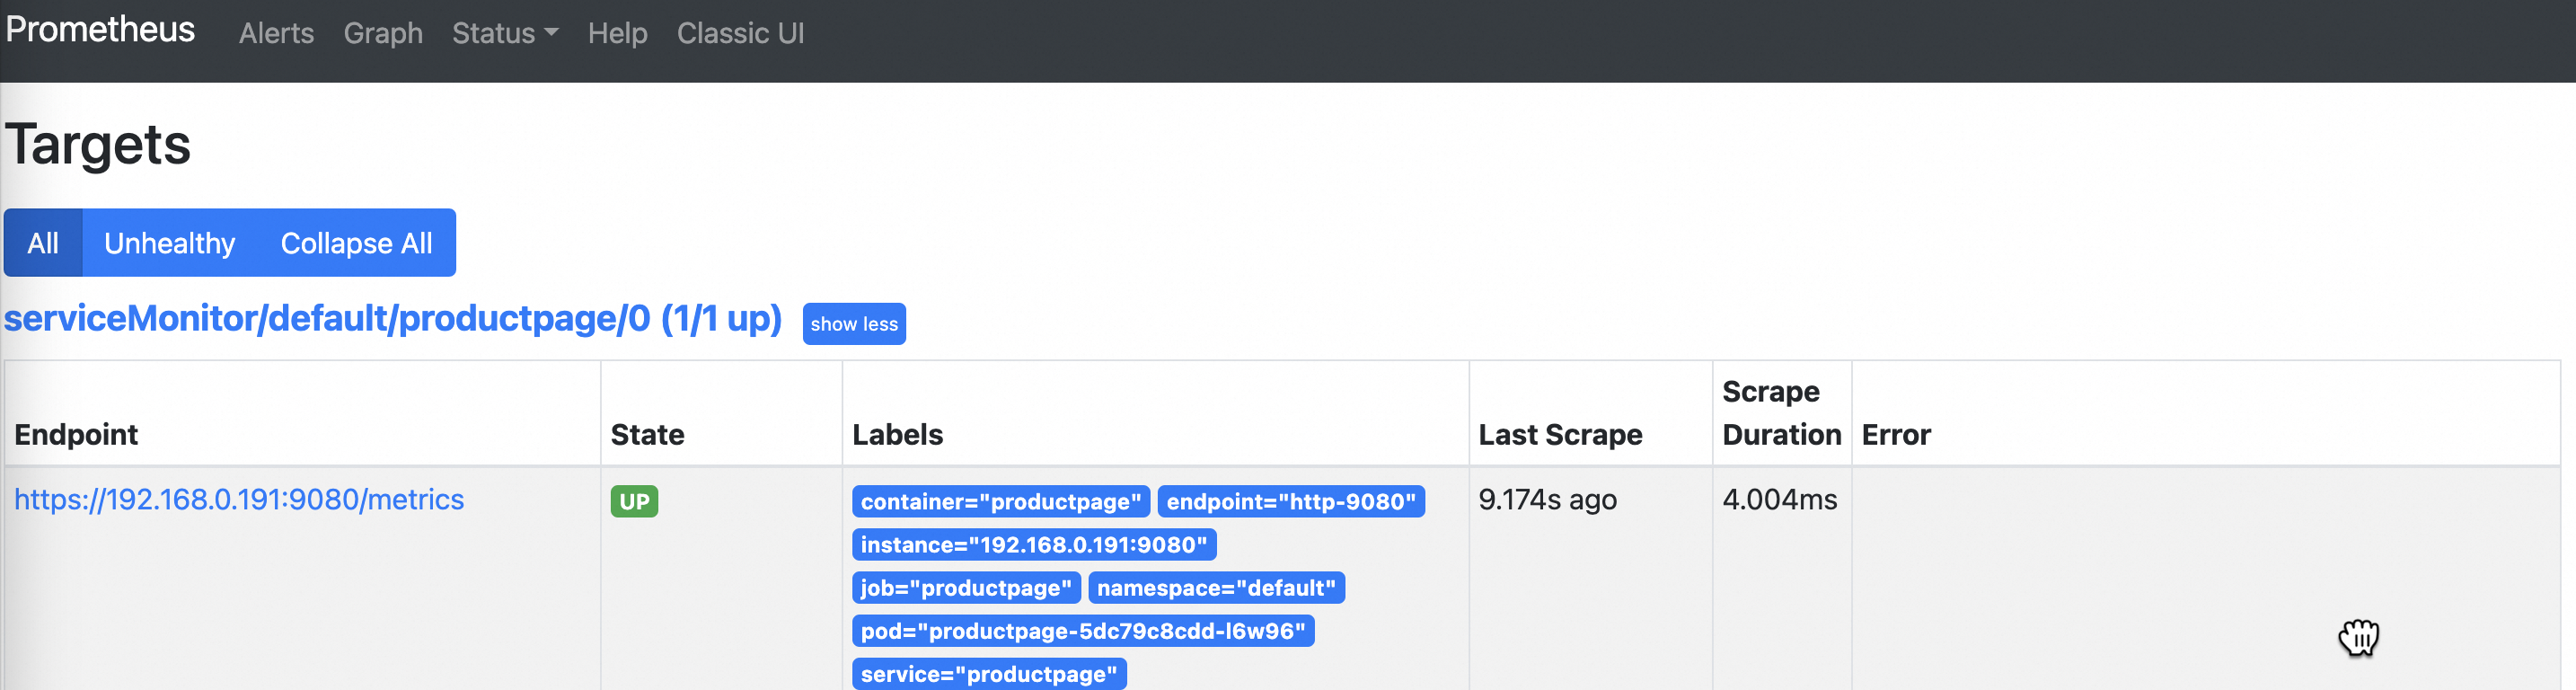
Click Status > Target in the top navigation bar. Confirm that the State of the monitored target is Up, which indicates that Prometheus is successfully scraping metrics over mTLS.
NoteIf the state shows Unavailable, mTLS authentication may not be configured correctly. Verify that the certificate paths in the ServiceMonitor match the volume mount paths and that the sidecar proxy is injected into the Prometheus pod.
Click Graph in the top navigation bar. Enter
python_gc_objects_collected_totalin the query box and click Execute. The query results display the collected metrics: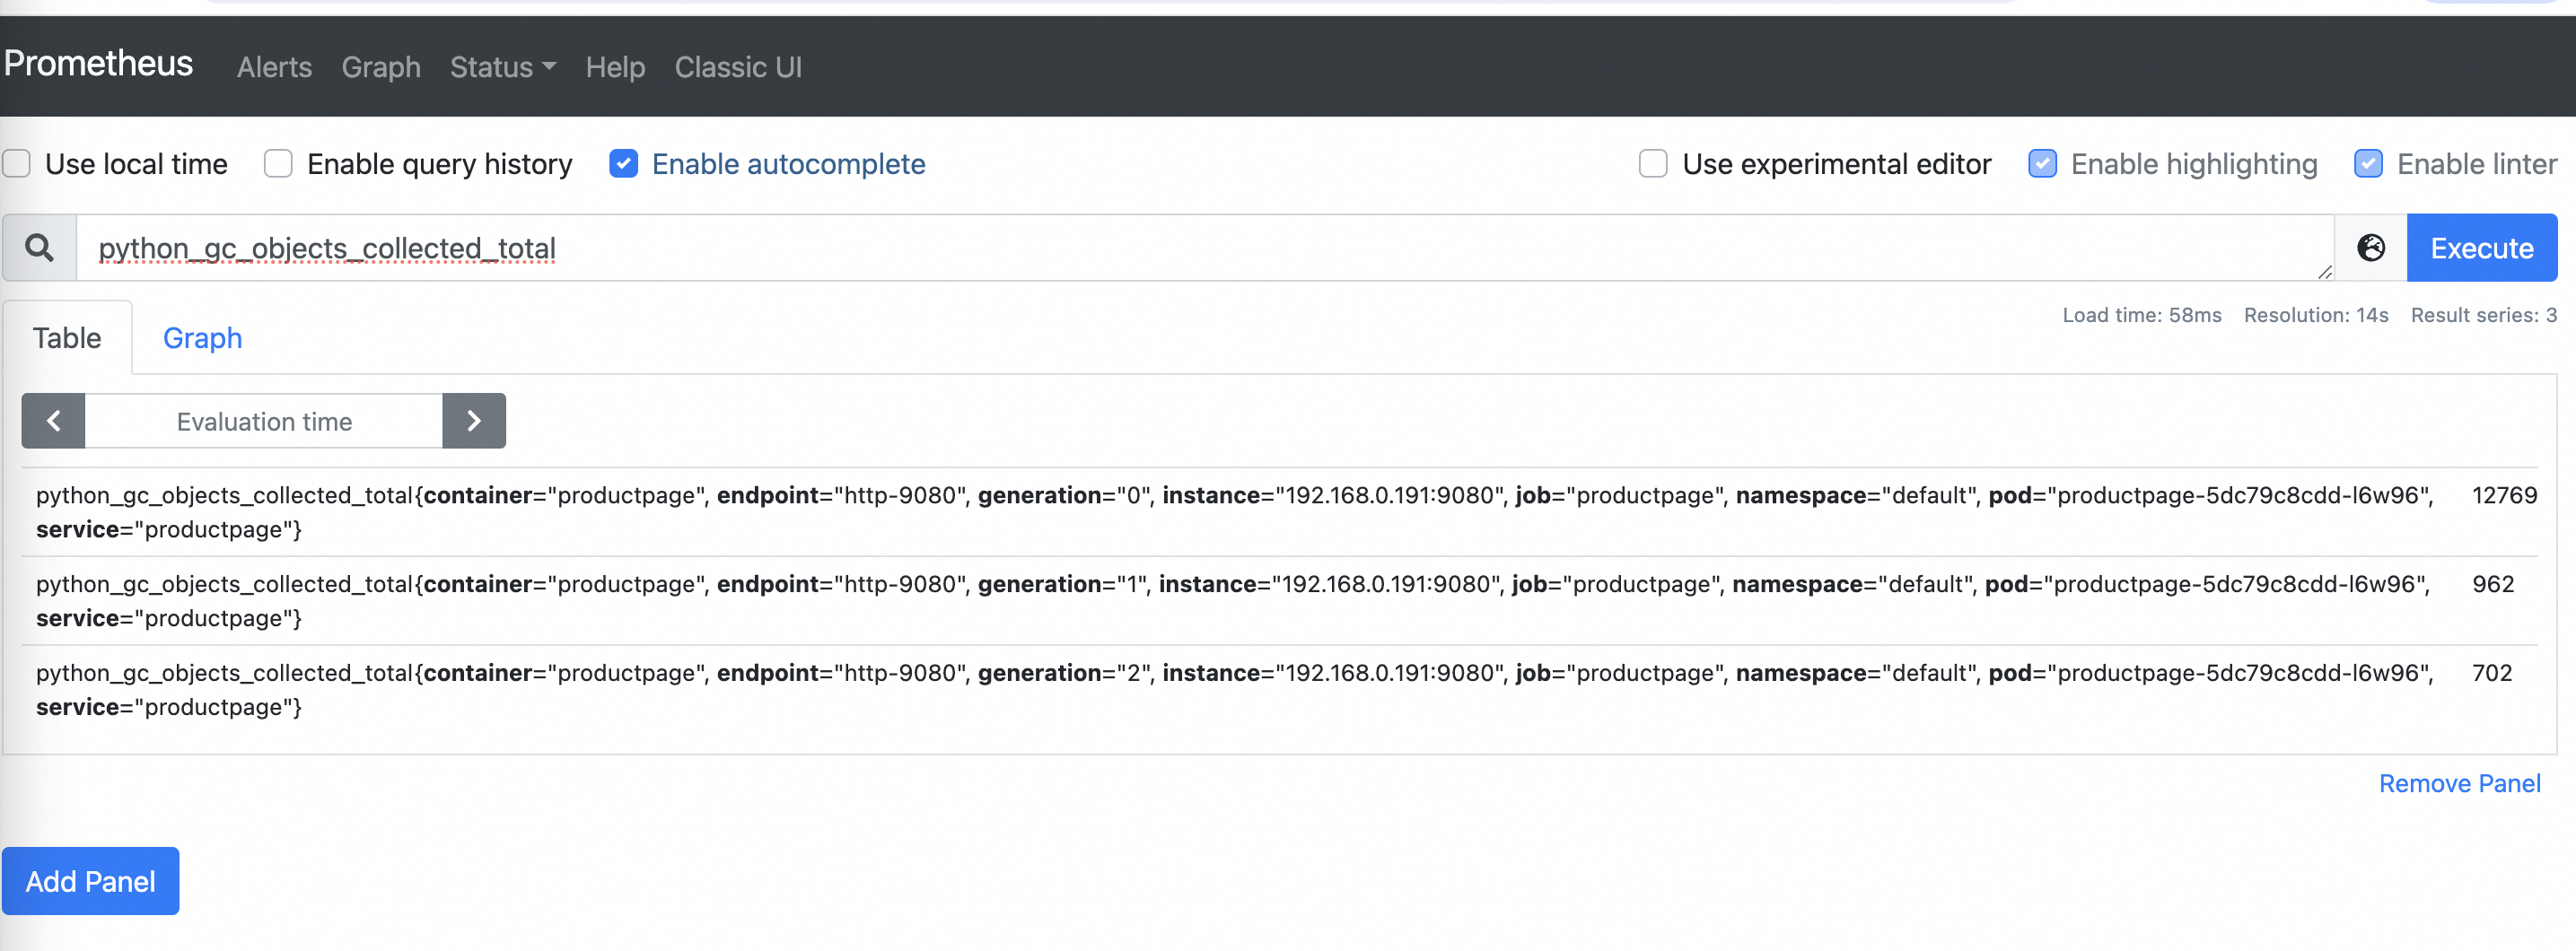
Configuration summary
The following table summarizes the key configuration points across all components:
| Component | Configuration | Purpose |
|---|---|---|
| Pod volume | emptyDir named istio-certs | Shared storage for certificates |
| Sidecar annotations | OUTPUT_CERTS + userVolumeMount | Sidecar writes certificates to the shared volume |
| Prometheus volume mount | /etc/prom-certs/ | Prometheus reads certificates from the shared volume |
| ServiceMonitor | scheme: https + tlsConfig | Prometheus uses the certificates for mTLS scrape requests |