Service Mesh (ASM) supports progressive service release through LoadRampingPolicy. When you release a new service, you can configure a progressive release policy to gradually increase traffic, preventing overload and ensuring a smooth launch.
Background information
LoadRampingPolicy progressively increases the requests received by a service during release. It uses the following components:
-
Request sampler: Rejects a percentage of incoming requests. In the early stage of release, the sampler rejects most requests sent to the service.
-
Load meter: Measures the service load. When the load stays within a specified threshold range, the sampler gradually reduces the rejection percentage through defined steps until nearly all requests are accepted.
When you release a new service in a cluster, LoadRampingPolicy prevents errors caused by traffic bursts by progressively increasing incoming traffic. It monitors service load in real time and adjusts the traffic percentage accordingly.
Prerequisites
-
A Container Service for Kubernetes (ACK) managed cluster is added to your ASM instance, and the version of your ASM instance is V1.21.X.XX or later. For more information, see Add a cluster to an ASM instance.
-
Automatic sidecar proxy injection is enabled for the default namespace in the ACK cluster. For more information, see Manage global namespaces.
-
You have connected to the ACK cluster by using kubectl. For more information, see Connect to an ACK cluster using kubectl.
-
The ASM traffic scheduling suite is enabled. For more information, see Enable the ASM traffic scheduling suite.
-
The HTTPBin application is deployed and can be accessed over a gateway. For more information, see Deploy the HTTPBin application.
Step 1: Create LoadRampingPolicy
-
Use kubectl to connect to the ASM instance. For more information, see Access Istio resources with kubectl.
-
Create a LoadRampingPolicy.yaml file that contains the following content:
apiVersion: istio.alibabacloud.com/v1
kind: LoadRampingPolicy
metadata:
  name: load-ramping
  namespace: istio-system
spec:
  drivers:
    average_latency_drivers:
      - selectors:
          - service: httpbin.default.svc.cluster.local
        criteria:
          forward:
            threshold: 100
          reset:
            threshold: 200
  start: true
  load_ramp:
    sampler:
      selectors:
        - service: httpbin.default.svc.cluster.local
    steps:
      - duration: 0s
        target_accept_percentage: 1
      - duration: 300s
        target_accept_percentage: 100.0
The following table describes some of the fields. For more information about the related fields, see Description of LoadRampingPolicy fields.
Field
Description
steps
The definition of the release phases. In this example, two phases are defined, requiring the request acceptance percentage to reach nearly 100% within 300 seconds.
selectors
The services to which the progressive release policy applies. In this example, progressive release is performed on httpbin.default.svc.cluster.local.
criteria
The service load measurement criteria. In this example: (1) When the average latency is less than 100 ms, the release proceeds. (2) When the average latency exceeds 200 ms, the release resets and the sampler reverts to the maximum rejection percentage.
-
Run the following command to configure the progressive service release policy:
kubectl apply -f LoadRampingPolicy.yaml
Step 2: Verify whether LoadRampingPolicy takes effect
In this example, the stress testing tool Fortio is used. For more information, see the Installation section of Fortio on GitHub.
-
Run the following command to perform stress testing on the HTTPBin application:
fortio load -c 10 -qps 0 -t 300s -allow-initial-errors -a http://${IP address of the ASM ingress gateway}/status/200NoteReplace
${IP address of the ASM ingress gateway}in the preceding commands with the IP address of your ASM ingress gateway. For more information about how to obtain the IP address of the ASM ingress gateway, see substep 1 of Step 3 in the Version-based traffic routing with Istio topic.Expected output:
...
# target 50% 0.0613214
# target 75% 0.0685102
# target 90% 0.0756739
# target 99% 0.0870132
# target 99.9% 0.115361
Sockets used: 31529 (for perfect keepalive, would be 10)
Uniform: false, Jitter: false
Code 200 : 26718 (45.9 %)
Code 403 : 31510 (54.1 %)
Response Header Sizes : count 58228 avg 111.04245 +/- 120.6 min 0 max 243 sum 6465780
Response Body/Total Sizes : count 58228 avg 185.18012 +/- 52.32 min 137 max 243 sum 10782668
All done 58228 calls (plus 10 warmup) 51.524 ms avg, 194.1 qps
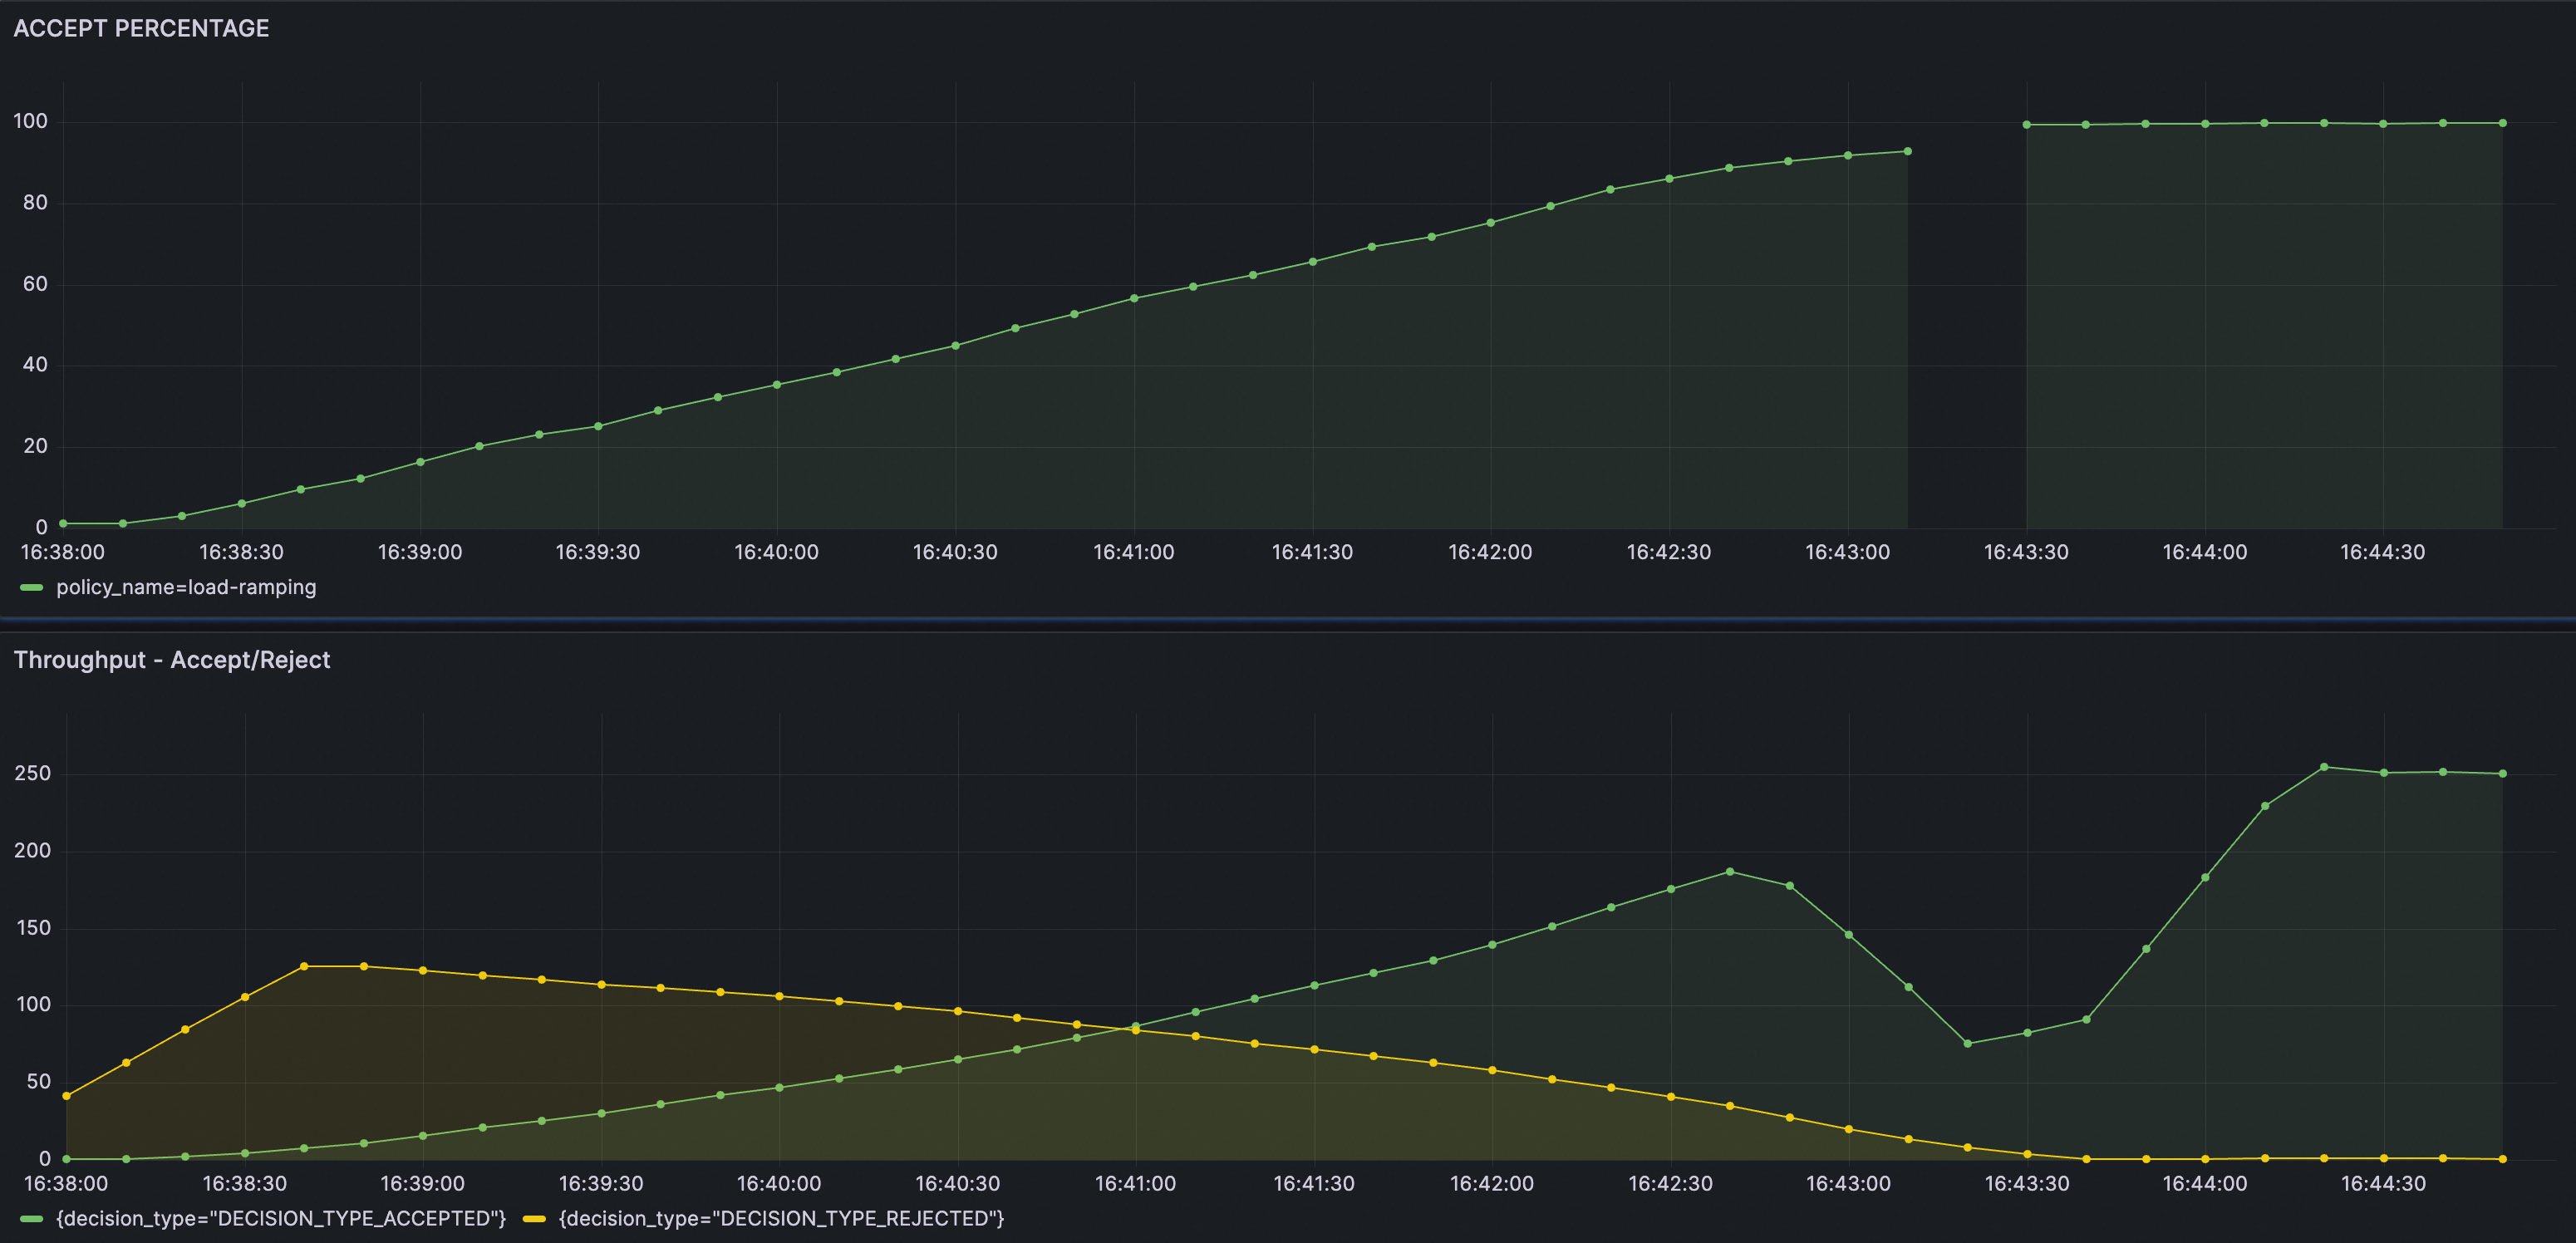
The output shows that the average request latency is 51 ms, within the configured threshold. About half of the requests receive a 403 status code, meaning access is denied. Over the 300-second test, the service acceptance percentage gradually increases from 1% to 100%.
-
Run the following command to perform stress testing on the HTTPBin application again:
fortio load -c 10 -qps 0 -t 300s -allow-initial-errors -a http://${IP address of the ASM ingress gateway}/status/200Expected output:
...
# target 50% 0.0337055
# target 75% 0.0368905
# target 90% 0.0396488
# target 99% 0.0791
# target 99.9% 0.123187
Sockets used: 455 (for perfect keepalive, would be 10)
Uniform: false, Jitter: false
Code 200 : 82959 (99.5 %)
Code 403 : 445 (0.5 %)
Response Header Sizes : count 83404 avg 240.71018 +/- 17.63 min 0 max 243 sum 20076192
Response Body/Total Sizes : count 83404 avg 241.44115 +/- 7.649 min 137 max 243 sum 20137158
All done 83404 calls (plus 10 warmup) 35.970 ms avg, 278.0 qps
The output shows that only 0.5% of requests are rejected and 99.5% are accepted. The progressive service release is complete.
-
Delete LoadRampingPolicy.
-
Use kubectl to connect to the ASM instance. For more information, see Access Istio resources with kubectl.
-
Run the following command to delete LoadRampingPolicy after the service is released:
kubectl delete loadrampingpolicy load-ramping -n istio-systemImportantIn this example,
LoadRampingPolicyuses a 300s duration to simulate progressive release. Because you configured thecriteria.reset.thresholdsection, you must manually delete LoadRampingPolicy after verifying the result. Otherwise, latency fluctuations may re-trigger the progressive release and disrupt normal service operation. -
References
You can verify whether LoadRampingPolicy takes effect on Grafana. Ensure that the Prometheus instance for Grafana is configured with ASM traffic scheduling suite.
Import the following content into Grafana to create a dashboard for LoadRampingPolicy.
The dashboard is as follows.