Service Level Objectives (SLOs) generate metrics such as error budgets, burn rates, and alert statuses through Prometheus rules. Grafana provides dashboards to visualize these metrics, so you can monitor SLO compliance and respond to budget consumption in real time.
This topic walks you through installing Grafana in a Container Service for Kubernetes (ACK) cluster, connecting it to your Prometheus data source, and importing the ASM SLO dashboard.
Prerequisites
Before you begin, make sure that you have:
Install Grafana
Add the Grafana Helm repository and install Grafana in the monitoring namespace:
# Add the Grafana Helm repository
helm repo add grafana https://grafana.github.io/helm-charts
helm repo update

# Install Grafana
helm install -n monitoring asm-grafana grafana/grafana
Verify that the Grafana pod is running:
kubectl get pods -n monitoring -l app.kubernetes.io/name=grafanaExpected output:
NAME                           READY   STATUS    RESTARTS   AGE
asm-grafana-xxxxxxxxxx-xxxxx   1/1     Running   0          60s
The pod status must show Running with 1/1 ready before you proceed.
Access the Grafana console
Retrieve the admin password:
kubectl get secret --namespace monitoring asm-grafana -o jsonpath="{.data.admin-password}" | base64 --decode ; echoForward a local port to the Grafana service:
kubectl --namespace monitoring port-forward svc/asm-grafana 3000:80Open https://localhost:9093 in a browser. Log in with username
adminand the password from step 1.
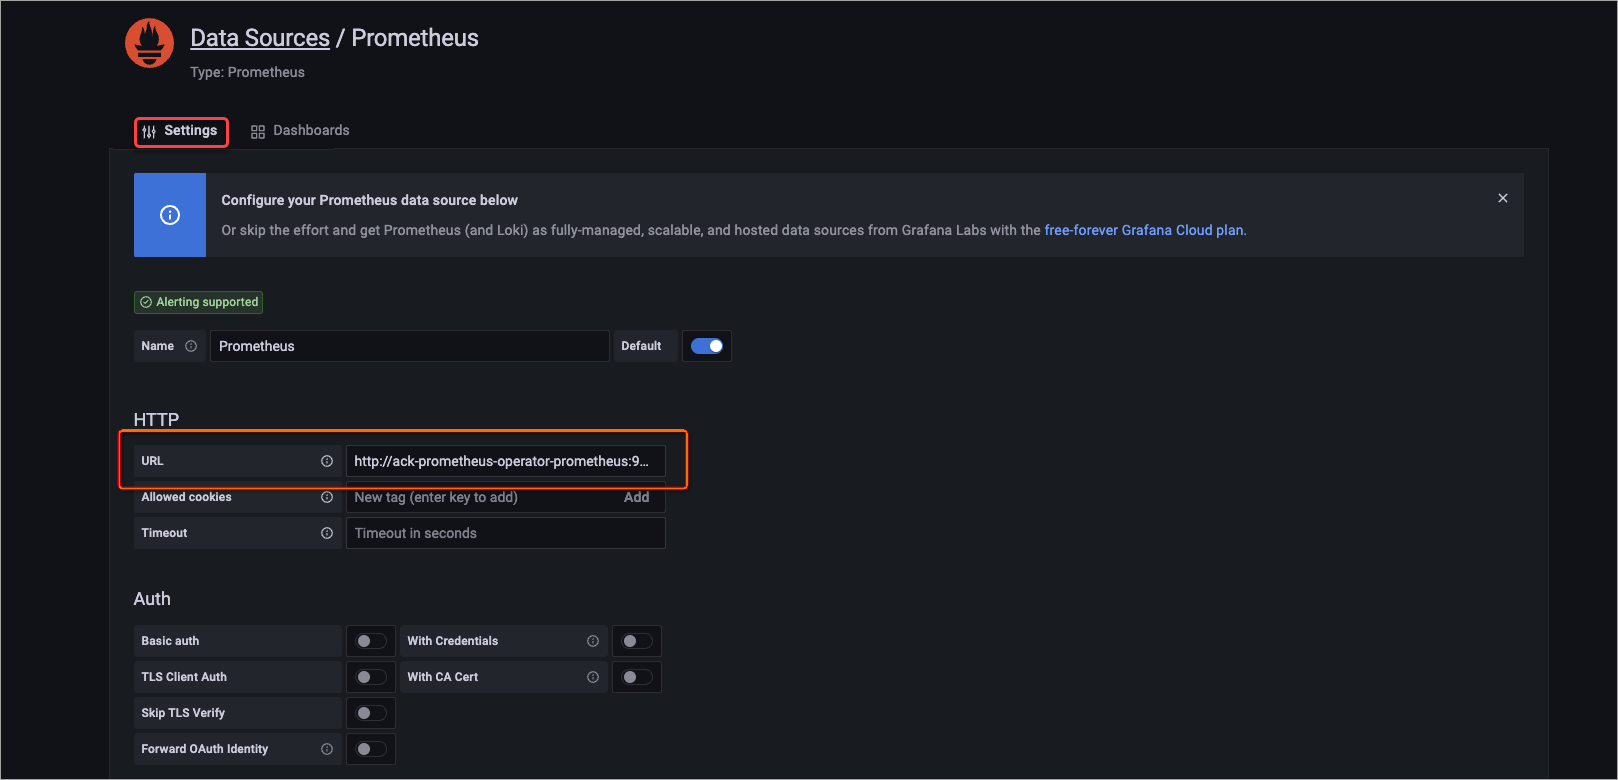
Add a Prometheus data source
In the left-side navigation pane, click the
 icon.
icon.On the Configuration page, click the Data sources tab, and then click Add data source.
Select Prometheus.
On the Settings tab, in the HTTP section, set URL to
http://ack-prometheus-operator-prometheus:9090.Keep the default values for other parameters and click Save.
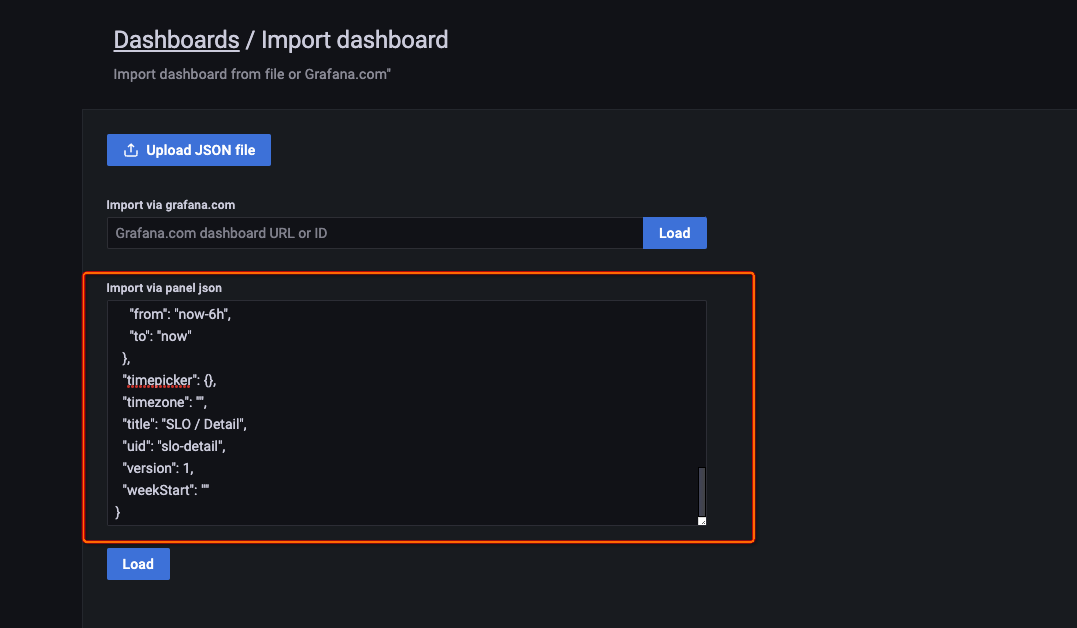
Import the SLO dashboard
In the left-side navigation pane, choose
 > Import.
Download or copy the contents of the ASM SLO dashboard template.
Paste the JSON into the Import via panel json text box and click Load.
Verify that the dashboard loads. The following figure shows the four sections of the dashboard:
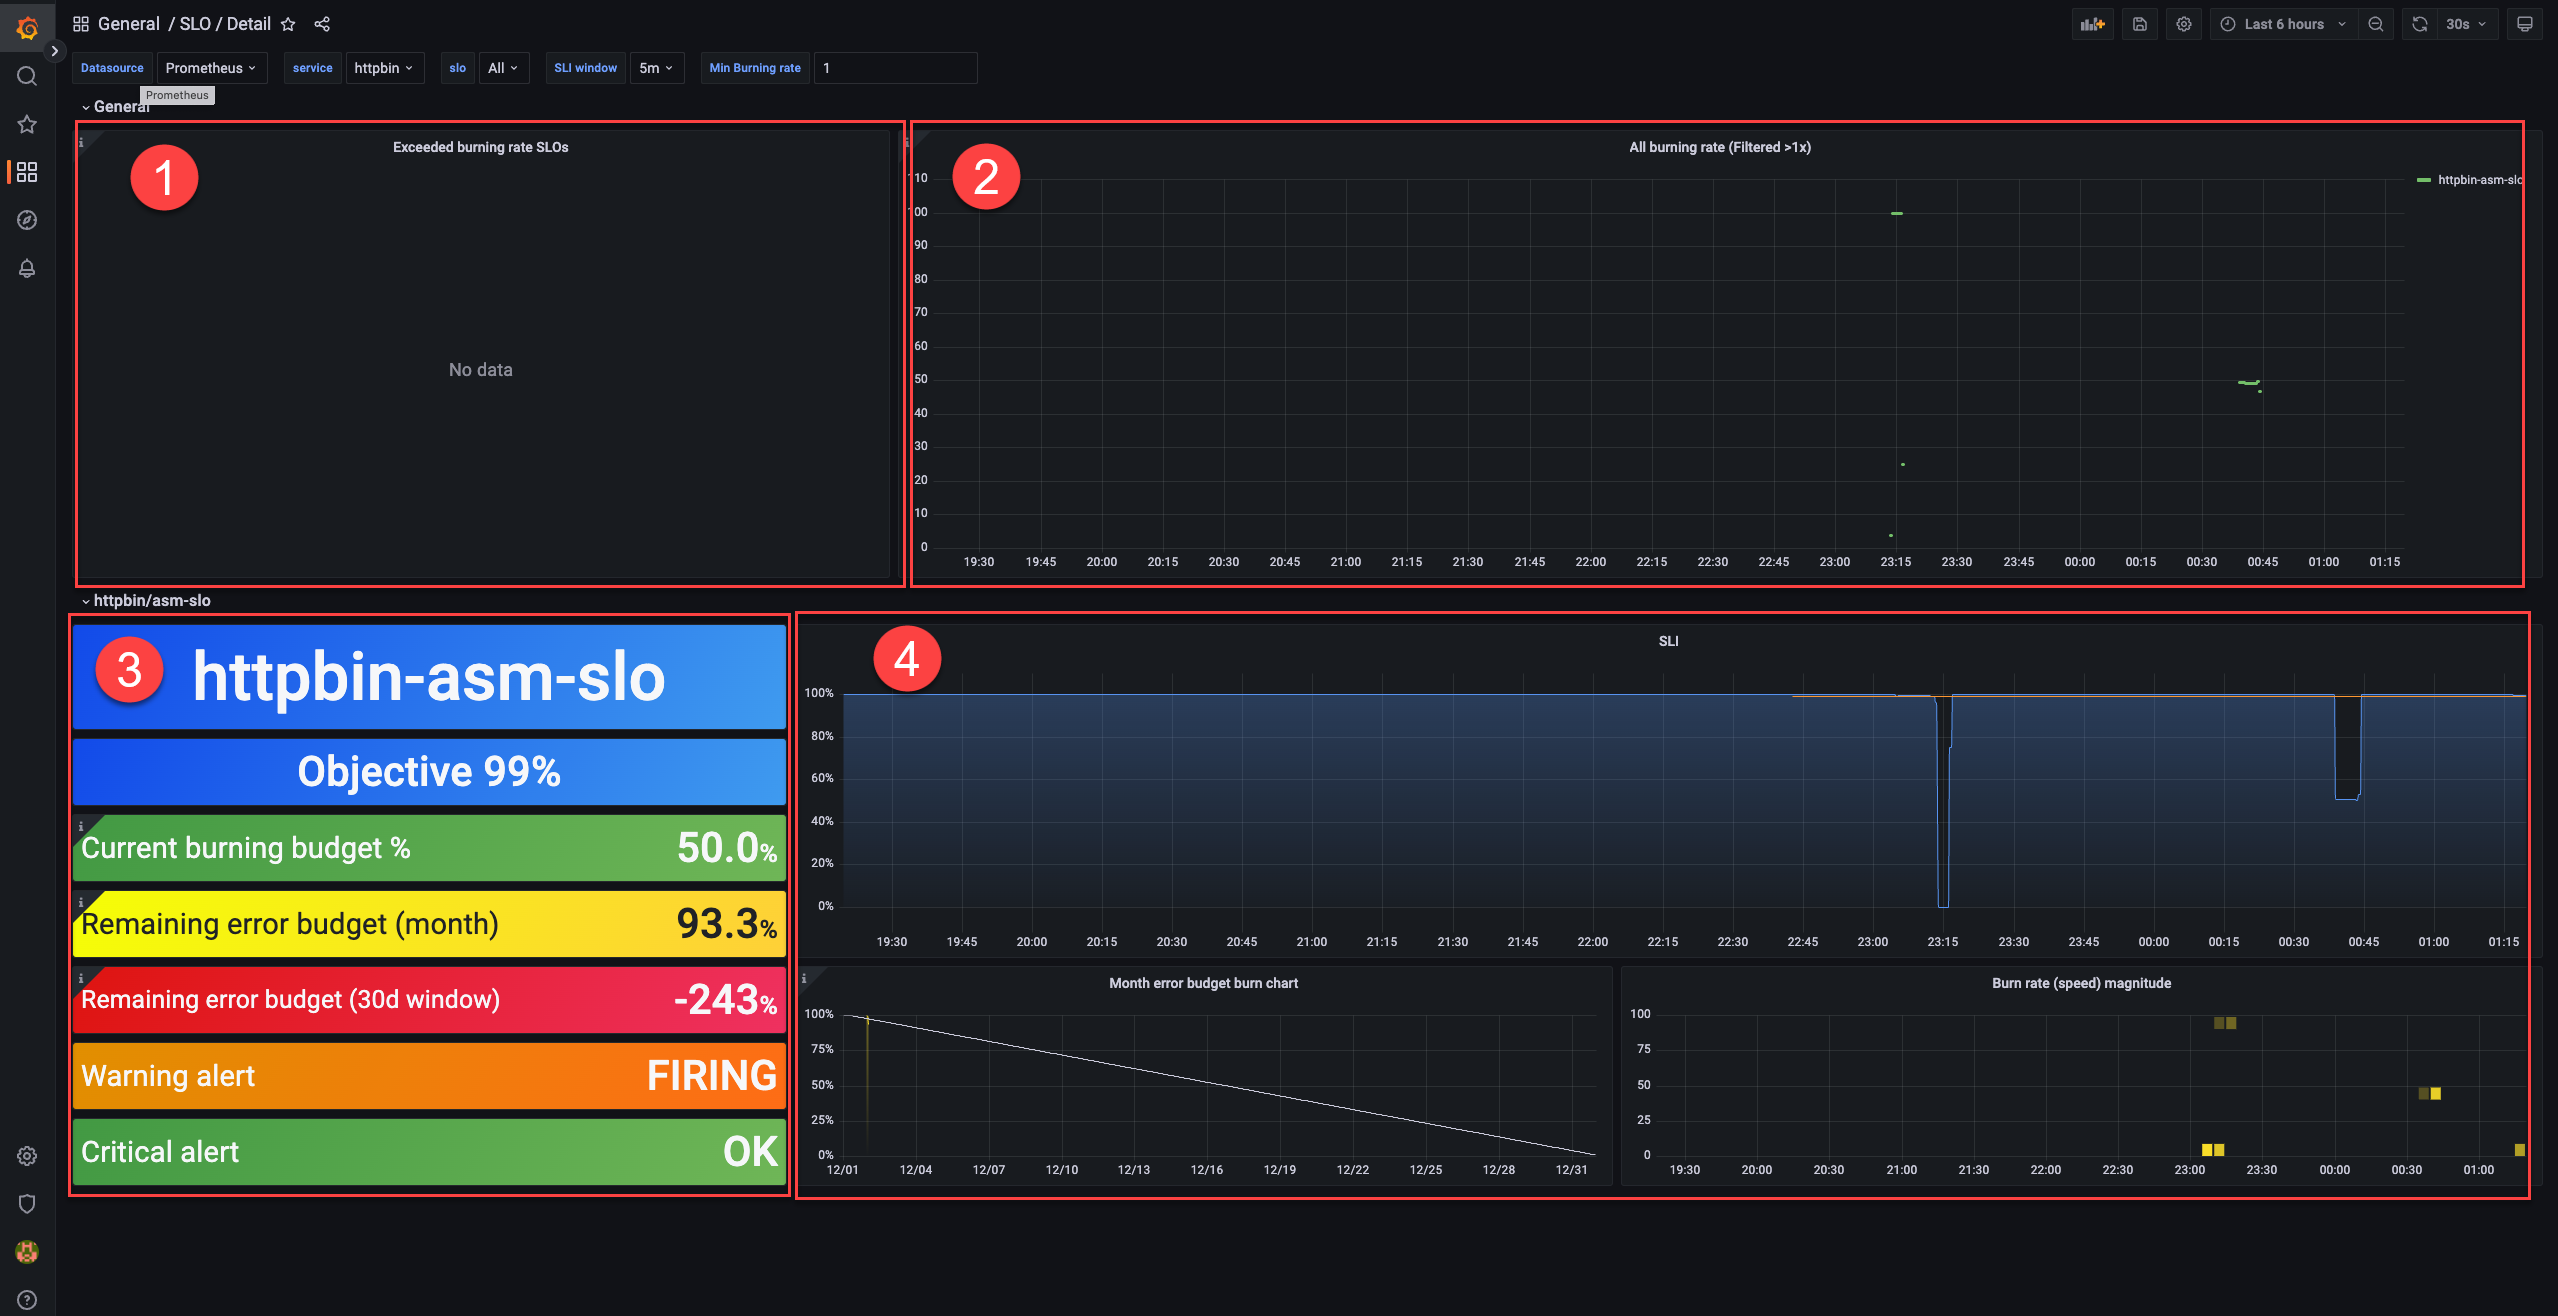
SLO dashboard reference
The dashboard displays four sections. Each section serves a different monitoring purpose.
Error budget consumption (area 1)
Lists SLOs whose error budgets are actively being consumed. Check here to identify services that are approaching or exceeding their budget limits.
Burn rate alerts (area 2)
Lists SLOs whose burn rates exceed 1. A burn rate above 1 means the error budget is being consumed faster than the compliance period allows.
SLO configuration and status (area 3)
Displays the configuration and current status of a selected SLO.
| Metric | Description |
|---|---|
| Objective | The SLO target percentage. Example: 99%. |
| Current burning budget % | The current burn rate as a percentage of the error budget. Example: 50%, which translates to an error rate of (1 - 99%) x 50% = 0.5%. |
| Remaining error budget (month) | The remaining error budget for the current calendar month. Example: 93.3%. |
| Remaining error budget (30d window) | The remaining error budget over a 30-day rolling window. Example: -243%. A negative value means the service has exceeded its error budget within that window. Whether the service meets its SLO depends on the remaining budget at the end of the compliance period. |
| Warning alert | Whether a warning-level alert is triggered. FIRING = triggered, OK = not triggered. |
| Critical alert | Whether a critical-level alert is triggered. FIRING = triggered, OK = not triggered. |
Error budget and burn rate trends (area 4)
Shows how the monthly error budget and the burn rate of a Service Level Indicator (SLI) change over time. Use the trend charts to identify patterns and correlate budget consumption with deployment events or traffic changes.
What's next
SLO overview: Learn about SLO concepts such as error budgets, burn rates, and compliance periods.