All Products
Search
Document Center

Alibaba Cloud Service Mesh:Use ConcurrencyLimitingPolicy to implement request concurrency limiting

Last Updated:Jun 22, 2026

The ConcurrencyLimitingPolicy feature of the ASM traffic scheduling suite controls the number of concurrent requests sent to a service to prevent overload. The policy tracks in-flight requests and rejects new ones when the count exceeds a specified threshold.

Prerequisites

Step 1: Create a concurrency limiting policy by using ConcurrencyLimitingPolicy fields

  1. Use kubectl to connect to the ASM instance. For more information, see Access Istio resources with kubectl.

  2. Create a ConcurrencyLimitPolicy.yaml file that contains the following content:

    apiVersion: istio.alibabacloud.com/v1
    kind: ConcurrencyLimitingPolicy
    metadata:
      name: concurrencylimit
      namespace: istio-system
    spec:
      concurrency_limiter:
        max_concurrency: 1
        parameters:
          max_inflight_duration: 60s
        selectors:
        - service: httpbin.default.svc.cluster.local

    The following table describes some of the fields. For more information, see ConcurrencyLimitingPolicy field reference.

    Field

    Description

    max_concurrency

    The maximum number of concurrent requests. In the example, this field is set to 1, which indicates that the service is allowed to process only one request at a time.

    max_inflight_duration

    The timeout period for request processing. If the ASM traffic scheduling suite fails to record a request termination event, for example, due to a pod restart, the request continues to count against the concurrency limit. This field marks requests that remain unresponsive beyond the specified duration as completed, preventing stale in-flight records from blocking new requests. Set this value based on the expected maximum response time. In this example, the field is set to 60s.

    selectors

    The services to which the concurrency limiting policy applies. In this example, the policy targets the httpbin.default.svc.cluster.local service.

  3. Run the following command to enable the concurrency limiting policy:

    kubectl apply -f ConcurrencyLimitingPolicy.yaml 

    Expected output:

    concurrencylimitingpolicy.istio.alibabacloud.com/concurrencylimit created

Step 2: Verify that the concurrency limiting policy takes effect

  1. Run the following command to open the shell command line for the sleep service:

    kubectl exec -it deploy/sleep -- sh
  2. Run the following commands to send a request from the backend that needs to take 30 seconds to complete, and then send a second request within 30 seconds.

    curl httpbin:8000/delay/30 -I &
    curl httpbin:8000 -I

    Expected output:

    HTTP/1.1 429 Too Many Requests
    date: Fri, 26 Jul 2024 13:50:55 GMT
    server: envoy
    x-envoy-upstream-service-time: 1
    transfer-encoding: chunked
    
    ~ $ HTTP/1.1 200 OK
    server: envoy
    date: Fri, 26 Jul 2024 13:51:05 GMT
    content-type: application/json
    content-length: 269
    access-control-allow-origin: *
    access-control-allow-credentials: true
    x-envoy-upstream-service-time: 10006
    
    [1]+  Done                       curl httpbin:8000/delay/30 -I

    The second request receives an HTTP 429 status code, confirming that the concurrency limiting policy is in effect.

References

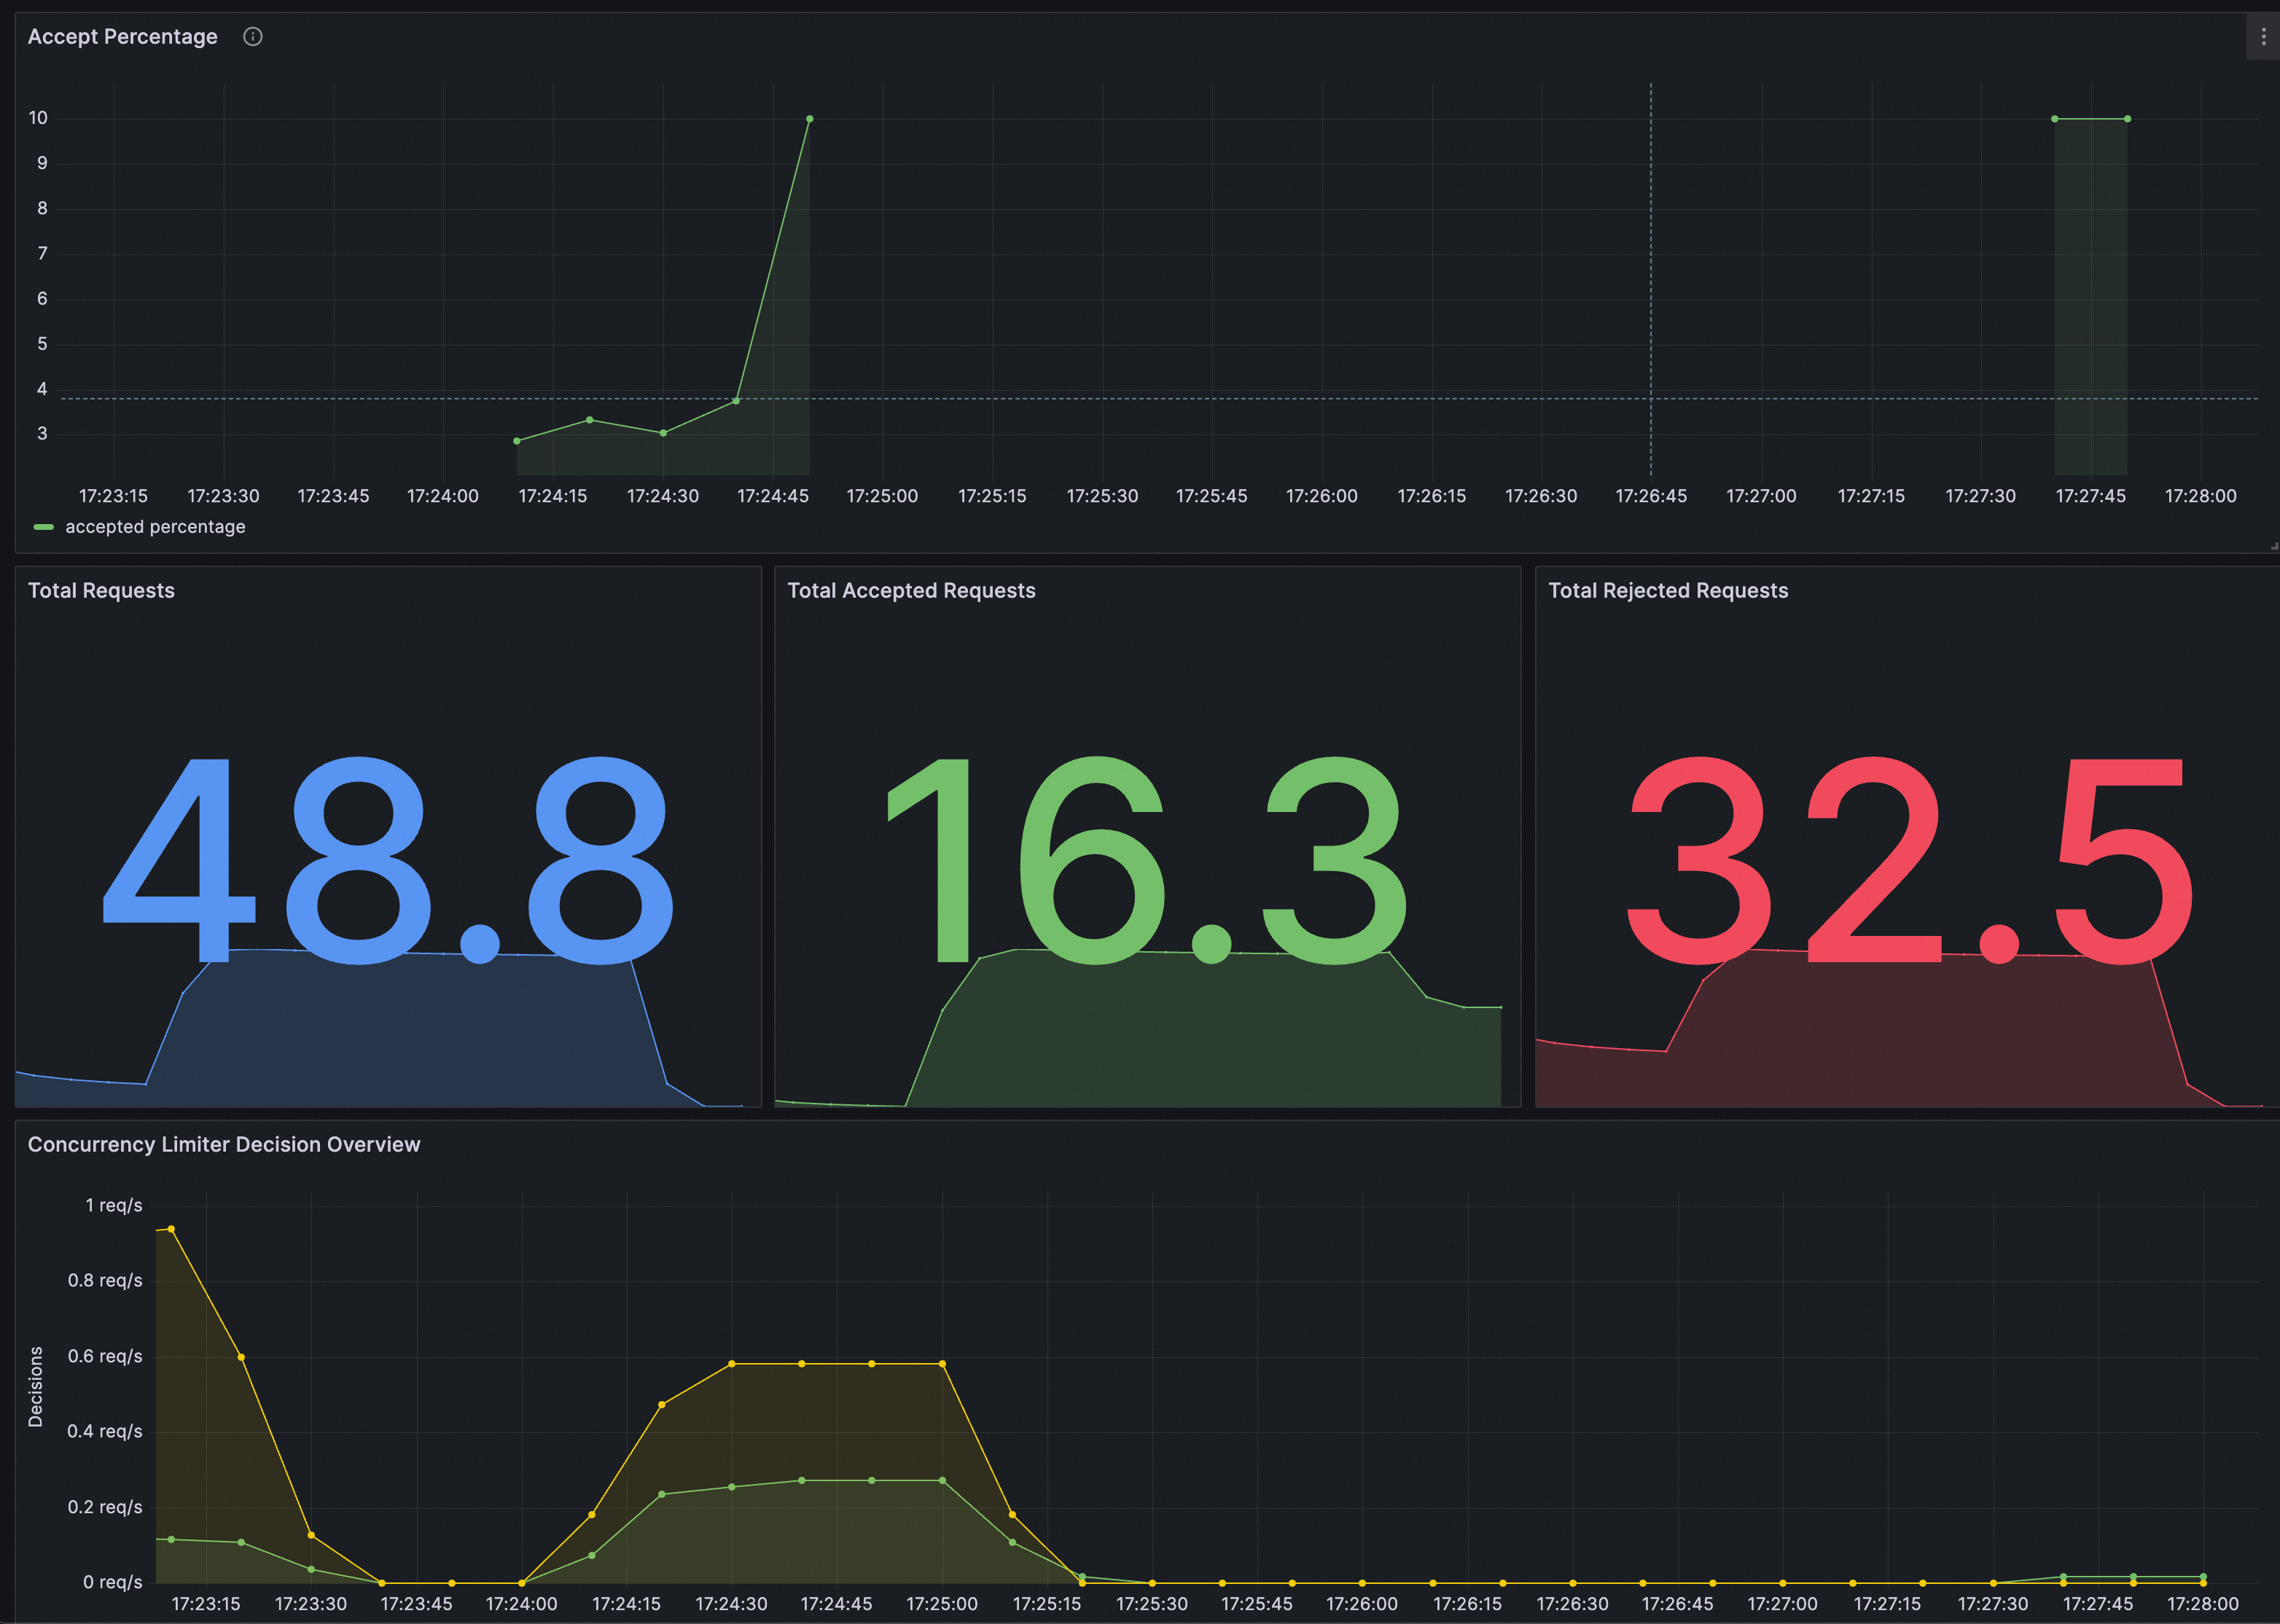
To monitor ConcurrencyLimitingPolicy on Grafana, make sure the Prometheus instance for Grafana is configured with the ASM traffic scheduling suite.

Import the following JSON into Grafana to create a ConcurrencyLimitingPolicy dashboard.

Click to view details

{
  "annotations": {
    "list": [
      {
        "builtIn": 1,
        "datasource": {
          "type": "grafana",
          "uid": "-- Grafana --"
        },
        "enable": true,
        "hide": true,
        "iconColor": "rgba(0, 211, 255, 1)",
        "name": "Annotations & Alerts",
        "type": "dashboard"
      }
    ]
  },
  "editable": true,
  "fiscalYearStartMonth": 0,
  "graphTooltip": 0,
  "id": 41,
  "links": [],
  "liveNow": false,
  "panels": [
    {
      "datasource": {
        "type": "prometheus",
        "uid": "${datasource}"
      },
      "description": "Signal derived from periodic execution of query: (sum(rate(concurrency_limiter_counter_total{policy_name=\"concurrencylimit\",component_id=\"root.0\",decision_type=\"DECISION_TYPE_ACCEPTED\"}[30s])) / sum(rate(concurrency_limiter_counter_total{policy_name=\"concurrencylimit\",component_id=\"root.0\"}[30s]))) * 100",
      "fieldConfig": {
        "defaults": {
          "color": {
            "mode": "palette-classic"
          },
          "custom": {
            "axisCenteredZero": false,
            "axisColorMode": "text",
            "axisLabel": "",
            "axisPlacement": "auto",
            "barAlignment": 0,
            "drawStyle": "line",
            "fillOpacity": 10,
            "gradientMode": "none",
            "hideFrom": {
              "legend": false,
              "tooltip": false,
              "viz": false
            },
            "lineInterpolation": "linear",
            "lineWidth": 1,
            "pointSize": 5,
            "scaleDistribution": {
              "type": "linear"
            },
            "showPoints": "auto",
            "spanNulls": false,
            "stacking": {
              "group": "A",
              "mode": "none"
            },
            "thresholdsStyle": {
              "mode": "off"
            }
          },
          "mappings": [],
          "thresholds": {
            "mode": "absolute",
            "steps": [
              {
                "color": "green",
                "value": null
              },
              {
                "color": "red",
                "value": 80
              }
            ]
          },
          "unit": ""
        },
        "overrides": []
      },
      "gridPos": {
        "h": 10,
        "w": 24,
        "x": 0,
        "y": 0
      },
      "id": 1,
      "interval": "10s",
      "options": {
        "legend": {
          "calcs": [],
          "displayMode": "list",
          "placement": "bottom",
          "showLegend": true
        },
        "tooltip": {
          "mode": "single",
          "sort": "none"
        }
      },
      "pluginVersion": "v10.1.0",
      "targets": [
        {
          "datasource": {
            "type": "prometheus",
            "uid": "${datasource}"
          },
          "editorMode": "code",
          "expr": "(sum by (policy_name) (rate(concurrency_limiter_counter_total{component_id=\"root.0\",decision_type=\"DECISION_TYPE_ACCEPTED\"}[30s])) / sum by (policy_name) (rate(concurrency_limiter_counter_total{component_id=\"root.0\"}[30s]))) * 10",
          "intervalFactor": 1,
          "legendFormat": "accepted percentage",
          "range": true,
          "refId": "A"
        }
      ],
      "title": "Accept Percentage",
      "type": "timeseries"
    },
    {
      "datasource": {
        "type": "prometheus",
        "uid": "${datasource}"
      },
      "fieldConfig": {
        "defaults": {
          "color": {
            "mode": "thresholds"
          },
          "mappings": [],
          "noValue": "No data",
          "thresholds": {
            "mode": "absolute",
            "steps": [
              {
                "color": "blue",
                "value": null
              }
            ]
          },
          "unit": "short"
        },
        "overrides": []
      },
      "gridPos": {
        "h": 10,
        "w": 8,
        "x": 0,
        "y": 10
      },
      "id": 2,
      "options": {
        "colorMode": "value",
        "graphMode": "area",
        "justifyMode": "center",
        "orientation": "horizontal",
        "reduceOptions": {
          "calcs": [
            "lastNotNull"
          ],
          "fields": "",
          "values": false
        },
        "textMode": "auto"
      },
      "pluginVersion": "10.0.9",
      "targets": [
        {
          "datasource": {
            "type": "prometheus",
            "uid": "${datasource}"
          },
          "editorMode": "code",
          "expr": "sum by (policy_name) (increase(concurrency_limiter_counter_total{component_id=\"root.0\"}[$__range]))",
          "instant": false,
          "intervalFactor": 1,
          "legendFormat": "{{ policy_name }}",
          "range": true,
          "refId": "A"
        }
      ],
      "title": "Total Requests",
      "type": "stat"
    },
    {
      "datasource": {
        "type": "prometheus",
        "uid": "${datasource}"
      },
      "fieldConfig": {
        "defaults": {
          "color": {
            "mode": "thresholds"
          },
          "mappings": [],
          "noValue": "No data",
          "thresholds": {
            "mode": "absolute",
            "steps": [
              {
                "color": "green",
                "value": null
              }
            ]
          },
          "unit": "short"
        },
        "overrides": []
      },
      "gridPos": {
        "h": 10,
        "w": 8,
        "x": 8,
        "y": 10
      },
      "id": 3,
      "options": {
        "colorMode": "value",
        "graphMode": "area",
        "justifyMode": "center",
        "orientation": "horizontal",
        "reduceOptions": {
          "calcs": [
            "lastNotNull"
          ],
          "fields": "",
          "values": false
        },
        "textMode": "auto"
      },
      "pluginVersion": "10.0.9",
      "targets": [
        {
          "datasource": {
            "type": "prometheus",
            "uid": "${datasource}"
          },
          "editorMode": "code",
          "expr": "sum by (policy_name)(increase(concurrency_limiter_counter_total{component_id=\"root.0\", decision_type=\"DECISION_TYPE_ACCEPTED\"}[$__range]))",
          "instant": false,
          "intervalFactor": 1,
          "legendFormat": "{{ policy_name }}",
          "range": true,
          "refId": "A"
        }
      ],
      "title": "Total Accepted Requests",
      "type": "stat"
    },
    {
      "datasource": {
        "type": "prometheus",
        "uid": "${datasource}"
      },
      "fieldConfig": {
        "defaults": {
          "color": {
            "mode": "thresholds"
          },
          "mappings": [],
          "noValue": "No rejected requests",
          "thresholds": {
            "mode": "absolute",
            "steps": [
              {
                "color": "red",
                "value": null
              }
            ]
          },
          "unit": "short"
        },
        "overrides": []
      },
      "gridPos": {
        "h": 10,
        "w": 8,
        "x": 16,
        "y": 10
      },
      "id": 4,
      "options": {
        "colorMode": "value",
        "graphMode": "area",
        "justifyMode": "center",
        "orientation": "horizontal",
        "reduceOptions": {
          "calcs": [
            "lastNotNull"
          ],
          "fields": "",
          "values": false
        },
        "textMode": "auto"
      },
      "pluginVersion": "10.0.9",
      "targets": [
        {
          "datasource": {
            "type": "prometheus",
            "uid": "${datasource}"
          },
          "editorMode": "code",
          "expr": "sum by (policy_name)(increase(concurrency_limiter_counter_total{component_id=\"root.0\", decision_type=\"DECISION_TYPE_REJECTED\"}[$__range]))",
          "instant": false,
          "intervalFactor": 1,
          "legendFormat": "{{ instance }} - {{ policy_name }}",
          "range": true,
          "refId": "A"
        }
      ],
      "title": "Total Rejected Requests",
      "type": "stat"
    },
    {
      "datasource": {
        "type": "prometheus",
        "uid": "${datasource}"
      },
      "description": "",
      "fieldConfig": {
        "defaults": {
          "color": {
            "mode": "palette-classic"
          },
          "custom": {
            "axisCenteredZero": false,
            "axisColorMode": "text",
            "axisLabel": "Decisions",
            "axisPlacement": "auto",
            "barAlignment": 0,
            "drawStyle": "line",
            "fillOpacity": 10,
            "gradientMode": "none",
            "hideFrom": {
              "legend": false,
              "tooltip": false,
              "viz": false
            },
            "lineInterpolation": "linear",
            "lineWidth": 1,
            "pointSize": 5,
            "scaleDistribution": {
              "type": "linear"
            },
            "showPoints": "auto",
            "spanNulls": false,
            "stacking": {
              "group": "A",
              "mode": "none"
            },
            "thresholdsStyle": {
              "mode": "off"
            }
          },
          "mappings": [],
          "thresholds": {
            "mode": "absolute",
            "steps": [
              {
                "color": "green",
                "value": null
              },
              {
                "color": "red",
                "value": 80
              }
            ]
          },
          "unit": "reqps"
        },
        "overrides": []
      },
      "gridPos": {
        "h": 10,
        "w": 24,
        "x": 0,
        "y": 20
      },
      "id": 5,
      "interval": "10s",
      "options": {
        "legend": {
          "calcs": [],
          "displayMode": "list",
          "placement": "bottom",
          "showLegend": true
        },
        "tooltip": {
          "mode": "single",
          "sort": "none"
        }
      },
      "pluginVersion": "v10.1.0",
      "targets": [
        {
          "datasource": {
            "type": "prometheus",
            "uid": "${datasource}"
          },
          "editorMode": "code",
          "expr": "sum by(decision_type, policy_name) (rate(concurrency_limiter_counter_total{component_id=\"root.0\"}[$__rate_interval]))",
          "intervalFactor": 1,
          "range": true,
          "refId": "A"
        }
      ],
      "title": "Concurrency Limiter Decision Overview",
      "type": "timeseries"
    }
  ],
  "refresh": "",
  "schemaVersion": 38,
  "style": "dark",
  "tags": [],
  "templating": {
    "list": [
      {
        "hide": 0,
        "includeAll": false,
        "label": "Data Source",
        "multi": false,
        "name": "datasource",
        "options": [],
        "query": "prometheus",
        "refresh": 1,
        "regex": "",
        "skipUrlSync": false,
        "type": "datasource"
      }
    ]
  },
  "time": {
    "from": "now-5m",
    "to": "now"
  },
  "timepicker": {},
  "timezone": "browser",
  "title": "Policy Summary - concurrencylimit",
  "version": 1,
  "weekStart": ""
}

The following figure shows the dashboard.
image