Application Real-Time Monitoring Service (ARMS) collects performance data from your web pages and mobile HTML5 pages, including page views (PVs), resource loading times, API request metrics, and JavaScript errors. Use the monitoring dashboard to trace user sessions, reconstruct real user flows, collect error stacks and contextual information, and pinpoint root causes of performance issues to help you expedite troubleshooting.
Use cases
The monitoring dashboard supports four core workflows:
| Workflow | What you can do | Dashboard tab |
|---|---|---|
| Track performance | Monitor page load times, Core Web Vitals, and resource loading across all pages | PVs, Resource loading |
| Diagnose errors | Identify JavaScript exceptions, view error stacks, and assess the blast radius by affected pages, users, and sessions | Abnormal statistics |
| Analyze traffic | Review PV counts, unique visitors (UVs), and per-page engagement metrics | Application Overview, PVs |
| Trace user sessions | Replay end-to-end user journeys by session ID or user ID to reproduce issues in context | Session Tracing |
Open the application details page
Log on to the ARMS console.
In the left-side navigation pane, choose . In the top navigation bar, select the region where your application is deployed.
Click the application name. The application details page opens with six tabs: Application Overview, Session Tracing, PVs, Resource loading, API Requests, and Abnormal statistics.
Tip: Adjust the time range for all charts on the page by using the time selector in the upper-right corner.
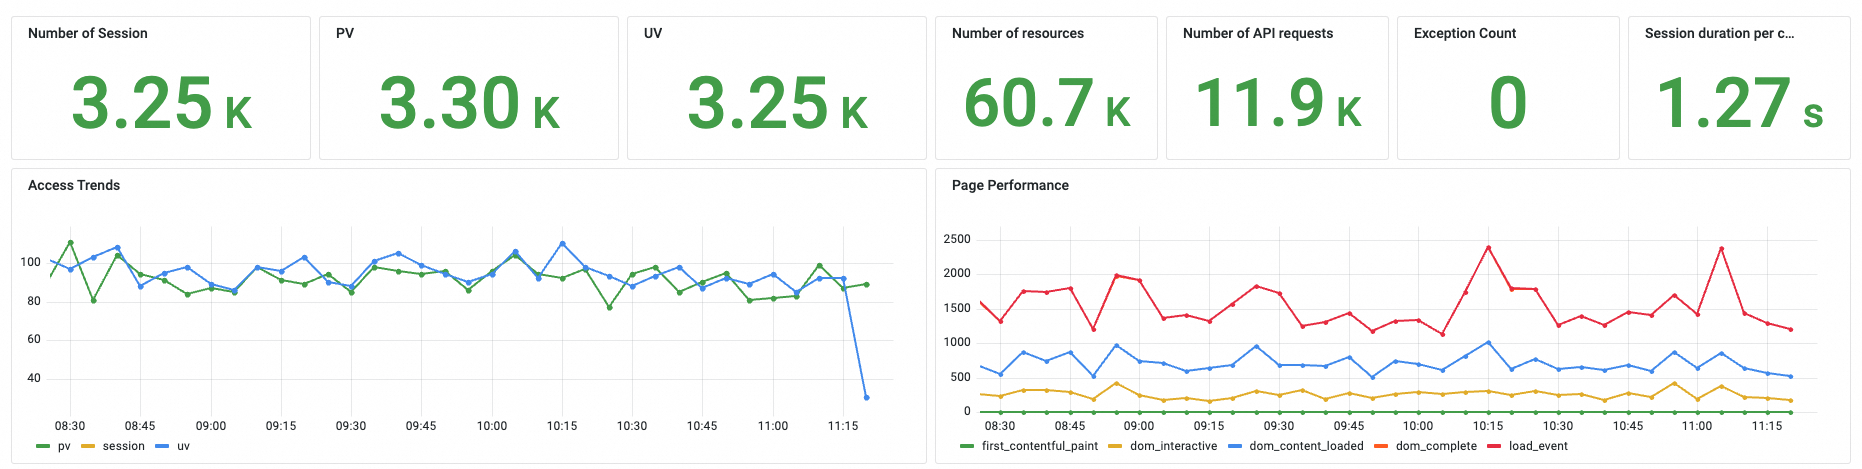
Application Overview
Get a high-level summary of your application's health and usage at a glance.
| Metric | Description |
|---|---|
| User sessions | Total number of user sessions in the selected time range |
| PVs | Total page views |
| UVs | Unique visitors |
| Resources | Total resource requests |
| API requests | Total API calls |
| Exceptions | Total number of JavaScript errors |
| Max page rendering time | Longest page render observed |
Each metric includes a trend chart to help you spot regressions or improvements over time.
Session Tracing
Reproducing a bug often requires full context. The Session Tracing tab supports end-to-end tracing based on username or user ID, letting you reconstruct a user's complete journey to reproduce and diagnose problems.
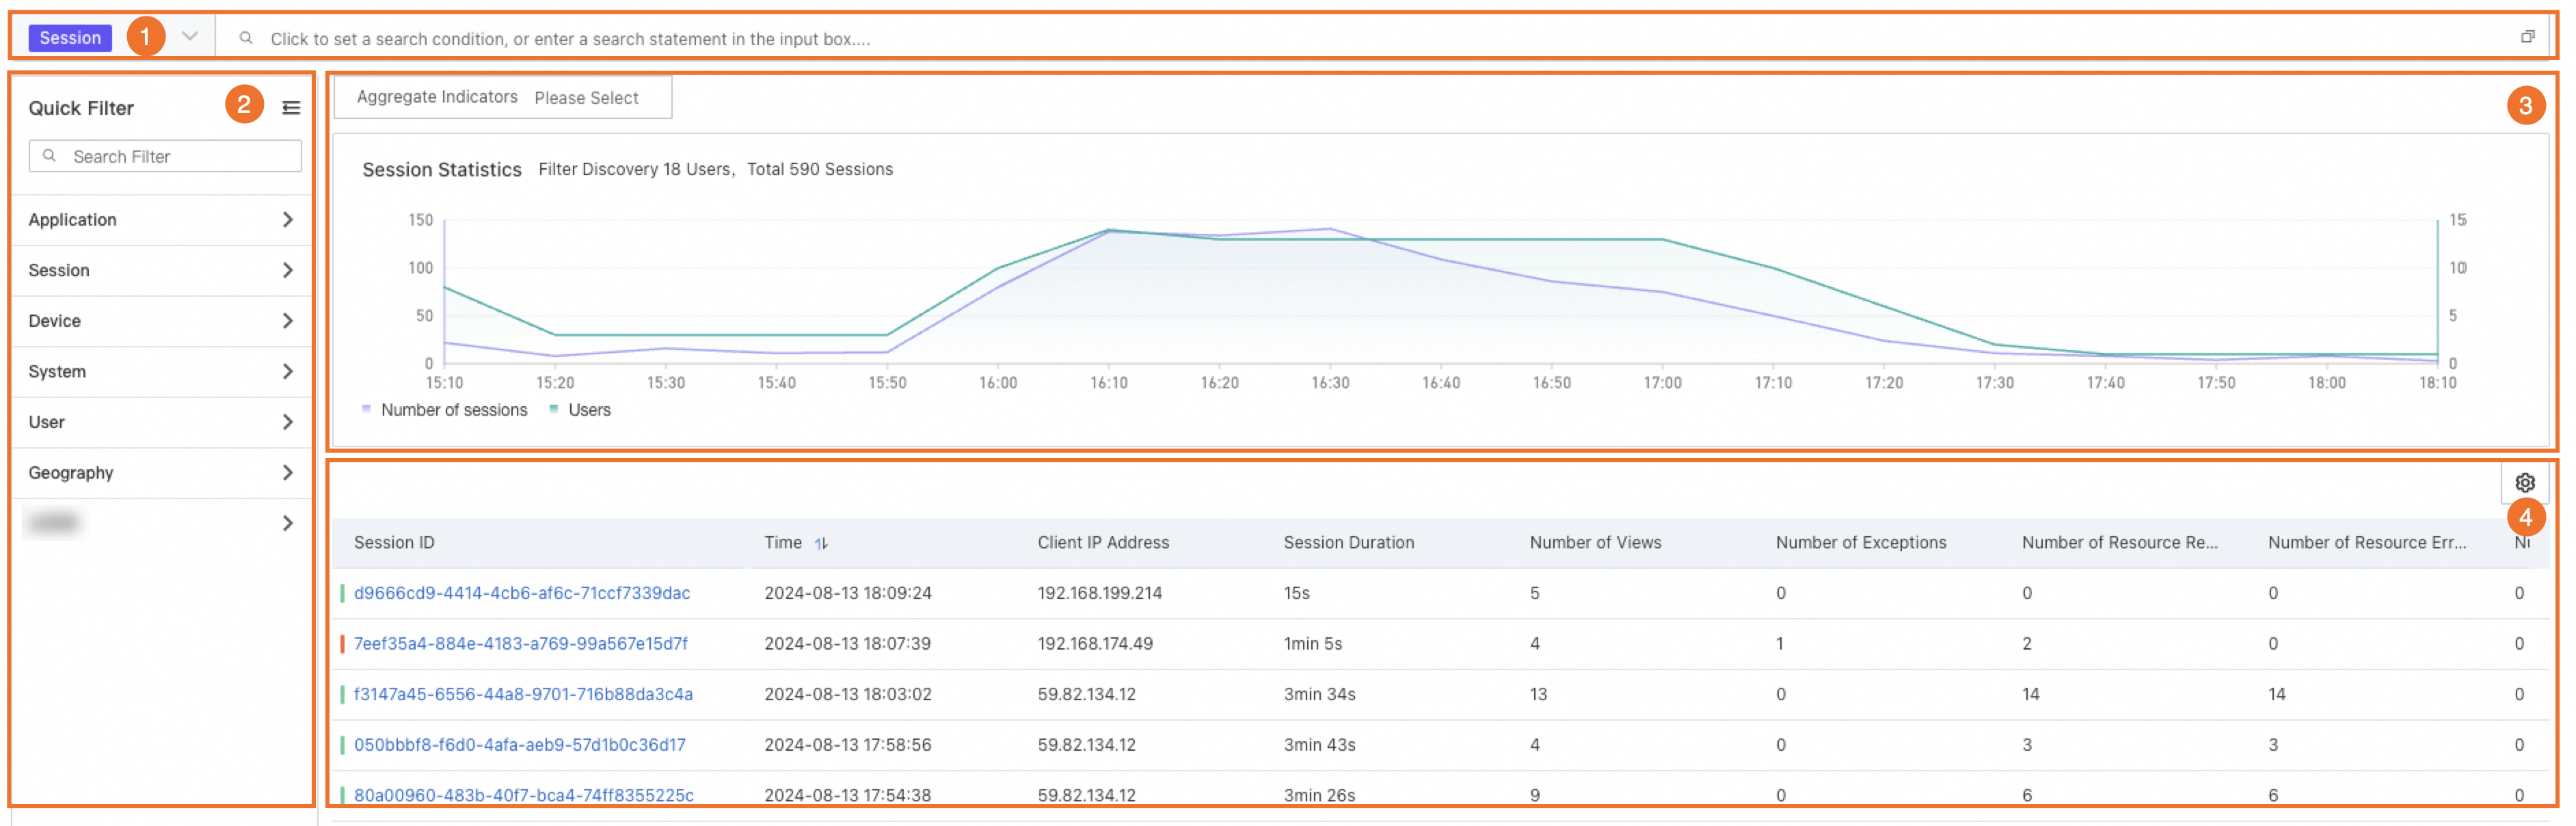
Search and filter sessions
Search box: Enter a session ID to locate a specific session.
Quick Filter: Specify a condition to filter data. Filters work in combination with the search box and allow you to manually hide metrics.
Visualize session data
Metric aggregation: Select an aggregation metric and dimension, then visualize the data as a column chart, line chart, pie chart, or map.
Drill down into session details
Session list: Browse all sessions with summary information. Click a session ID to view PVs, resource loading details, and user actions for that session.
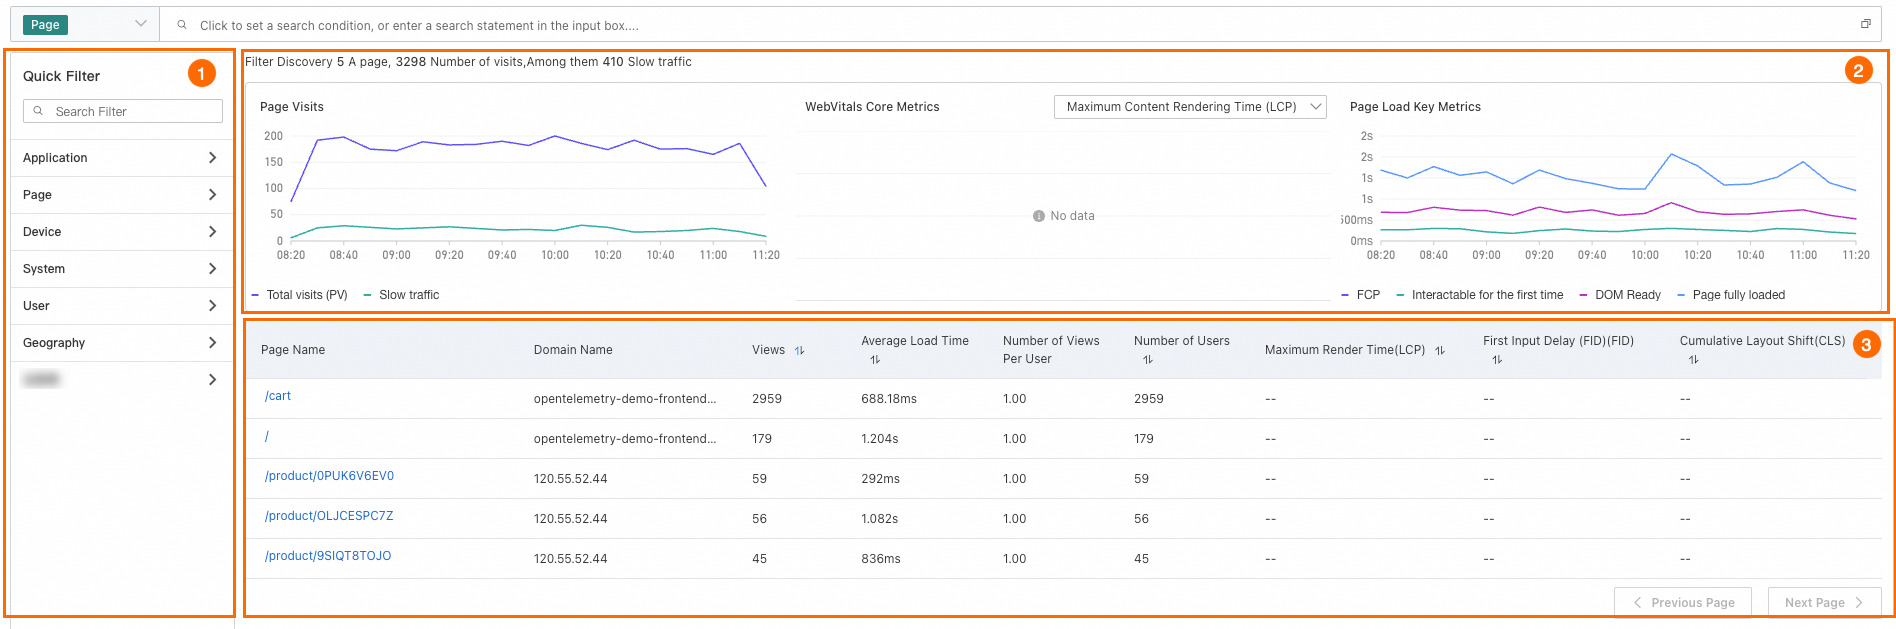
PVs
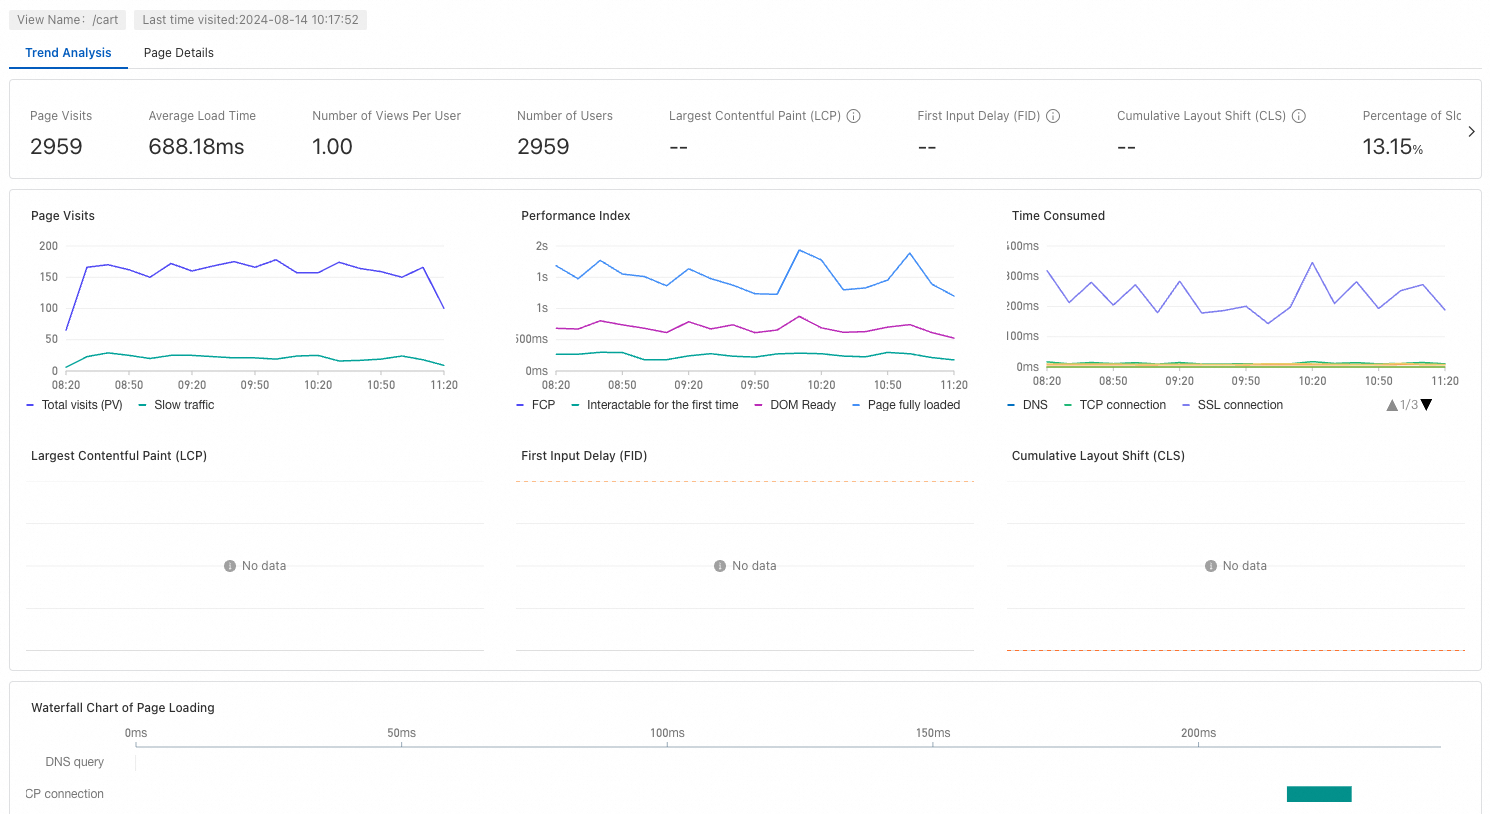
The PVs tab tracks page-level performance data, including PV counts, Core Web Vitals, and page load metrics.
Core Web Vitals
The trend charts display the following WebVitals core metrics:
| Metric | Full name | What it measures |
|---|---|---|
| LCP | Largest Contentful Paint | Loading performance -- time until the largest visible element renders |
| FID | First Input Delay | Interactivity -- delay between the first user interaction and the browser's response |
| CLS | Cumulative Layout Shift | Visual stability -- how much the page layout shifts unexpectedly during loading |
Page load metrics
| Metric | What it measures |
|---|---|
| FCP (First Contentful Paint) | Time until the first piece of content renders |
| DOM Ready | Time until the DOM is fully parsed |
| TTI (Time to Interactive) | Time until the page is fully interactive |
| Page Fully Loaded | Time until all resources finish loading |
Analyze page performance
Use Quick Filter to search for a specific page by URL or other conditions.
Review trend charts for PV counts, Core Web Vitals, and page load metrics over time.
In the page list, compare pages by PV count, average load time, and views per user. Click a page name to view its trend analysis and individual PV details.
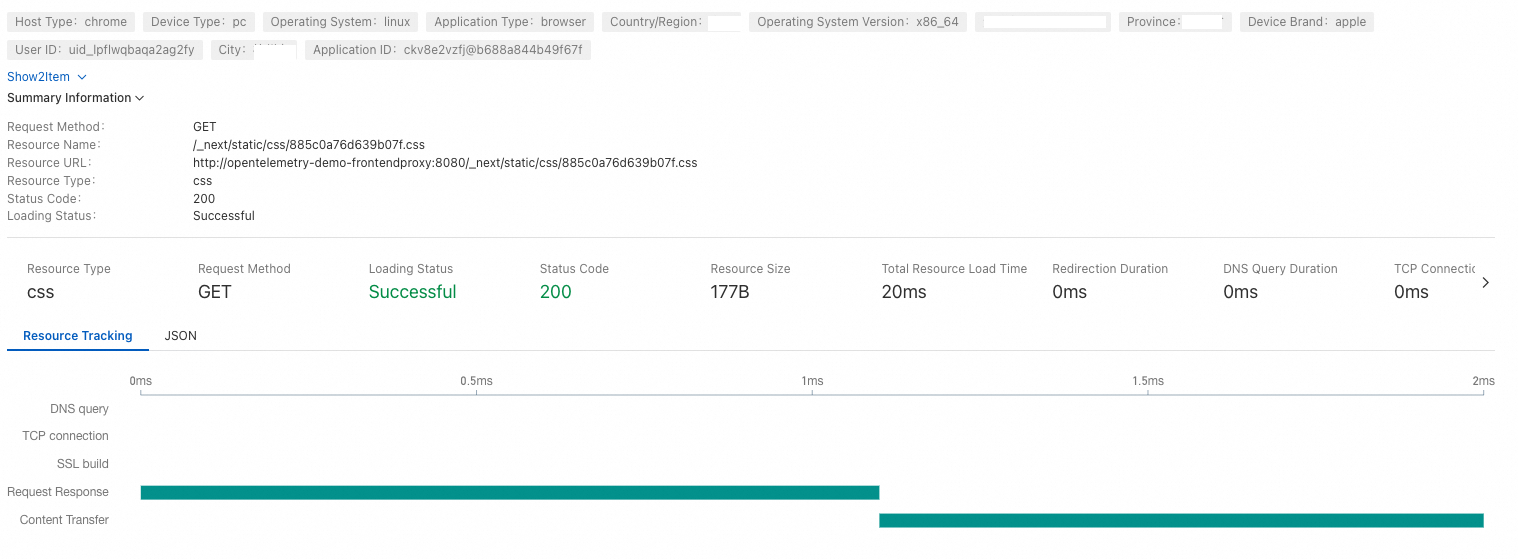
Resource loading
The Resource loading tab shows error rates, performance data, and request statistics for all resources your application loads, including API requests and Content Delivery Network (CDN) static resources.
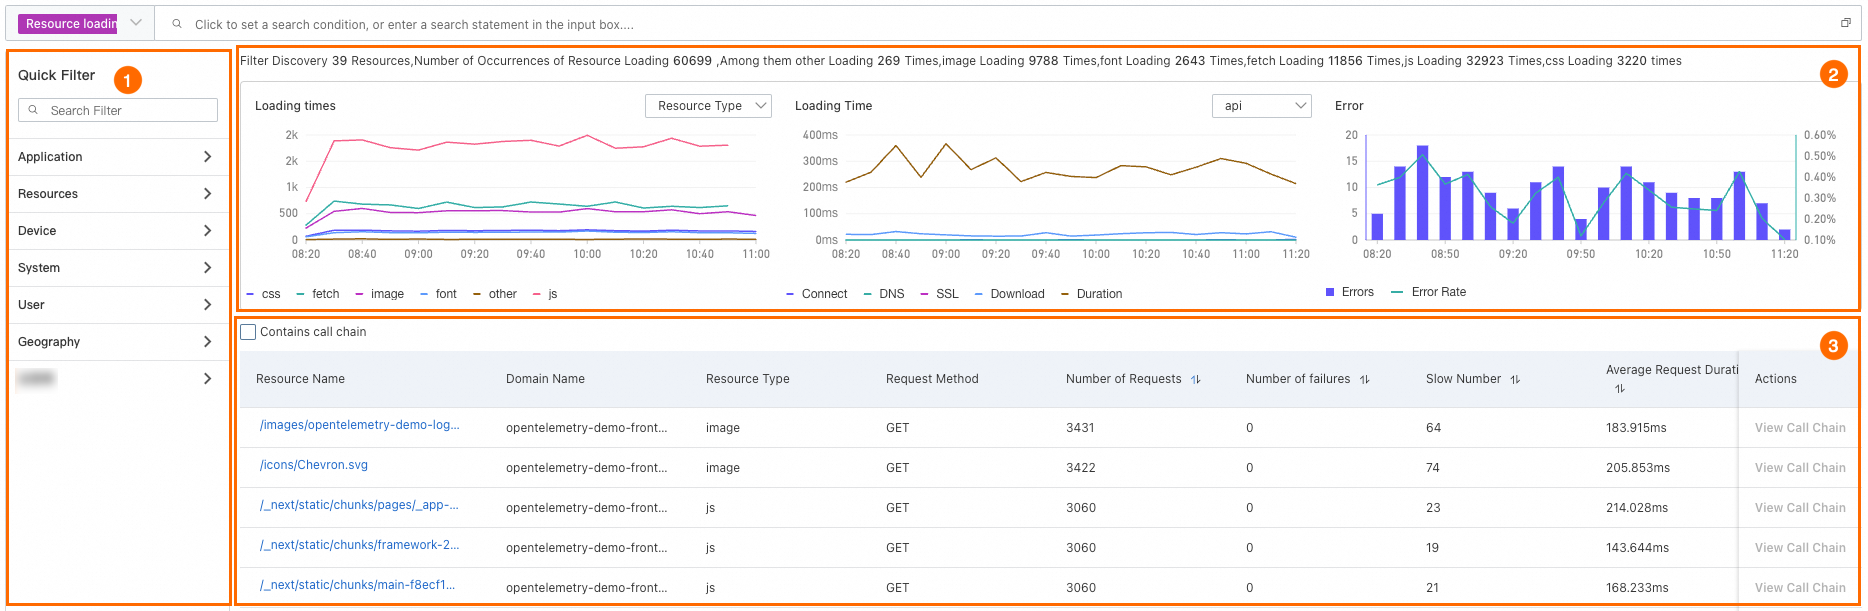
Identify slow or failing resources
Use Quick Filter to filter resources by type, domain, or other conditions.
Review trend charts for resource load counts (grouped by resource type or request method), load times (grouped by resource type), and error counts over time.
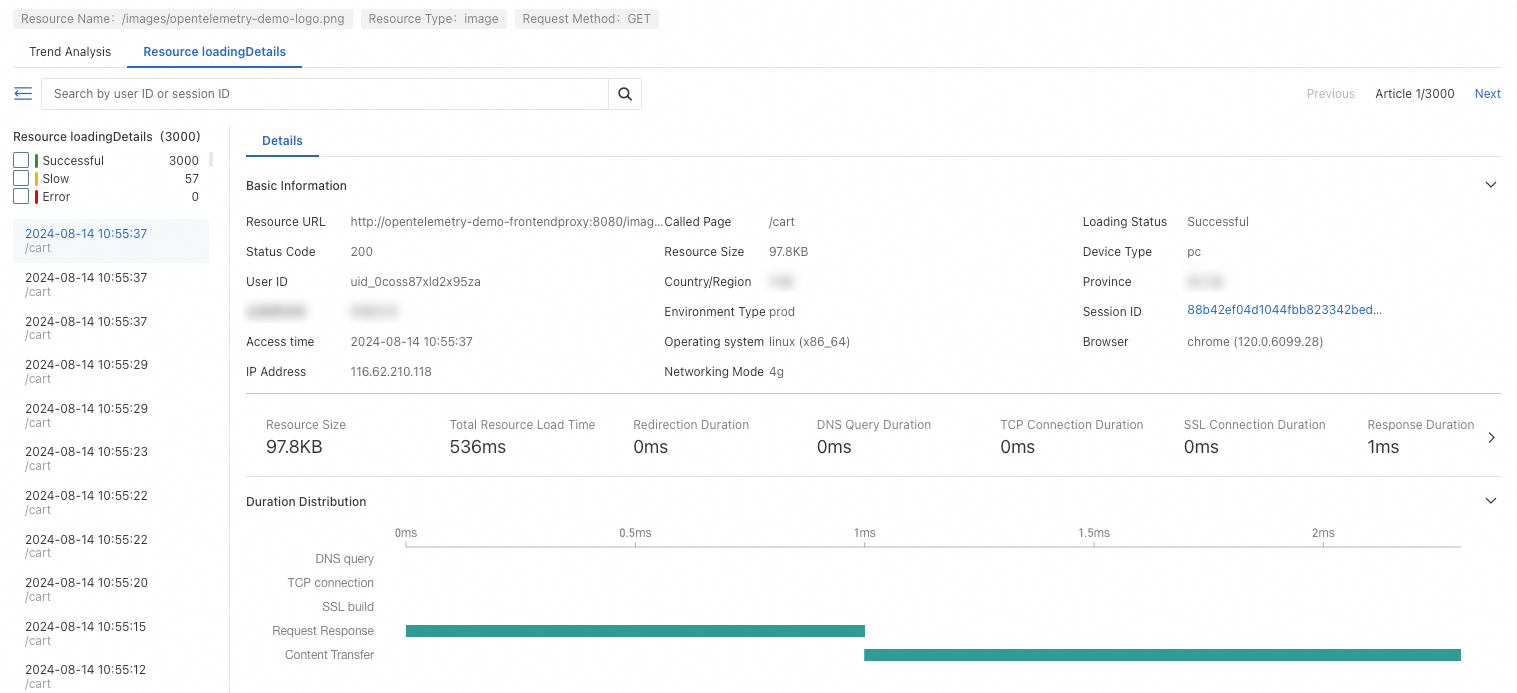
In the resource list, review each resource's domain name, type, request method, request count, failure count, slow response count, and average request duration. Click a resource name to view its trend analysis and load stacks.
API Requests
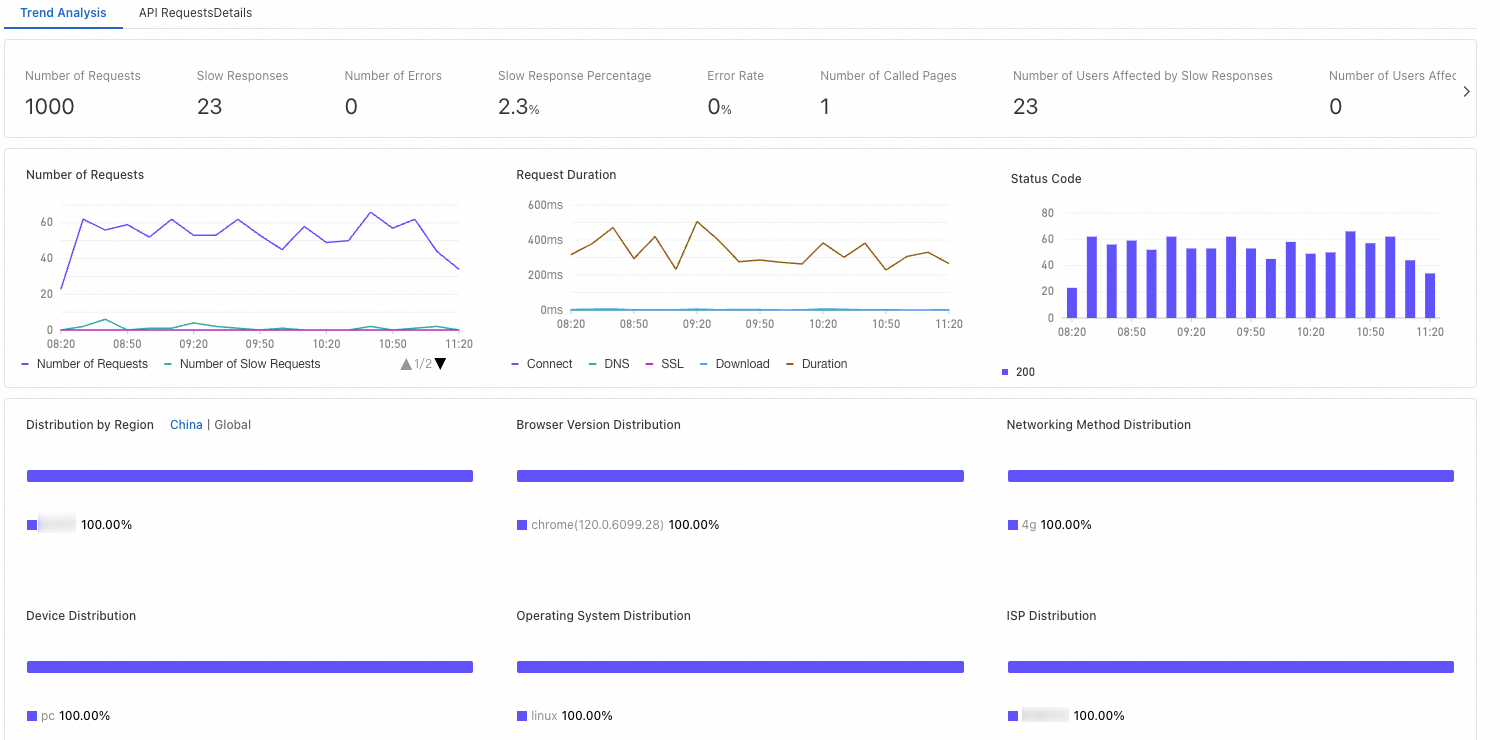
The API Requests tab tracks request volume, latency, and status codes for every API endpoint your application calls.
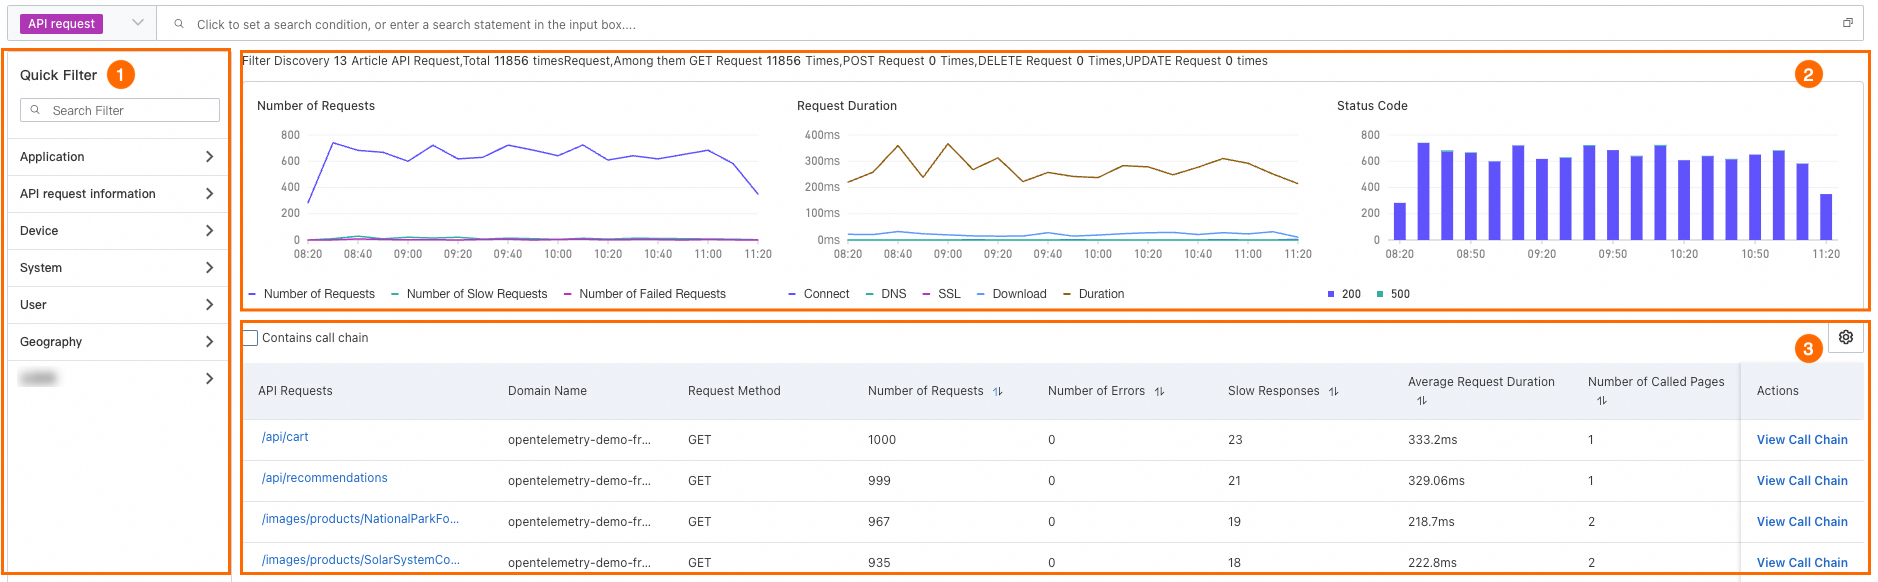
Investigate API performance
Use Quick Filter to filter API operations by endpoint, status code, or other conditions.
Review trend charts for request counts, request duration, and status code distribution over time.
In the API operation list, compare API endpoints by request method, request count, error count, slow response count, average request duration, and the number of pages that call each endpoint. Click an API operation name to view its trend analysis and request details.
Abnormal statistics
The Abnormal statistics tab surfaces JavaScript errors across your application, helping you prioritize fixes based on impact.
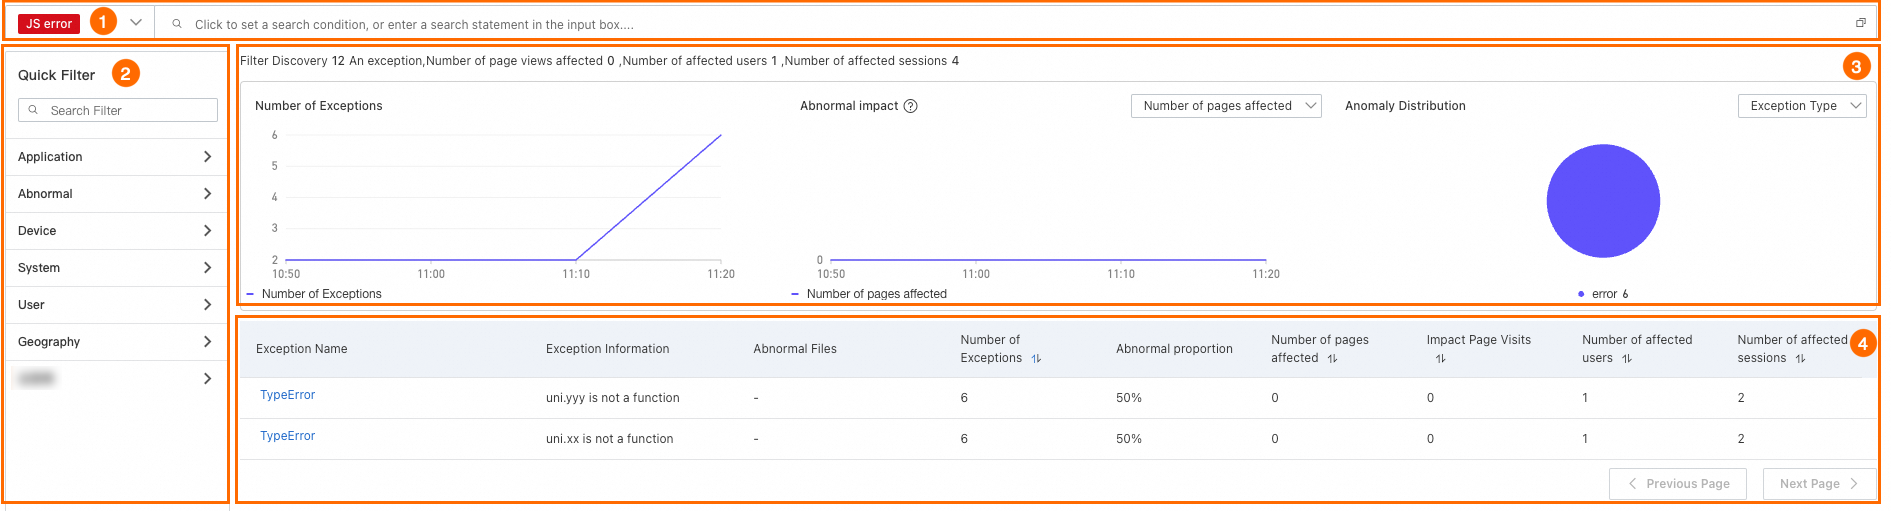
Triage JavaScript errors
Enter JavaScript error information in the search box to filter exceptions.
Use Quick Filter to narrow results by error type, file, page, or other conditions.
Review trend charts for the total number of exceptions and the number of affected pages, users, and sessions. View the distribution of exception types, error source files, and affected pages.
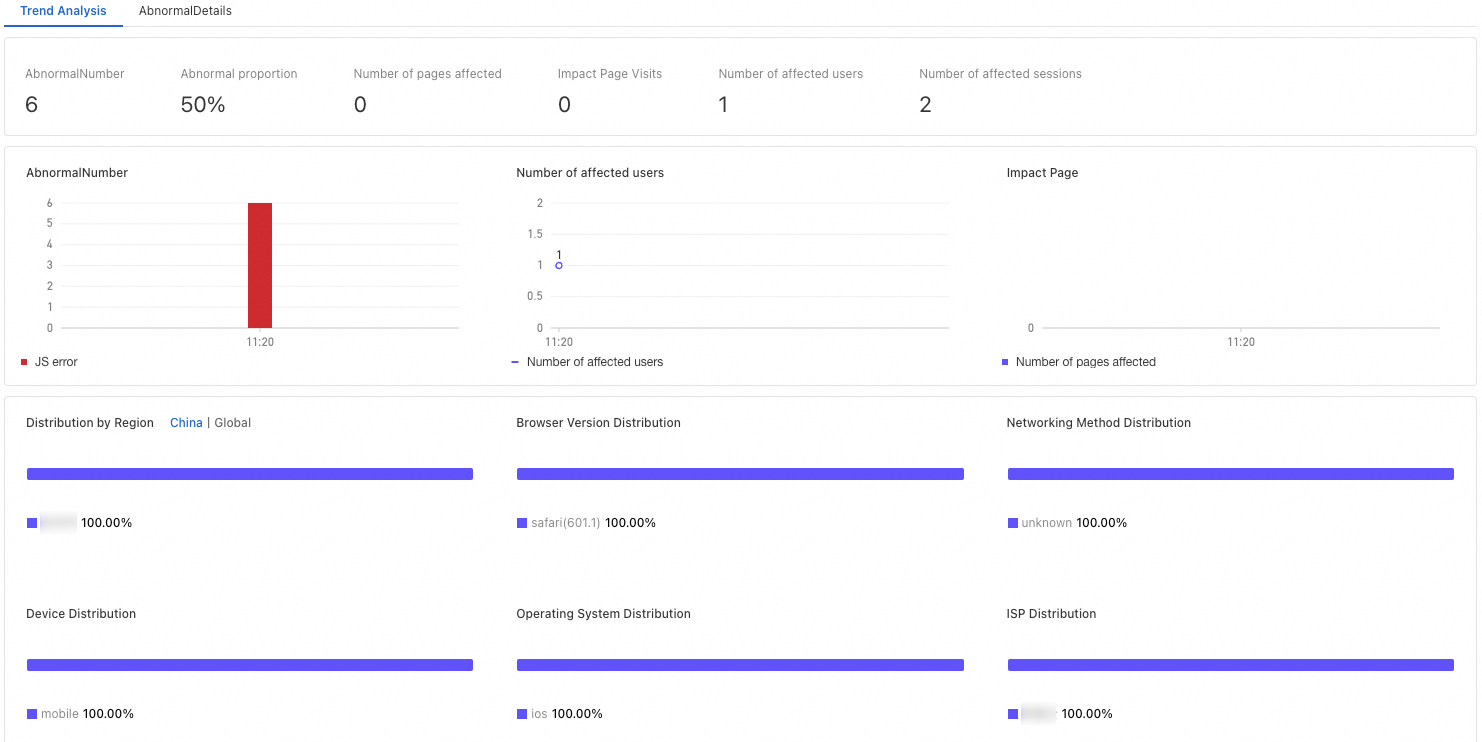
In the exception list, review each exception's error message, source file, occurrence count, and blast radius (affected pages, PVs, users, and sessions). Click an exception to view its trend analysis and detailed error information, including stack traces.
See also
Data exploration -- Query, aggregate, and trace monitoring data for deeper analysis.