Mini program monitoring collects and analyzes performance data for mini programs that run in super apps such as DingTalk and WeChat, including page views, resource loading, API requests, and JavaScript errors. Single-user session tracing reconstructs real user scenarios and captures error stacks together with their context, so you can trace an issue back to its root cause and resolve performance issues efficiently.
Procedure
Log on to the ARMS console.
In the left-side navigation pane, choose Real User Monitoring > Application List. In the top menu bar, select the region where your application resides.
Click the name of the target application.
You should see the dashboards of the application, organized into the Application Overview, Session Tracing, PVs, Resource Loading, API Requests, and Abnormal Statistics tabs.
Choose a dashboard
Each tab of a mini program application answers a different question. Use the following table to decide where to start.
| What you want to find out | Tab |
| How the mini program performs overall across users, pages, and requests | Application Overview |
| What a single user did before an error occurred | Session Tracing |
| Which pages are slow and how they score on Core Web Vitals | PVs |
| Why a resource, such as a CDN static asset, fails or loads slowly | Resource Loading |
| How an API performs and which status codes it returns | API Requests |
| How many pages, users, and sessions a JavaScript error affects | Abnormal Statistics |
Common dashboard elements
The tabs of a mini program application share the same page layout:
Time selector — Adjust the query time range in the upper-right corner of the page. The selected range applies to the charts and lists on the page.
Quick filter area — Select filter conditions to narrow the data to the dimensions you care about. The available dimensions differ by tab.
Trend chart area — Compare metrics of the current tab over the selected time range.
List area — Review aggregated metrics for every page, resource, API, or exception. Click an item name to open its details page.
Application overview
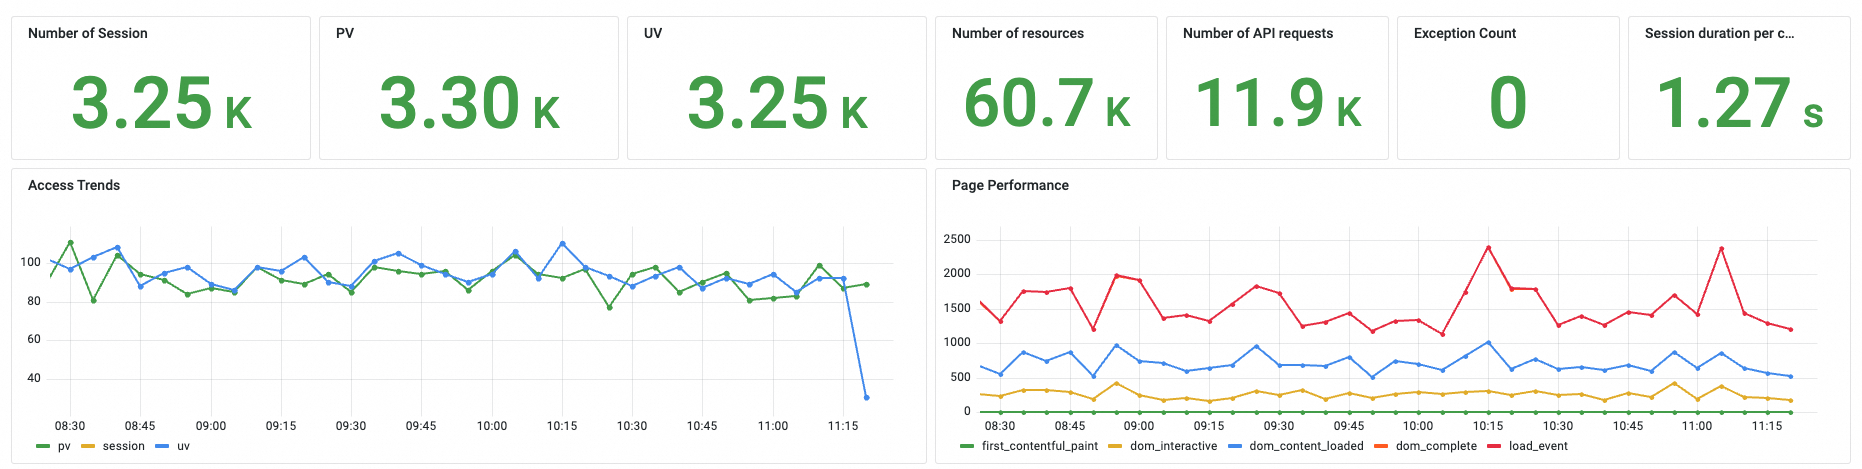
The Application Overview tab centralizes key application-level metrics for users, pages, and requests: the number of user sessions, page views (PVs), unique visitors (UVs), resources, maximum page rendering time, API requests, and exceptions. Trend charts show how these metrics evolve, so you can assess the overall performance of the application at a glance.
Session tracing
The Session Tracing tab provides end-to-end tracing by username or user ID. It reconstructs the user journey so that you can locate and analyze the root cause of an error.
Search box — Enter a session ID to filter sessions.
Quick filter area — Filter sessions by Application, Session, Device, System, User, and Region. This area is linked with the search box and lets you manually hide metrics.
Aggregation chart area — Select an aggregation metric and an aggregation dimension, and then display the result as a column chart, line chart, pie chart, or map.
Session list — Review each session by Session ID, Time, Client IP, Session Duration, View Count, Exception Count, Resource Requests, and Resource Errors.
Session details
Click a session ID to open the session details and drill down into pages, resources, and user actions. When you drill down to a resource, the resource loading details page shows the following information:
Summary information — Request Method (for example, GET), Resource Name, Resource URL, Resource Type (for example, link), Status Code (for example, 200), and Loading Status.
Environment information — Host Type, Device Type, Country, Province, Device Brand, and the other environment fields shown on the page.
Resource tracking — Phase durations, total resource loading duration, and resource size. For the full field list, see Resource loading details.
Waterfall chart — The duration distribution of the DNS query, TCP connection, SSL connection, request response, and content transfer phases on a timeline.
PVs
The PVs tab provides page-level data on traffic, Core Web Vitals, and key page load metrics.
Quick filter area — Select the pages to analyze.
Trend chart area — Compare page view trends, Core Web Vitals, and key page load metrics. Core Web Vitals cover Largest Contentful Paint (LCP), First Input Delay (FID), and Cumulative Layout Shift (CLS). Key page load metrics cover First Contentful Paint (FCP), DOM Ready, Time to Interactive (TTI), and Page Fully Loaded.
Page list — Review the PV count, average duration, and average views per user for all pages.
Page details
Click a page name to open its details, which include trend analysis and PV details. The Trend Analysis tab shows the following information:
Summary metrics — PVs, average loading duration, average session duration, average views per user, UVs, LCP, FID, CLS, slow visit percentage, and session count.
Trend line charts — PVs including slow visits, performance metrics (FCP, TTI, DOM Ready, and Page Fully Loaded), and phase-by-phase duration (DNS query, TCP connection, SSL connection, request response, and content transfer).
Core Web Vitals line charts — LCP, FID, and CLS, each with P75, P90, and P95 percentile lines. The LCP chart marks 2.5 seconds or less as Good and more than 4 seconds as Poor. The CLS chart marks a threshold at 0.25.
Page load waterfall chart
Resource loading
The Resource Loading tab provides resource-level data on errors, performance, and requests for resources such as API requests and CDN static assets.
Quick filter area — Filter resources by Application, Resource, Device, System, User, and Region.
Trend chart area — Compare load counts by resource type and request method, and loading duration by resource type. The loading duration trend chart breaks each request into Connect, DNS, SSL, Download, and Duration.
Resource list — Review the URL, type, request method, request count, failure count, slow count, and average duration for all resources.
Resource loading details
Click a resource name to open its details, which include trend analysis and the stack trace. On the Resource Loading Stack tab, the Resource Loading List on the left shows a timestamp for each loading record. Click a record to display the following fields in the Basic Information panel on the right.
| Field group | Fields |
| Phase duration | Redirect Duration, DNS Query Duration, TCP Connection Duration, SSL Connection Duration, Request Response Duration, and Content Transfer Duration |
| Result and size | Status Code, Loading Status, Total Resource Loading Duration, and Resource Size |
| Device and host | Device Type, Device Brand, Operating System, Host Type, and Host Version |
| User and environment | User ID, Name, Country, Province, and Environment Type |
The Waterfall View at the bottom of the page visualizes the resource loading sequence.
API requests
The API Requests tab provides API-level data such as request count, request duration, and status codes.
Trend chart area — Compare the API request count and request duration of the application, and review the status code distribution.
API request list — Review the request method, request count, error count, slow count, average request duration, and number of calling pages for all APIs.
API request details
Click an API request name to open its details, which include trend analysis and data for individual requests. In addition to the overview metrics, the Trend Analysis tab shows the following information:
Request Count line chart — Request count, slow request count, and error request count.
Request Duration line chart — Duration trends for the Connect, DNS, SSL, Download, and Duration phases.
Status Code pie chart — The percentage of requests by HTTP status code.
Distribution charts — Geographic, app version, network type, device, and operating system distribution.
User list — User identifiers, request count, request percentage, and request time.
Abnormal statistics
The Abnormal Statistics tab provides exception-level data such as exception counts, impact, and distribution.
Search box — Enter a JavaScript error message to filter exceptions.
Trend chart area — Compare trends for the total number of exceptions and for the numbers of affected pages, users, and sessions. You can also review the distribution of exception types, files, or pages.
Exception list — Review the message, involved files, number of occurrences, and the numbers of affected pages, page views, users, and sessions for all exceptions.
Exception details
Click an exception name to open its details, which include trend analysis and the corresponding stack trace. The Trend Analysis tab shows time-series charts for error count, affected users, and affected pages, together with geographic, browser version, network type, device, operating system, and carrier distribution.
References
Data exploration lets you quickly query, aggregate, and trace monitoring data. For details, see data exploration.