Real User Monitoring (RUM), a sub-service of Application Real-Time Monitoring Service (ARMS), monitors iOS and Android applications in production. RUM captures exceptions, restores contextual data around each incident, and pinpoints root causes through performance analysis -- helping you resolve issues faster.
Non-intrusive SDK integration for most monitoring features.
Full exception-scenario reproduction for faster debugging.
Open the application details page
Log on to the ARMS console.
In the left-side navigation pane, choose . In the top navigation bar, select the region where your application is deployed.
Click the application name. The application details page opens with five tabs: Application Overview, Session Tracing, PVs, Resource loading, and Abnormal statistics.
You can adjust the time range of the data that you want to query by using the time selector in the upper-right corner of the page.
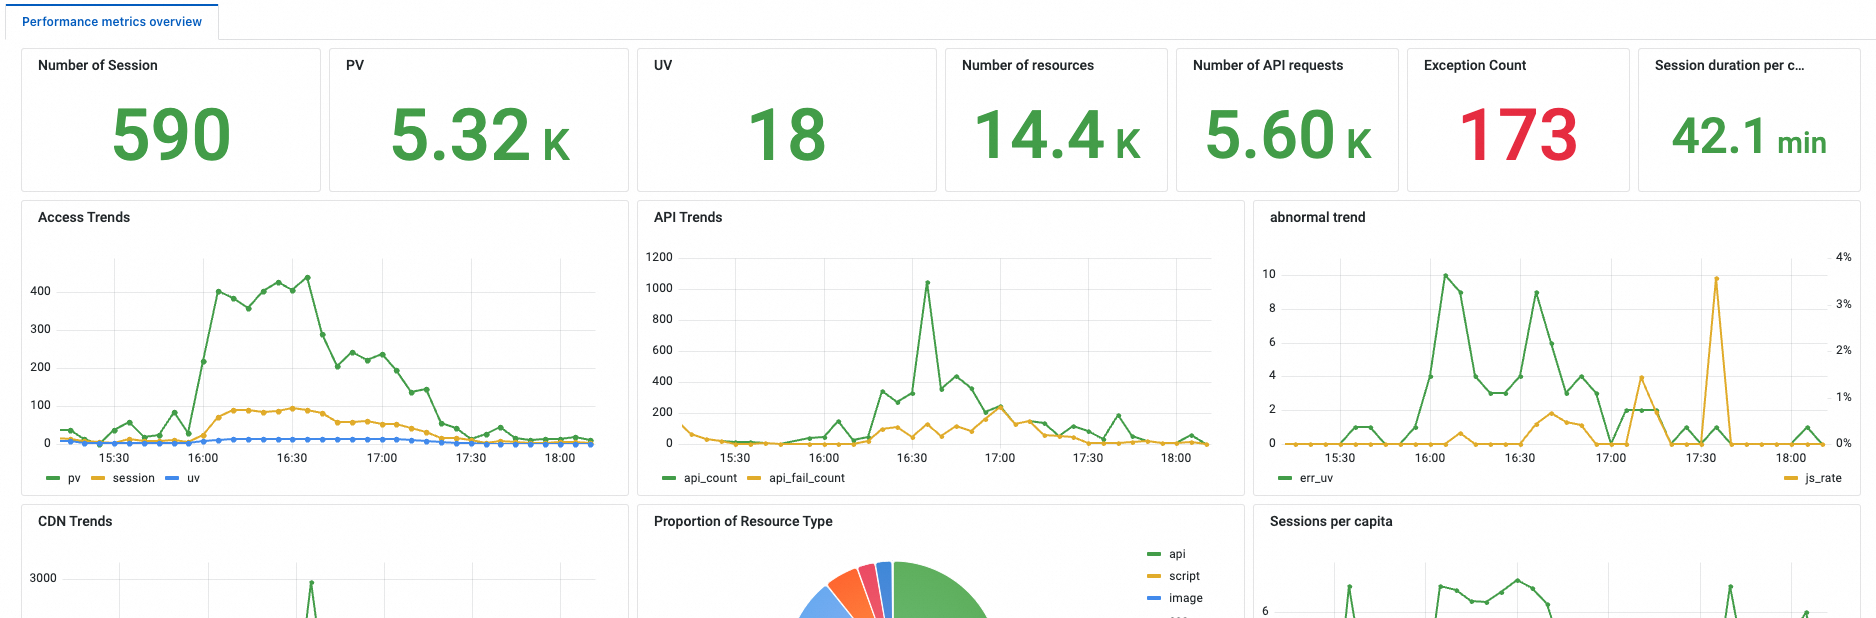
Application Overview tab
The Application Overview tab provides a snapshot of application health. It displays the following metrics and trends:
| Metric | Description |
|---|---|
| Sessions | Total number of user sessions during the selected time range. |
| Page views (PVs) | Total page views recorded across the application. |
| Unique visitors (UVs) | Count of distinct users who accessed the application. |
| Resources | Number of resource requests, including API calls and static assets. |
| API requests | Total API calls made by the application. |
| Exceptions | Number of captured exceptions. |
The tab also charts page performance and visit trends over time to surface degradation or traffic spikes.
Session Tracing tab
When troubleshooting a fault, you often need to see what the user did before the issue occurred. The Session Tracing tab provides end-to-end tracing by username or user ID, reproducing the full sequence of user actions to help locate root causes.
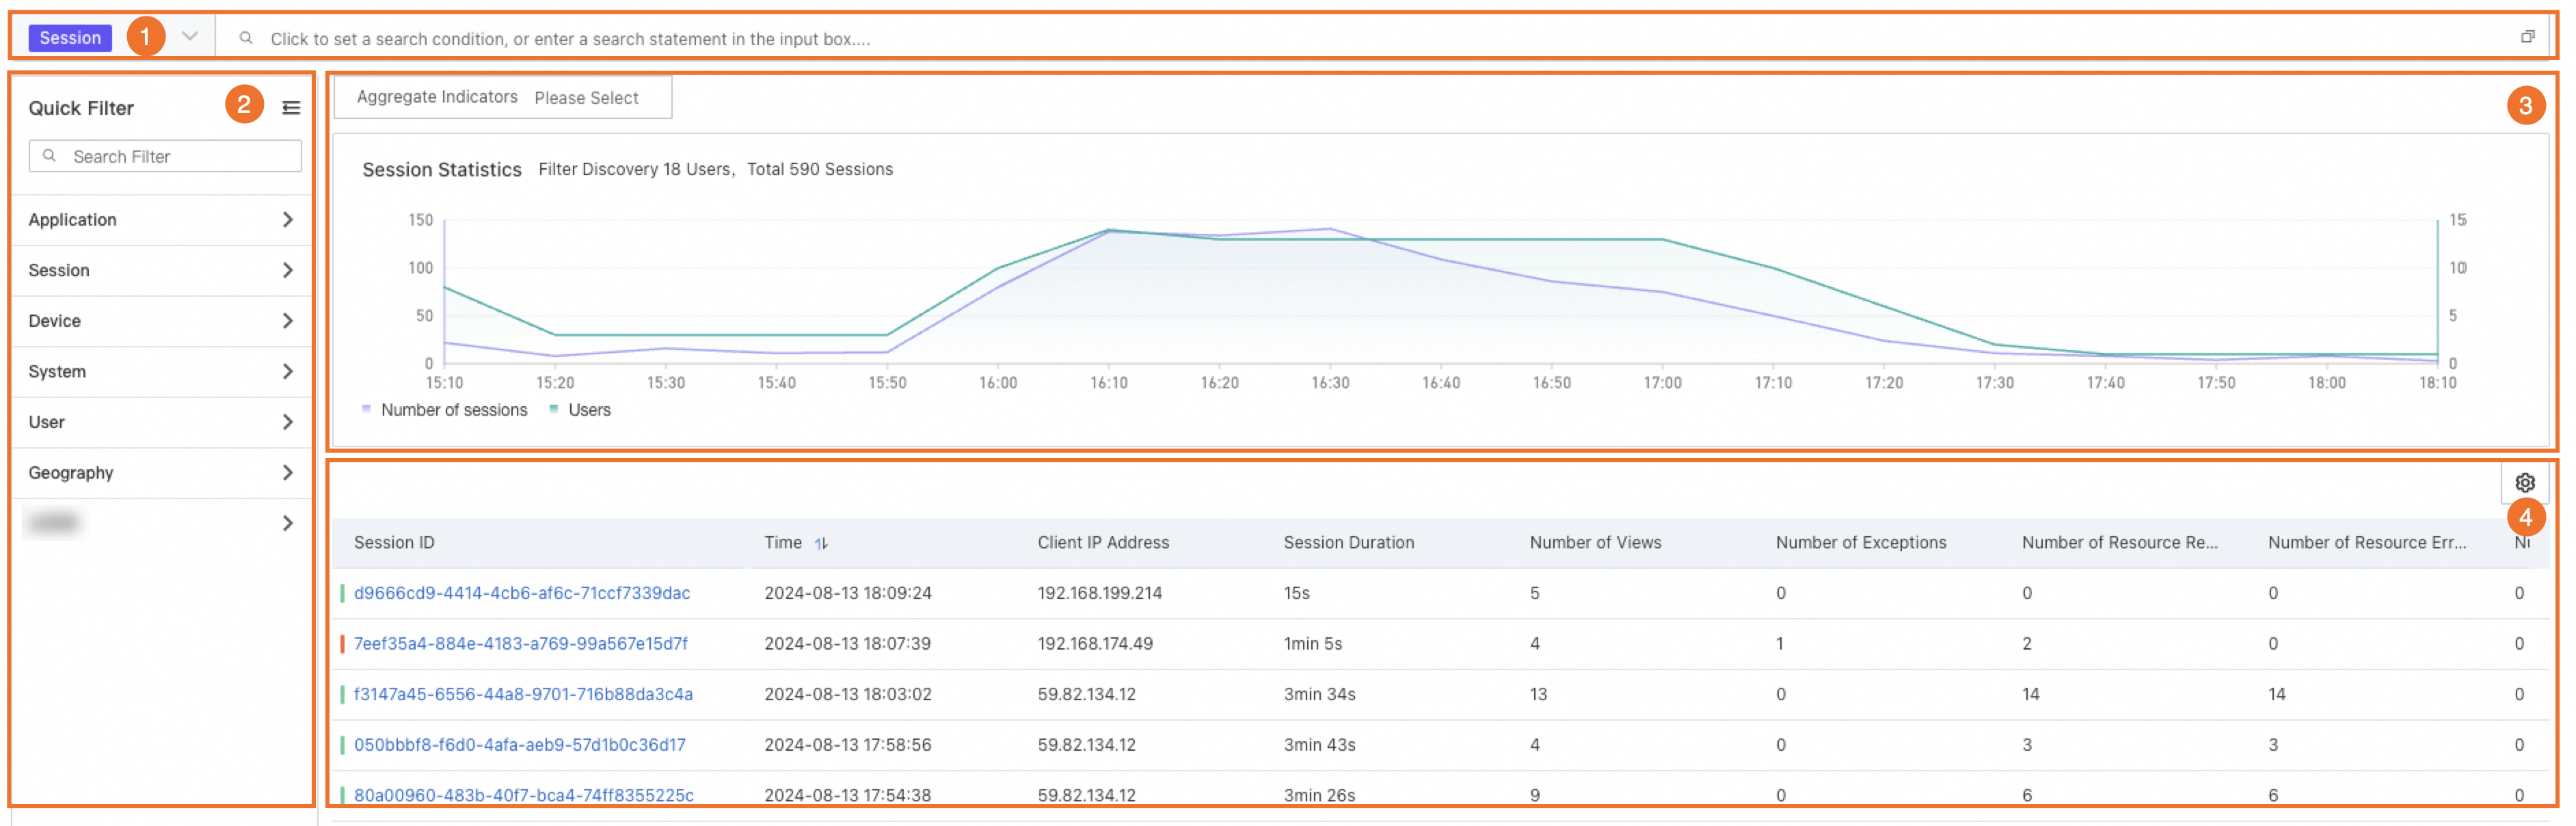
The tab is organized into four sections:
| Section | Purpose |
|---|---|
| Search box (1) | Filter sessions by entering a search statement. |
| Quick Filter (2) | Narrow results by specific conditions. Works in conjunction with the search box. |
| Metric aggregation (3) | Aggregate data by a chosen metric and dimension. Visualize results as a column chart, line chart, pie chart, or map. |
| Session list (4) | Browse individual sessions. Click a session ID to drill down into PVs, resource loading, and user actions. |
| If you want to... | Do this |
|---|---|
| Find a specific user's session | Enter a username or user ID in the search box. |
| Filter sessions by specific conditions | Use the Quick Filter panel to set conditions. |
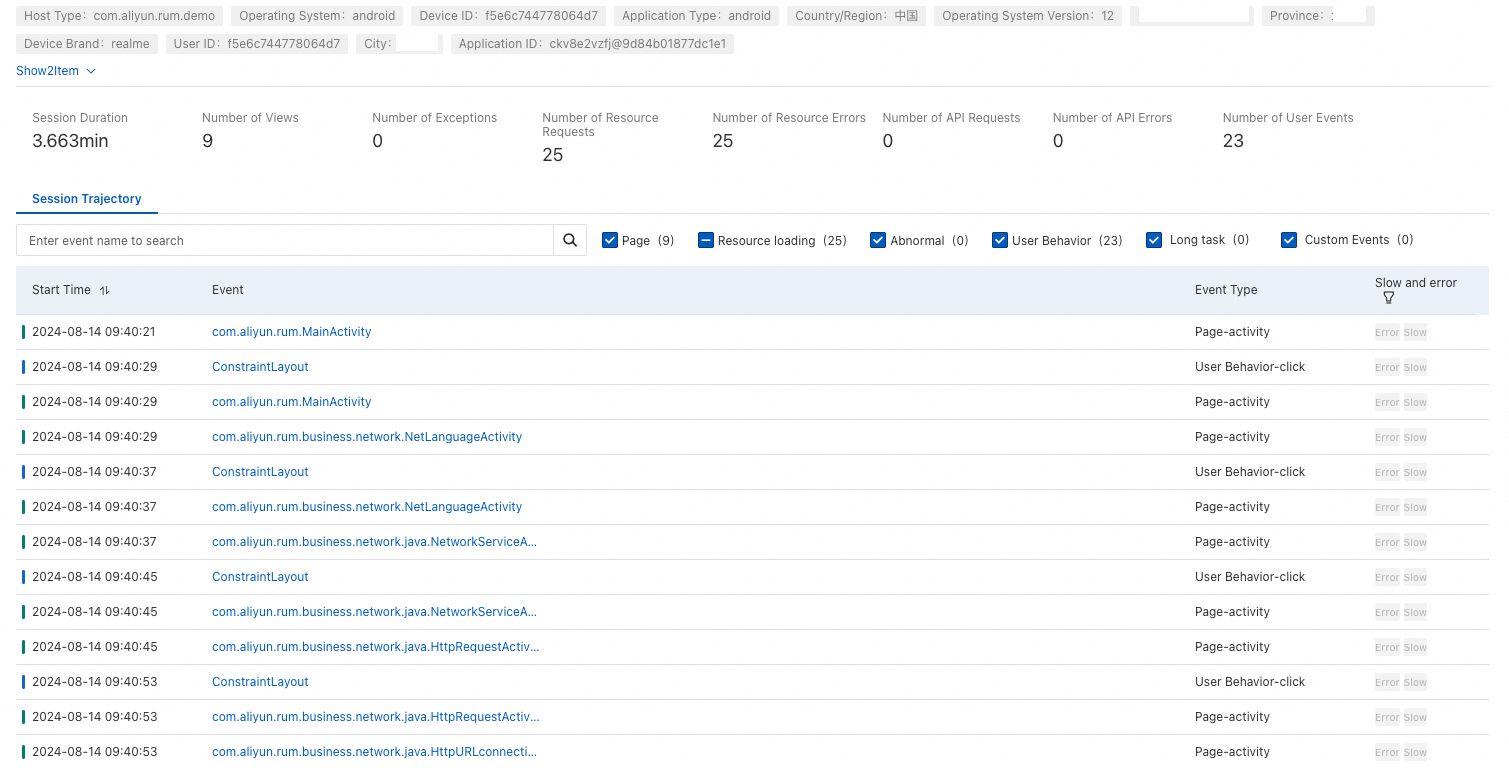
| View crash or exception context | Click a session ID, then review the PVs, resource loading, and user actions timeline. |
PVs tab
The PVs tab tracks page-level performance: view counts, load times, and average dwell time per page. Use it to identify slow-loading or underperforming pages.
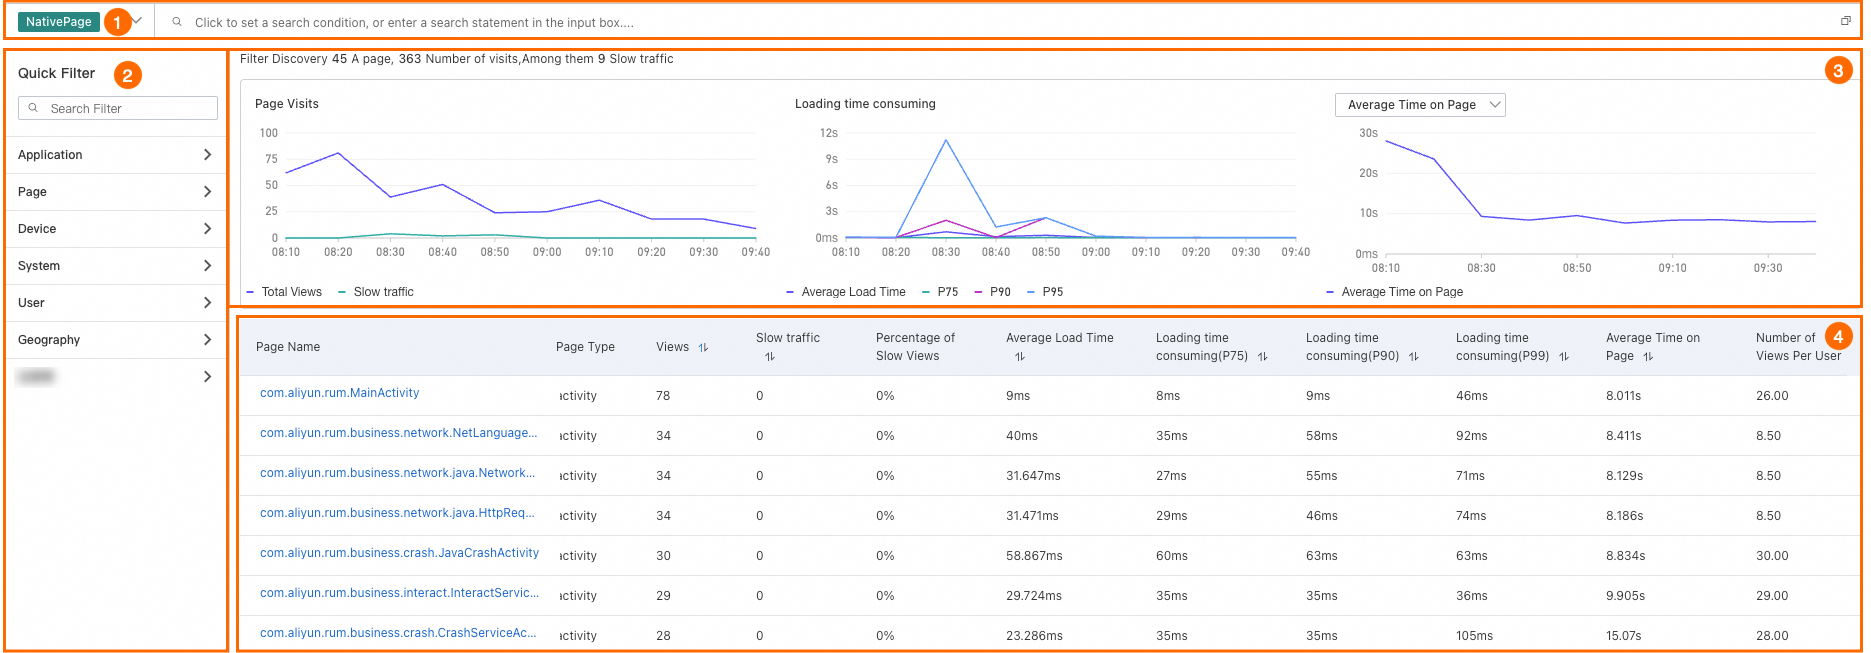
| Section | Purpose |
|---|---|
| Search box (1) | Filter pages by entering a search statement. |
| Quick Filter (2) | Narrow results by specific conditions. Works in conjunction with the search box. |
| Trend charts (3) | Time-series curves for PVs, load time, and average dwell time. Switch Average Time on Page to Number of Views Per User for per-user analysis. |
| Page list (4) | Lists each page with its type, PV count, load time, average dwell time, and average views per user. Click a page name to view its details. |
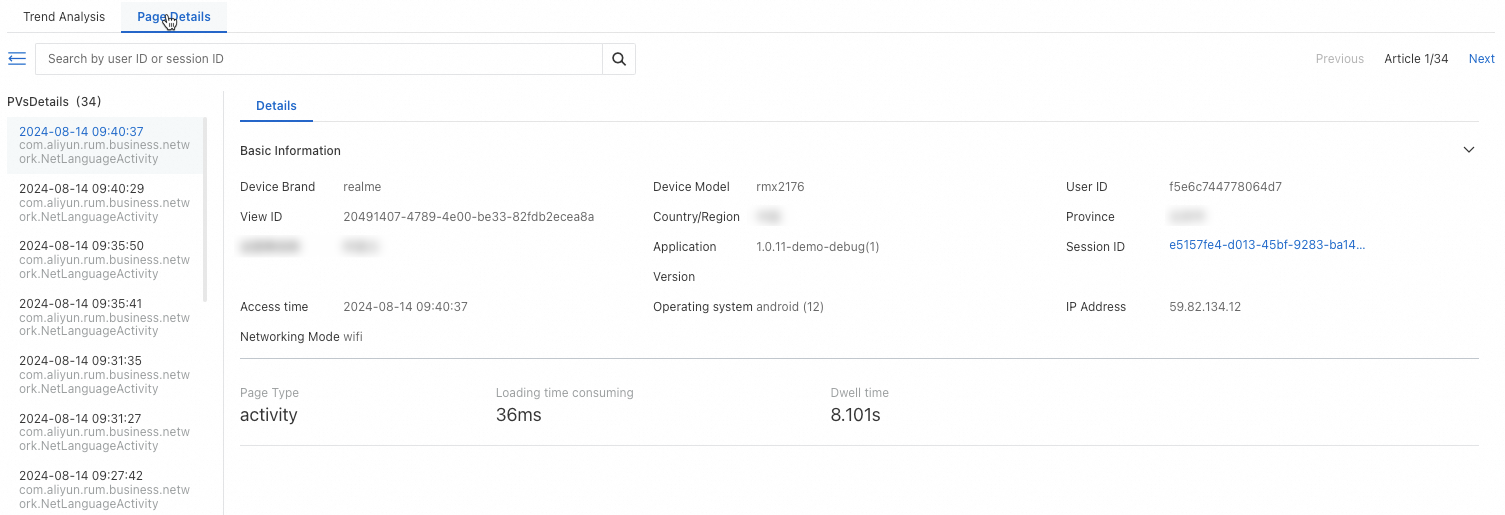
Each page entry drills down into two sub-tabs:
Trend Analysis -- metric trends for the selected page over time.
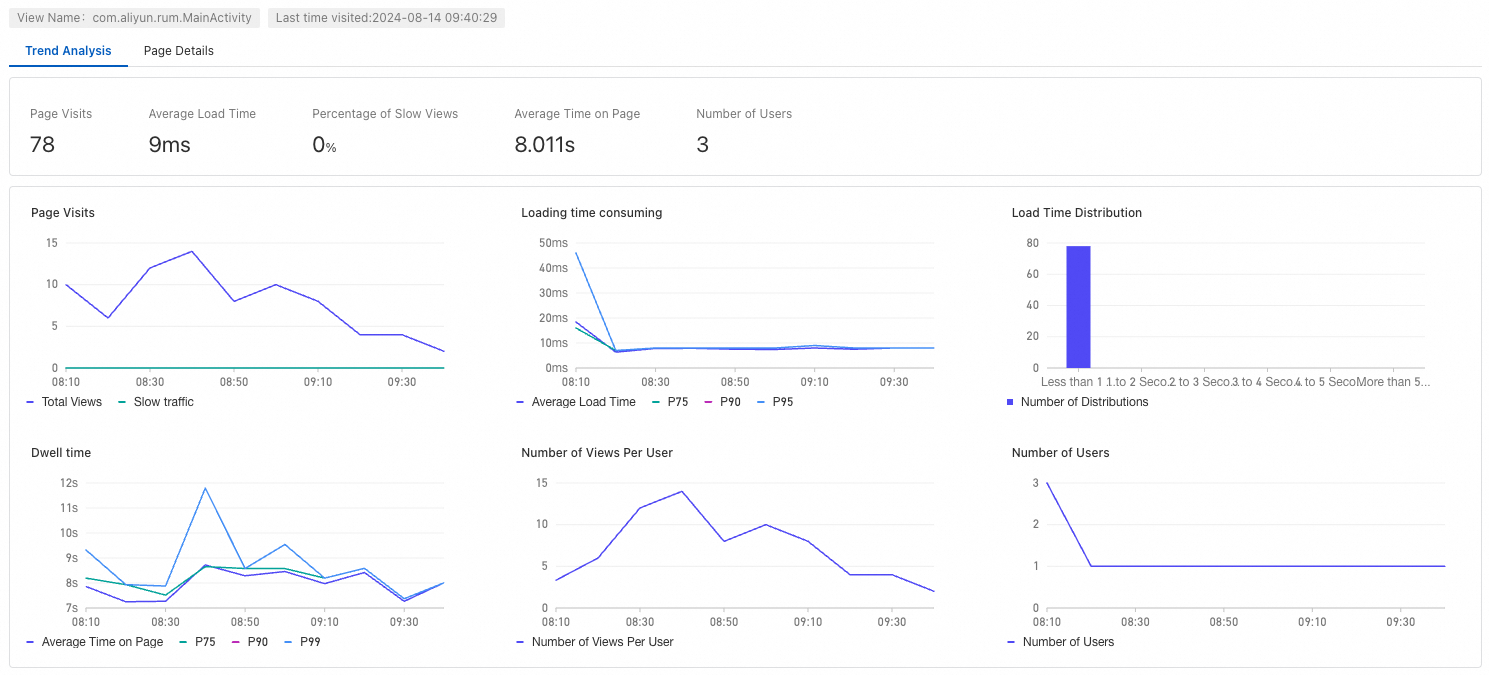
Page Details -- individual PV records with full context.
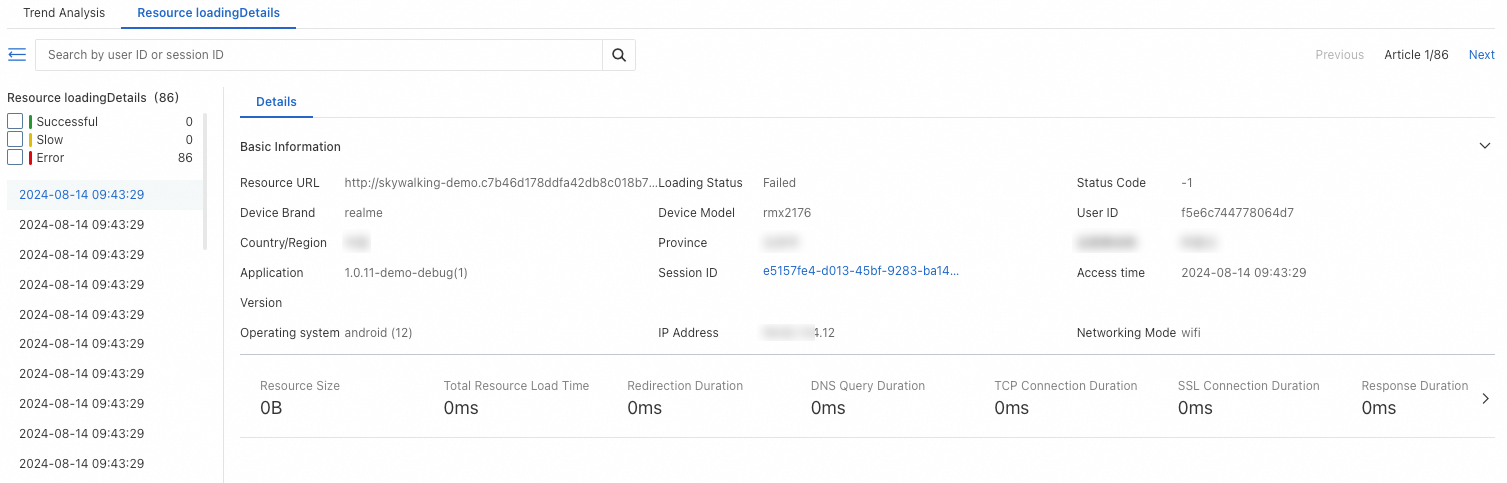
Resource loading tab
The Resource loading tab monitors both API requests and Content Delivery Network (CDN) static resources. It surfaces load counts, error rates, and slow responses to help isolate network and resource issues.
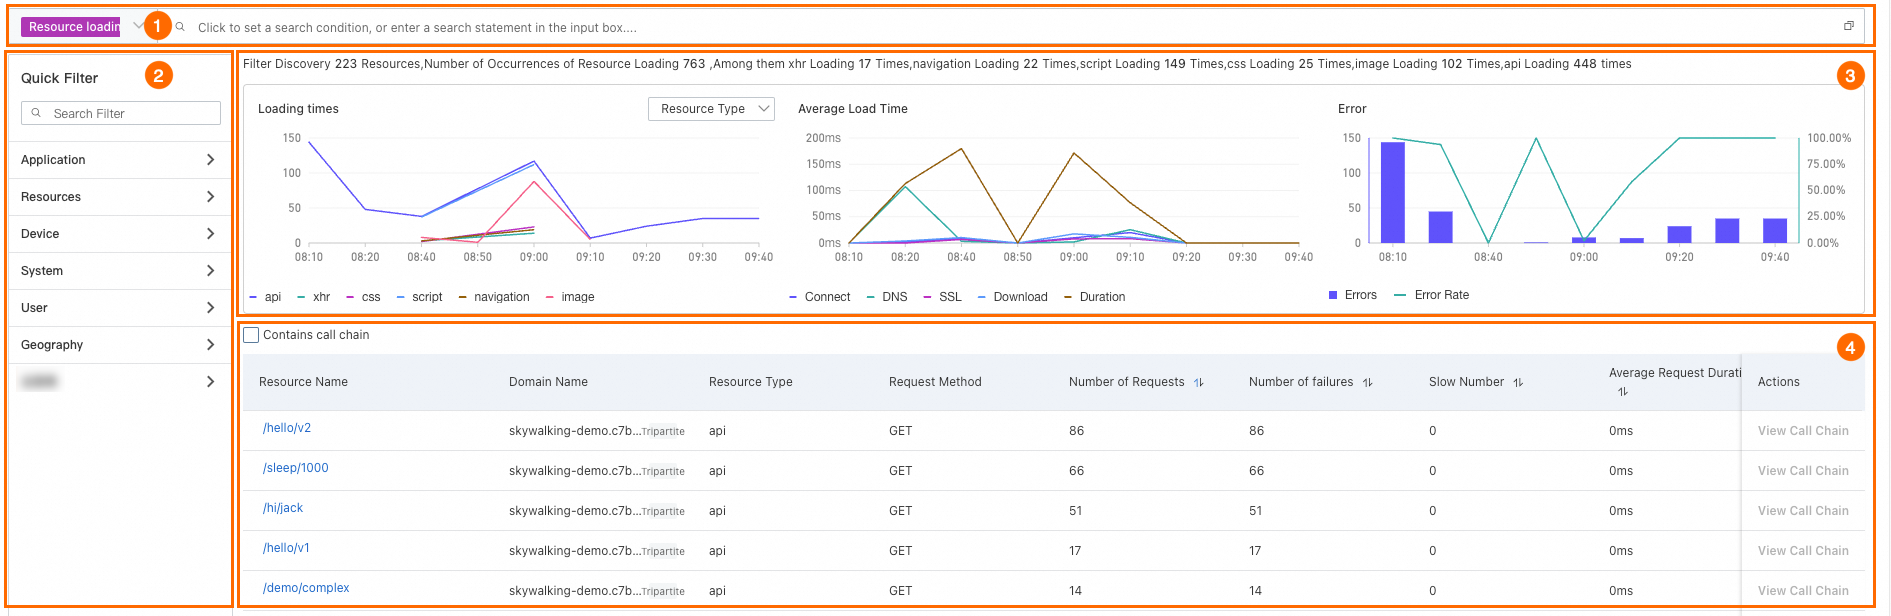
| Section | Purpose |
|---|---|
| Search box (1) | Filter resources by entering a search statement. |
| Quick Filter (2) | Narrow results by specific conditions. Works in conjunction with the search box. |
| Trend charts (3) | Trends for resource load count, average load time, and error count. Results can be grouped by resource type or request method. |
| Resource list (4) | Lists each resource with its type, request method, request count, failure count, slow response count, average request duration, and number of called pages. Click a resource name to view its details. |
Each resource entry drills down into two sub-tabs:
Trend Analysis -- load and error trends for the selected resource over time.
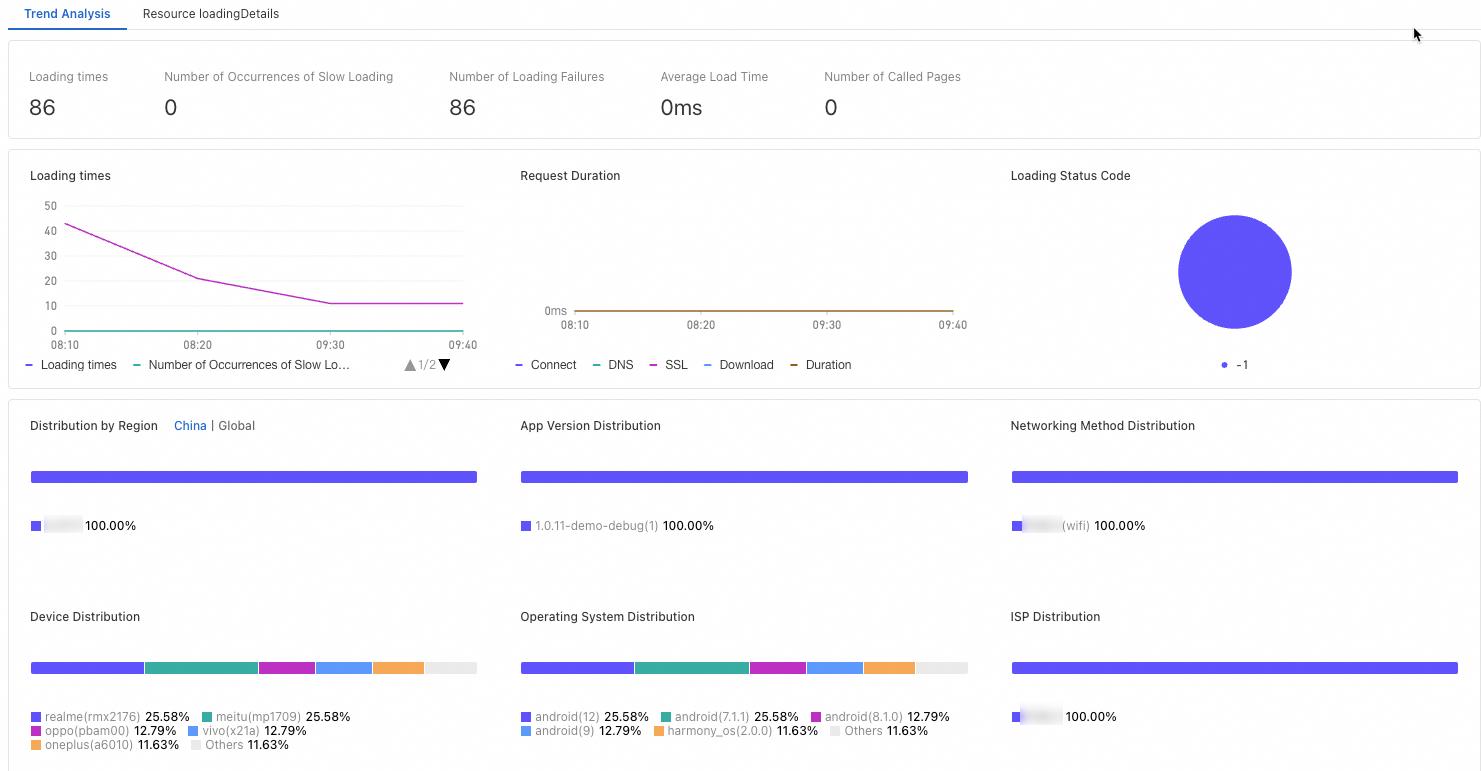
Resource Loading Details -- individual load records with request-level data.
Abnormal statistics tab
The Abnormal statistics tab aggregates exceptions across the application. Use it to assess impact severity by reviewing exception counts, affected pages, users, sessions, and the distribution of exception types.
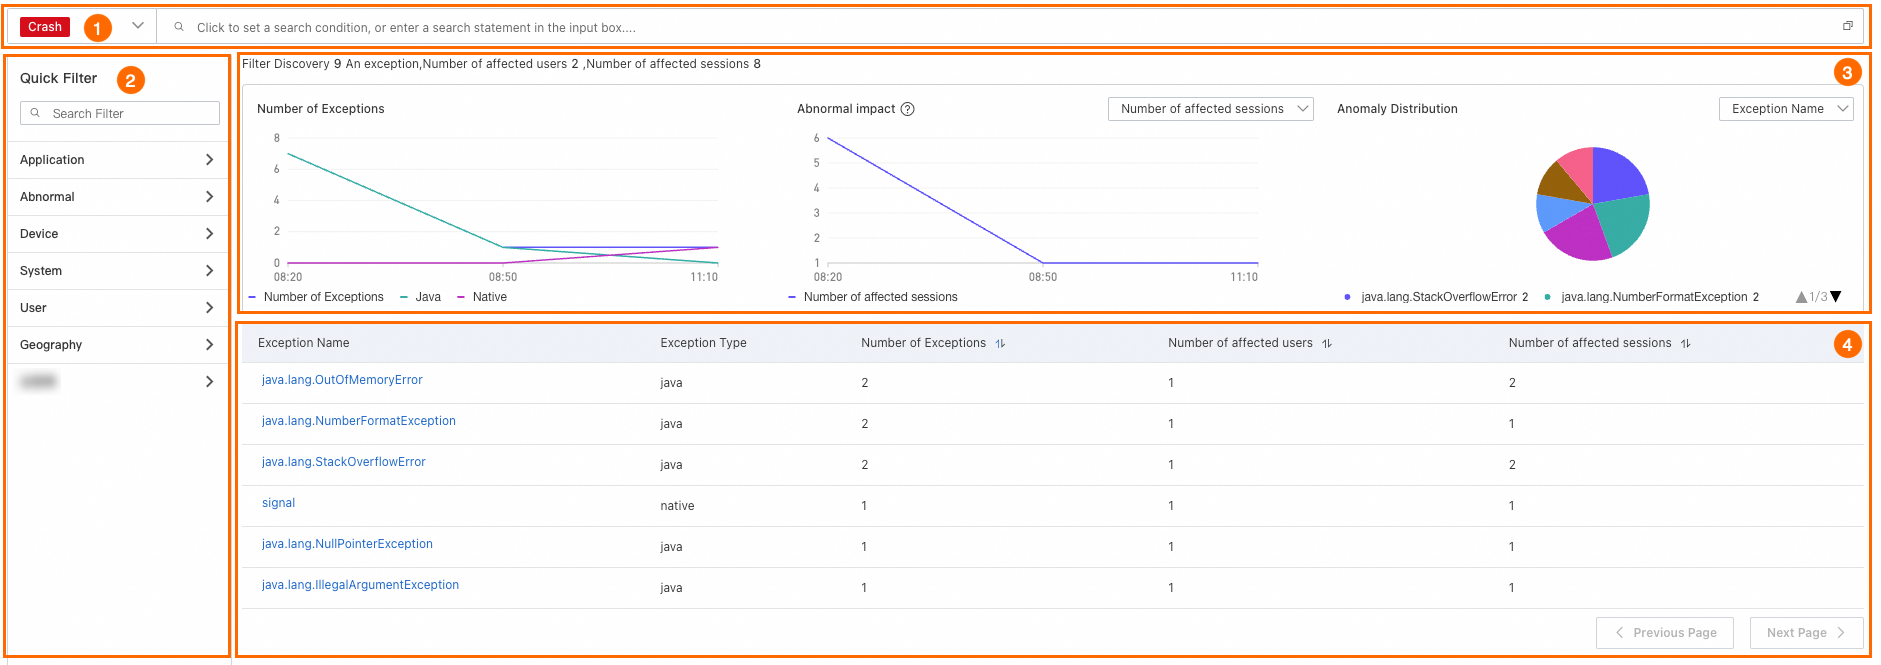
| Section | Purpose |
|---|---|
| Search box (1) | Filter exceptions by entering a search statement. |
| Quick Filter (2) | Narrow results by specific conditions. Works in conjunction with the search box. |
| Trend charts (3) | Exception type breakdown and trends for exception count, affected pages, users, and sessions. |
| Exception list (4) | Lists each exception with its exception information, abnormal files, occurrence count, and the number of affected pages, PVs, users, and sessions. Click an exception name to view its details. |
| If you want to... | Do this |
|---|---|
| Identify the most frequent exception | Sort the exception list by occurrence count. |
| Assess user impact of a specific exception | Check the affected users and sessions columns in the exception list. |
| View error details for a specific exception | Click an exception name to open Exception Details. |
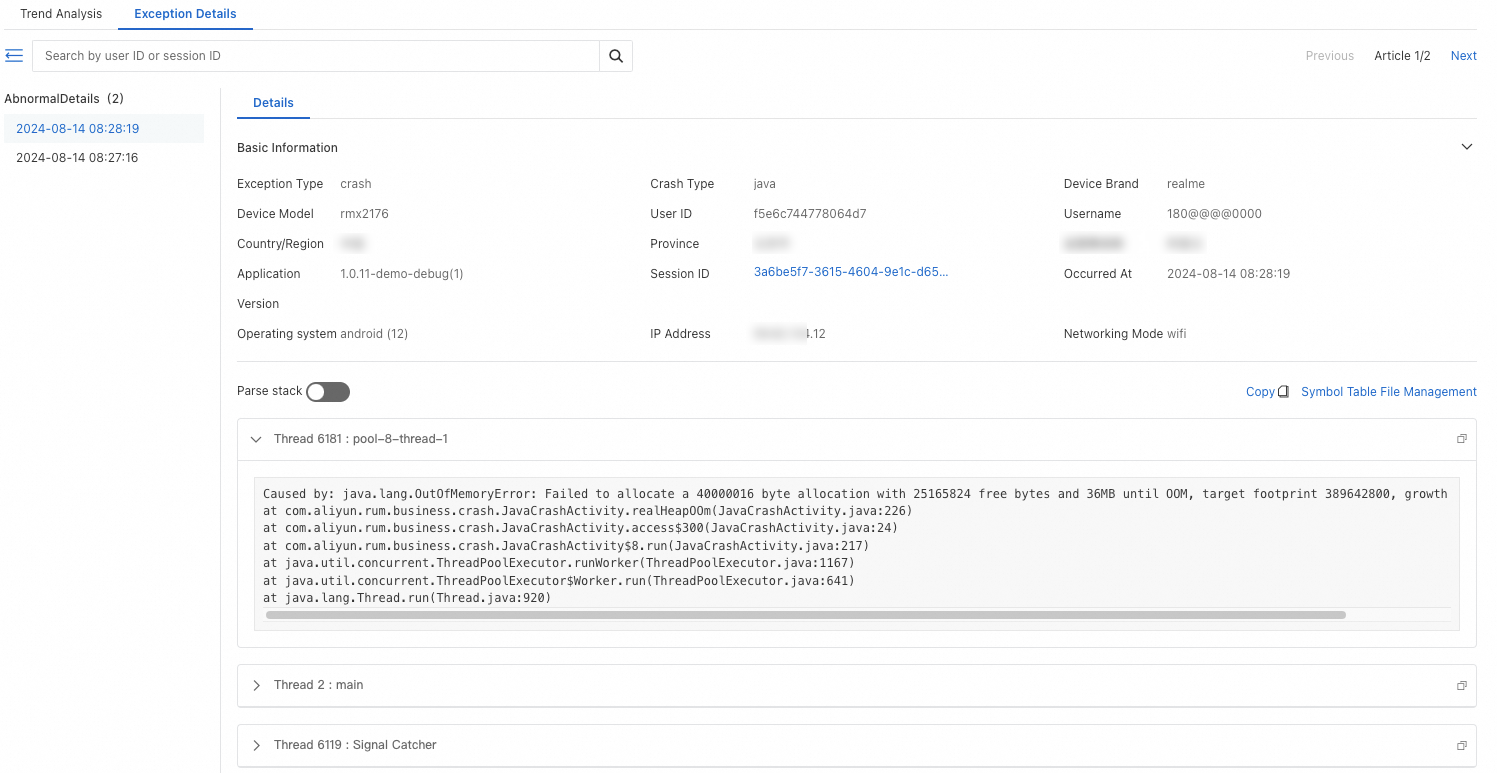
Each exception entry drills down into two sub-tabs:
Trend Analysis -- exception frequency and impact trends over time.
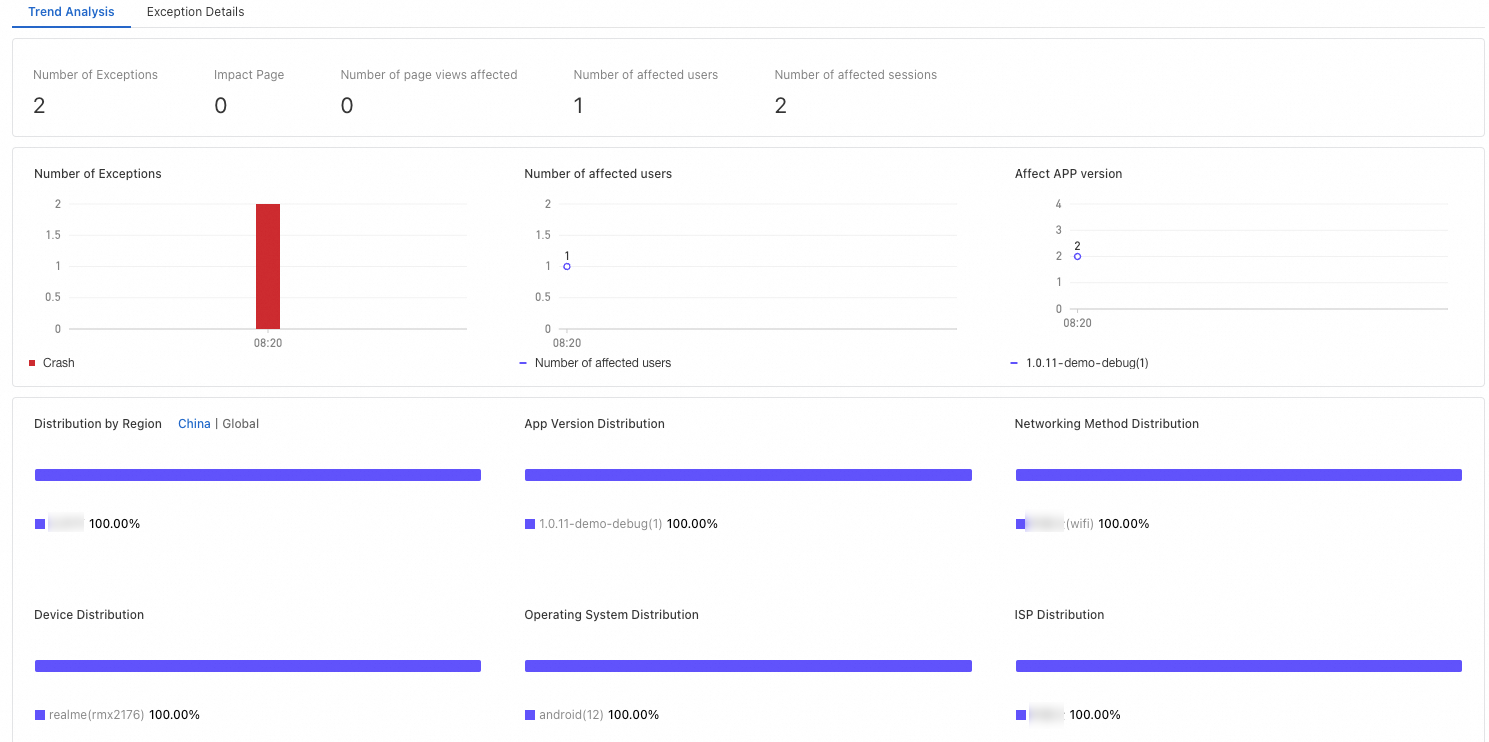
Exception Details -- individual error records with full error details.
What to do next
Use Data exploration to run custom queries, aggregate metrics across dimensions, and trace specific events beyond the predefined views on this page.