After you use SkyWalking to instrument an application and report the trace data to the Managed Service for OpenTelemetry console, Managed Service for OpenTelemetry begins monitoring the application. You can then view various monitoring metrics, including application topology, traces, abnormal transactions, slow transactions, and SQL analysis. This topic walks you through using the SkyWalking NGINX LUA module to automatically instrument and report the trace data from NGINX.
Prerequisites
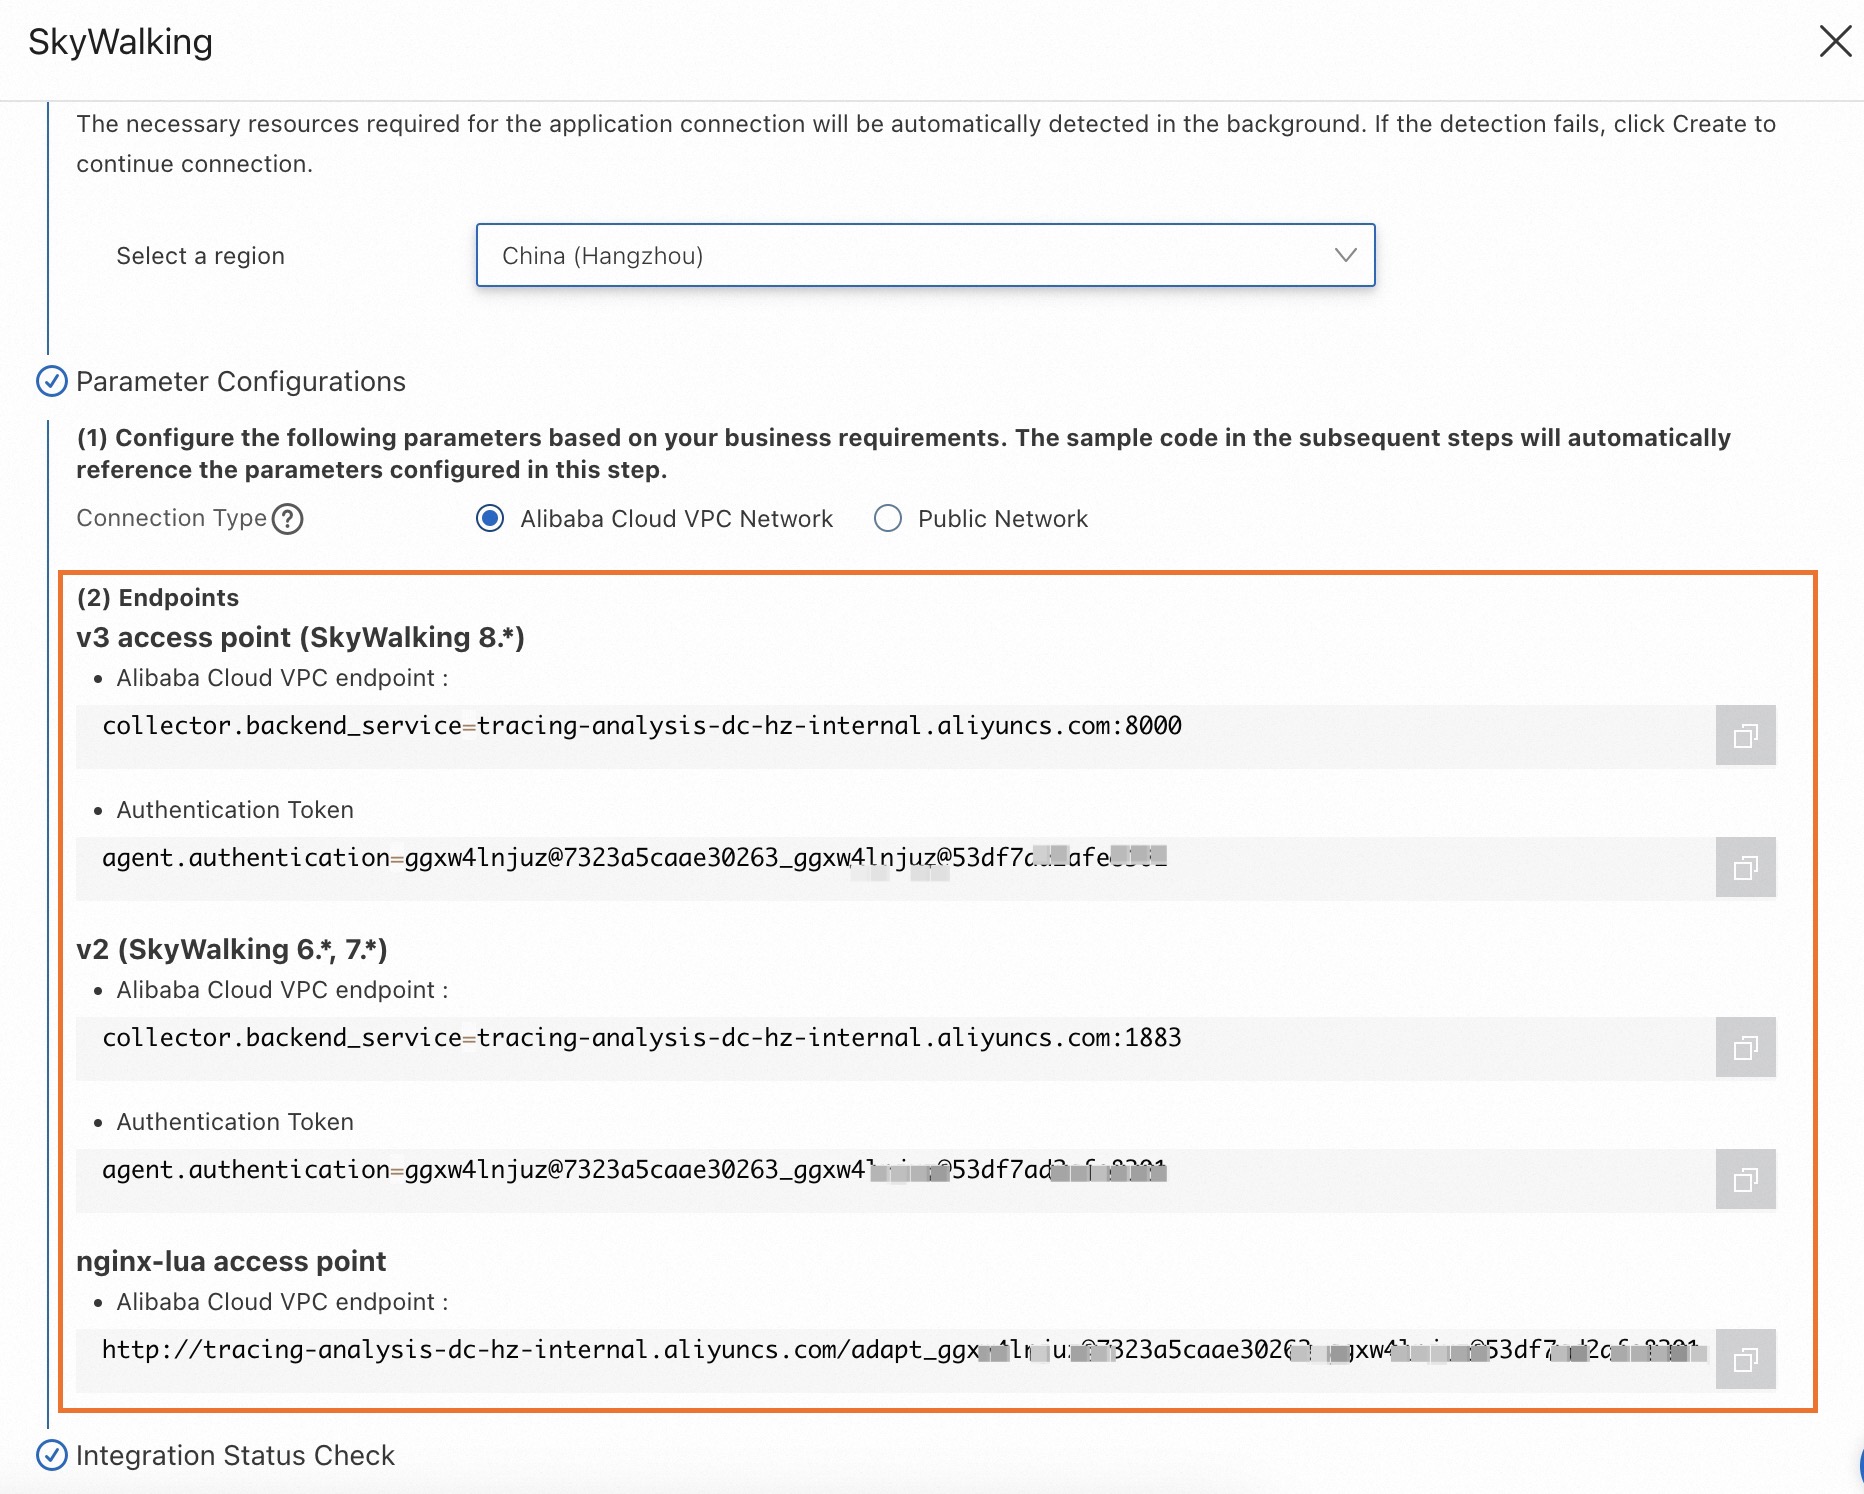
Log on to the ARMS console. In the left-side navigation pane, click Integration Center.
On the Integration Center page, click the SkyWalking card in the Server-side Applications section.
In the SkyWalking panel, click the Start Integration tab, and then select a region in which you want to report data.
NoteWhen you access a region for the first time, resources are automatically initialized there.
Configure the Connection Type parameter and copy an endpoint.
If your service is deployed on Alibaba Cloud and resides in the region that you selected, we recommend that you set this parameter to Alibaba Cloud VPC Network. Otherwise, set this parameter to Public Network.
Background information
SkyWalking is a popular application performance monitoring (APM) service developed in China, for use in microservices, cloud-native architectures, and container-based architectures (including Docker, Kubernetes, and Mesos). SkyWalking is also a distributed tracing system.
Before you can use SkyWalking to report Java application data to the Managed Service for OpenTelemetry console, you must instrument the application. SkyWalking provides auto-instrument agents such as Dubbo, gRPC, JDBC, OkHttp, Spring, Tomcat, Struts, and Jedis. It also allows you to manually instrument applications based on the OpenTracing standard. The following section walks you through setting up automatic instrumentation of an application.
Configuration using a Docker image
Use a pre-built Docker image to configure the SkyWalking NGINX LUA module.
Pull the image from Container Registry.
docker pull registry.cn-hangzhou.aliyuncs.com/public-community/skywalking-nginx-lua:0.2Run NGINX in a Docker container.
docker run --rm -p 80:80 -e "BACKEND_URL=$skywalking-nginx-lua" -d registry.cn-hangzhou.aliyuncs.com/public-community/skywalking-nginx-lua:0.2Replace
$skywalking-nginx-luawith the NGINX LUA endpoint you obtained in the Prerequisites section.Example:
docker run --rm -p 80:80 -e "BACKEND_URL=http://tracing-analysis-dc-hz.aliyuncs.com/skywalking/adapt_123@abc_456@efg/api" -d registry.cn-hangzhou.aliyuncs.com/public-community/skywalking-nginx-lua:0.2Use one of the following methods to go to the NGINX page:
Enter
localhost/nginx.confin the address bar of a browser.Run the
curl "localhost/nginx.conf"command.
Configuration using a Dockerfile
Download the Dockerfile.
wget https://arms-apm.oss-cn-hangzhou.aliyuncs.com/demo/nginx-skywalking-docker.tgz
tar -xzvf nginx-skywalking-docker.tgz
cd nginx-lua
Build the Dockerfile.
docker build --rm --tag skywalking-nginx-lua:0.2 .Run Docker.
docker run --rm -p 80:80 -e "BACKEND_URL=$skywalking-nginx-lua" -d skywalking-nginx-lua:0.2Replace
$skywalking-nginx-luawith the NGINX LUA endpoint you obtained in the Prerequisites section.Example:
docker run --rm -p 80:80 -e "BACKEND_URL=http://tracing-analysis-dc-hz.aliyuncs.com/skywalking/adapt_123@abc_456@efg/api" -d skywalking-nginx-lua:0.2Use one of the following methods to go to the NGINX page:
Enter
localhost/nginx.confin the address bar of a browser.Run the
curl "localhost/nginx.conf"command.
Configuration on an ECS instance
In this example, CentOS 7.0 is installed on the Elastic Compute Service (ECS) instance.
Configure the runtime environment for LUA.
Install the required tools.
yum install gcc gcc-c++ kernel-devel -y
yum install readline-devel -y
yum install ncurses-devel -y
Download and install LUA 5.3.5.
cd /usr/local/src
wget http://www.lua.org/ftp/lua-5.3.5.tar.gz
tar -zxvf lua-5.3.5.tar.gz
cd /usr/local/src/lua-5.3.5 && echo "INSTALL_TOP= /usr/local/lua_5.3.5" >> Makefile && make linux && make install
Download and install LuaRocks. The following code uses LuaRocks V2.2.2 as an example:
cd /usr/local/src
wget https://luarocks.github.io/luarocks/releases/luarocks-2.2.2.tar.gz
tar -xzvf luarocks-2.2.2.tar.gz
cd luarocks-2.2.2
./configure --prefix=/usr/local/luarocks_2.2.2 --with-lua=/usr/local/lua_5.3.5
make build
make install
Add the following lines to the /etc/profile file:
export LUA_HOME=/usr/local/lua_5.3.5
export LUAROCKS_HOME=/usr/local/luarocks_2.2.2
PATH=$PATH:$HOME/bin:$LUAROCKS_HOME/bin:$LUA_HOME/bin
export PATH
export LUA_PATH="$LUAROCKS_HOME/share/lua/5.3/?.lua;?.lua;;"
export LUA_CPATH="$LUAROCKS_HOME/lib/lua/5.3/?.so;?.so;;"
Update the /etc/profile file.
source /etc/profileInstall LUA.
luarocks install luasocket
luarocks install lua-resty-jit-uuid
luarocks install luaunit
luarocks install lua-cjson 2.1.0-1
Verify that LUA is installed.
luarocks list
Download and install OpenResty NGINX.
yum install pcre-devel openssl-devel gcc curl postgresql-devel
cd /usr/local/src
wget -c https://openresty.org/download/openresty-1.15.8.1rc2.tar.gz
tar -zxvf openresty-1.15.8.1rc2.tar.gz
cd openresty-1.15.8.1rc2
./configure --prefix=/usr/local/openresty/ --with-http_stub_status_module --with-luajit --without-http_redis2_module --with-http_iconv_module --with-http_postgres_module --with-stream && gmake && gmake install
export PATH=/usr/local/openresty/nginx/sbin:$PATH
Download and install the SkyWalking NGINX LUA module.
Download and decompress the installation package of the SkyWalking NGINX LUA module. The following code uses skywalking-nginx-lua-1.0.1 as an example:
cd /usr/local/skywalking-nginx-lua
wget https://mirrors.tuna.tsinghua.edu.cn/apache/skywalking/nginx-lua/1.0.1/skywalking-nginx-lua-1.0.1-src.tgz
tar -xzvf skywalking-nginx-lua-1.0.1-src.tgz
Modify the lua_package_path and startBackendTimer variables in the nginx.conf file.
Example:
Set the lua_package_path variable to
/usr/local/skywalking-nginx-lua/lib/?.lua;;.Set the startBackendTimer variable to
require("skywalking.client"):startBackendTimer("http://tracing-analysis-dc-hz.aliyuncs.com/skywalking/adapt_***/api").
Start the SkyWalking NGINX LUA module.
nginx -c /usr/local/skywalking-nginx-lua/examples/nginx.conf
View the results
Log on to the ARMS console. In the left-side navigation pane, choose . On the Applications page, click the name of the application. On the page that appears, view the trace data.
If the  icon is displayed in the Language column, the application is connected to Application Monitoring. If a hyphen (-) is displayed, the application is connected to Managed Service for OpenTelemetry.