Kong Gateway includes a built-in OpenTelemetry plug-in that collects and exports trace data. Enable it with a few configuration changes to start sending traces to Managed Service for OpenTelemetry.
Quick start: Set two environment variables, point the OpenTelemetry plug-in at your endpoint, and restart Kong Gateway:
KONG_TRACING_INSTRUMENTATIONS=all
KONG_TRACING_SAMPLING_RATE=1.0
Then set the plug-in's traces_endpoint (Kong >= 3.8) or endpoint (Kong < 3.8) to your Managed Service for OpenTelemetry HTTP endpoint.
Prerequisites
Get a Managed Service for OpenTelemetry endpoint.
Log on to the ARMS console. In the left-side navigation pane, click Integration Center.
Click the OpenTelemetry card in the Server-side Applications section.
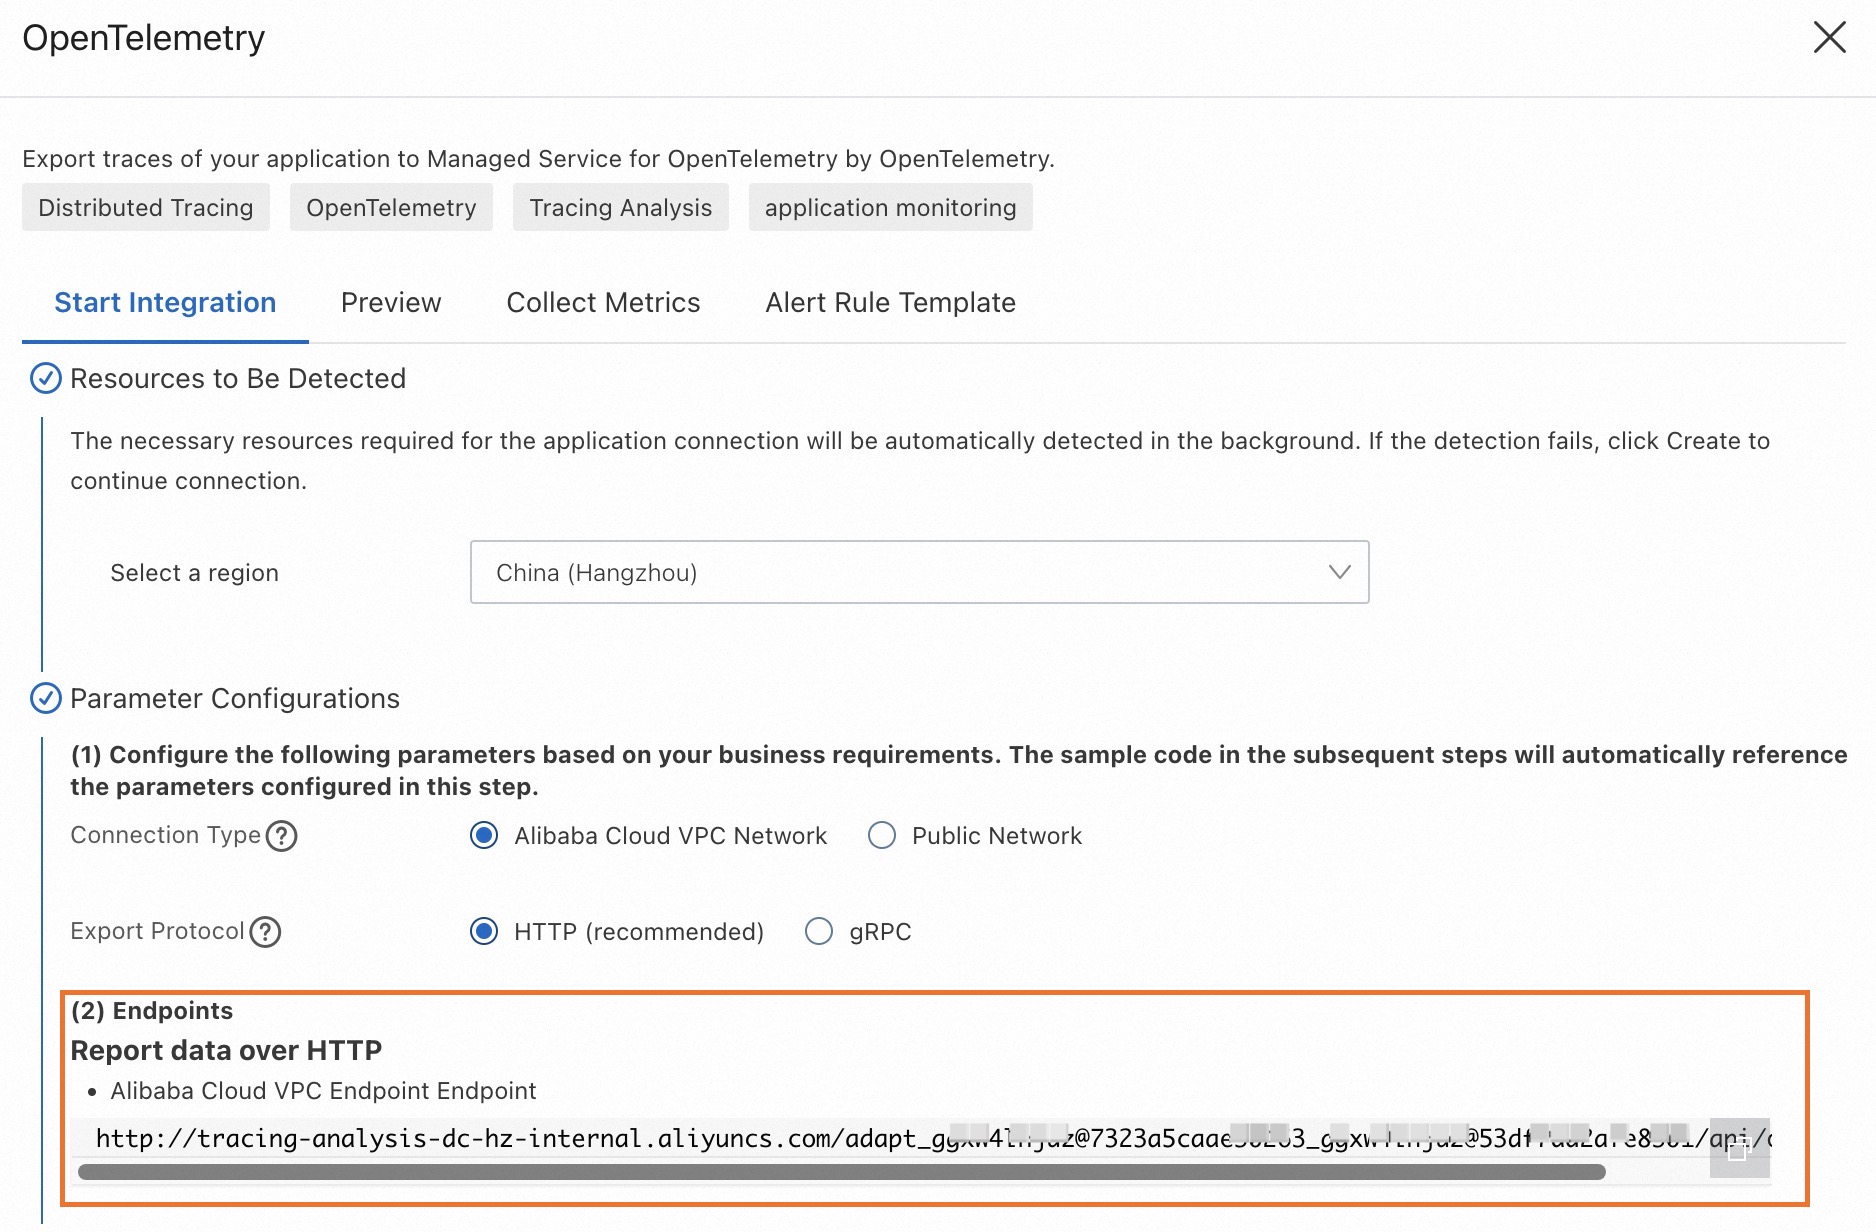
In the OpenTelemetry panel, click the Start Integration tab, and then select a region.
Note Resources are automatically initialized in the region that you access for the first time.Configure the Connection Type and Export Protocol parameters, then copy the endpoint.
Connection Type: If your service runs on Alibaba Cloud in the selected region, select Alibaba Cloud VPC Network. Otherwise, select Public Network.
Export Protocol: Select HTTP (recommended).
Step 1: Enable tracing
Enable tracing in Kong Gateway with either environment variables or the kong.conf file.
Option A: Environment variables
KONG_TRACING_INSTRUMENTATIONS=all
KONG_TRACING_SAMPLING_RATE=1.0
Option B: kong.conf
# kong.conf
tracing_instrumentations = all
tracing_sampling_rate = 1.0| Parameter | Description |
|---|---|
tracing_instrumentations / KONG_TRACING_INSTRUMENTATIONS | Tracing scope. Set to all to trace every phase, or pick specific phases (see Trace types). |
tracing_sampling_rate / KONG_TRACING_SAMPLING_RATE | Sampling rate from 0 (none) to 1.0 (all requests). |
Step 2: Configure the OpenTelemetry plug-in
Replace the following placeholders with your actual values:
| Placeholder | Description | Example |
|---|---|---|
<HTTP_ENDPOINT> | HTTP endpoint from the Prerequisites section | http://tracing-analysis-dc-hk.aliyuncs.com/adapt_xxxxx/api/otlp/traces |
<SERVICE_NAME> | Custom name displayed in the Managed Service for OpenTelemetry console | kong-gateway-prod |
For the full parameter reference, see OpenTelemetry plug-in reference.
Method 1: Declarative configuration (kong.yaml)
Kong Gateway 3.8 or later
# kong.yaml
plugins:
  - name: opentelemetry
    config:
      traces_endpoint: <HTTP_ENDPOINT>
      resource_attributes:
        service.name: <SERVICE_NAME>
Kong Gateway earlier than 3.8
# kong.yaml
plugins:
  - name: opentelemetry
    config:
      endpoint: <HTTP_ENDPOINT>
      resource_attributes:
        service.name: <SERVICE_NAME>
Method 2: Kong Admin API
Kong Gateway 3.8 or later
curl -X POST http://localhost:8001/plugins/ \
    --header "accept: application/json" \
    --header "Content-Type: application/json" \
    --data '
    {
      "name": "opentelemetry",
      "config": {
        "traces_endpoint": "<HTTP_ENDPOINT>",
        "resource_attributes": {
          "service.name": "<SERVICE_NAME>"
        }
      }
    }'
Kong Gateway earlier than 3.8
curl -X POST http://localhost:8001/plugins/ \
    --header "accept: application/json" \
    --header "Content-Type: application/json" \
    --data '
    {
      "name": "opentelemetry",
      "config": {
        "endpoint": "<HTTP_ENDPOINT>",
        "resource_attributes": {
          "service.name": "<SERVICE_NAME>"
        }
      }
    }'
Method 3: Kubernetes (KongClusterPlugin)
apiVersion: configuration.konghq.com/v1
kind: KongClusterPlugin
metadata:
  name: <global-opentelemetry>
  annotations:
    kubernetes.io/ingress.class: kong
  labels:
    global: "true"
config:
  traces_endpoint: <HTTP_ENDPOINT>
  resource_attributes:
    service.name: <SERVICE_NAME>
plugin: opentelemetryStep 3: Validate traces
After configuration, generate traffic and verify that traces appear in the console.
Create a route in Kong Gateway that proxies to a backend service.
Send a test request through Kong Gateway:
curl http://localhost:8000/helloLog on to the Managed Service for OpenTelemetry console.
On the Applications page, find the application named after your
<SERVICE_NAME>value.
On the Trace Explorer page, open a trace to inspect the request duration, client IP address, HTTP status code, and HTTP route.

Step 4 (optional): Advanced configuration
Context propagation format
The Kong OpenTelemetry plug-in defaults to W3C for context propagation. It extracts W3C headers from upstream requests and injects them into downstream requests.
To support additional formats, configure the propagation block. The following example extracts context in order of W3C, b3 (Zipkin), Jaeger, and OpenTracing, then preserves the extracted format when injecting downstream. If no context is found, the plug-in generates a new W3C trace.
# kong.yaml
plugins:
  - name: opentelemetry
    config:
      # ...
      propagation:
        extract: [ w3c, b3, jaeger, ot ]
        inject: [ preserve ]
        default_format: "w3c"
Plug-in scope
The OpenTelemetry plug-in applies globally by default. Narrow the scope to a specific service, route, or consumer by adding the corresponding field:
Service scope
# kong.yaml
plugins:
  - name: opentelemetry
    service: <SERVICE_NAME_OR_ID>
    config:
      traces_endpoint: <HTTP_ENDPOINT>
      resource_attributes:
        service.name: <SERVICE_NAME>
Route scope
# kong.yaml
plugins:
  - name: opentelemetry
    route: <ROUTE_NAME_OR_ID>
    config:
      traces_endpoint: <HTTP_ENDPOINT>
      resource_attributes:
        service.name: <SERVICE_NAME>
Consumer scope
# kong.yaml
plugins:
  - name: opentelemetry
    consumer: <CONSUMER_NAME_OR_ID>
    config:
      traces_endpoint: <HTTP_ENDPOINT>
      resource_attributes:
        service.name: <SERVICE_NAME>
Trace types
Control which types of traces Kong Gateway collects by setting tracing_instrumentations or KONG_TRACING_INSTRUMENTATIONS:
| Value | What it traces |
|---|---|
off | Disables tracing. |
all | All phases listed below. |
request | Incoming requests. |
db_query | Database queries. |
dns_query | DNS queries. |
router | Routers, including router reconnections. |
http_client | OpenResty HTTP client requests. |
balancer | Load-balancing retries. |
plugin_rewrite | Plug-in iterator during the rewrite phase. |
plugin_access | Plug-in iterator during the access phase. |
plugin_header_filter | Plug-in iterator during the header filter phase. |
Limits
Kong Gateway 3.1.x or later.
Tracing supports HTTP and HTTPS only. TCP and UDP are not supported.
The Kong OpenTelemetry plug-in reports trace data over HTTP only. gRPC is not supported.
Tutorial: End-to-end tracing with Kong Gateway and a Node.js backend
This tutorial sets up Kong Gateway and a Node.js backend service with Docker Compose, then reports traces from both services to Managed Service for OpenTelemetry.
Before you begin
Git, Docker, and Docker Compose are installed. Docker version 20.10.0 or later is required.
A Managed Service for OpenTelemetry HTTP endpoint is available (see Prerequisites).
Project structure
docker-kong/compose/
├── docker-compose.yml          # Docker Compose configuration
├── config/
│   └── kong.yaml               # Kong Gateway declarative configuration
└── backend/
    ├── Dockerfile              # Backend service image
    ├── main.js                 # Express application
    ├── package.json
    └── package-lock.json
1. Clone the Kong Docker repository
git clone https://github.com/Kong/docker-kong.git && cd docker-kong/compose2. Create the backend service
Build a Node.js Express application that listens on port 7001 and exposes a /hello endpoint.
Create the application directory:
mkdir backend && cd backendCreate
package.json:cat << EOF > package.json { "name": "backend", "version": "1.0.0", "main": "index.js", "scripts": {}, "keywords": [], "author": "", "license": "ISC", "description": "", "dependencies": { "@opentelemetry/api": "^1.9.0", "@opentelemetry/auto-instrumentations-node": "^0.52.0", "axios": "^1.7.7", "express": "^4.21.1" } } EOFCreate
main.js:cat << EOF > main.js "use strict"; const axios = require("axios").default; const express = require("express"); const app = express(); app.get("/", async (req, res) => { const result = await axios.get("http://localhost:7001/hello"); return res.status(201).send(result.data); }); app.get("/hello", async (req, res) => { console.log("hello world!") res.json({ code: 200, msg: "success" }); }); app.use(express.json()); app.listen(7001, () => { console.log("Listening on http://localhost:7001"); }); EOFCreate the
Dockerfile. Replace<HTTP_ENDPOINT>with the endpoint you obtained in the Prerequisites section.FROM node:20.16.0 WORKDIR /app COPY package*.json ./ RUN npm install COPY . . ENV OTEL_TRACES_EXPORTER="otlp" ENV OTEL_LOGS_EXPORTER=none ENV OTEL_METRICS_EXPORTER=none ENV OTEL_EXPORTER_OTLP_TRACES_ENDPOINT="<HTTP_ENDPOINT>" ENV OTEL_NODE_RESOURCE_DETECTORS="env,host,os" ENV OTEL_SERVICE_NAME="ot-nodejs-demo" ENV NODE_OPTIONS="--require @opentelemetry/auto-instrumentations-node/register" EXPOSE 7001 CMD ["node", "main.js"]
3. Configure Docker Compose
Return to the
composedirectory:cd ..Open
docker-compose.ymland add the tracing environment variables to thekongservice:services: kong: # ... existing configuration ... environment: # ... existing variables ... KONG_TRACING_INSTRUMENTATIONS: all KONG_TRACING_SAMPLING_RATE: 1.0In the same file, add a
backend-apiservice:services: # ... existing services ... backend-api: build: context: ./backend dockerfile: Dockerfile environment: NODE_ENV: production ports: - "7001:7001" networks: - kong-net
4. Configure Kong Gateway routing and the OpenTelemetry plug-in
Go to the
configdirectory:cd configAppend the following to
kong.yaml. Replace<HTTP_ENDPOINT>with the endpoint from the Prerequisites section.cat << EOF >> kong.yaml services: - name: backend-api url: http://backend-api:7001 routes: - name: main-route paths: - /hello plugins: - name: opentelemetry config: traces_endpoint: <HTTP_ENDPOINT> headers: X-Auth-Token: secret-token resource_attributes: service.name: kong-dev EOF
5. Start the services
Return to the compose directory and start all containers:
cd ..
docker compose up -d
6. Validate
Send a request through Kong Gateway:
curl http://localhost:8000/helloExpected output:
{"code":200,"msg":"success"}Log on to the Managed Service for OpenTelemetry console and check the Applications page. You should see two applications:
kong-dev -- the Kong Gateway application
ot-nodejs-demo -- the Node.js backend service
Open a trace on the Trace Explorer page to view the full request path from Kong Gateway to the backend.
7. Clean up
Stop and remove the containers when you no longer need them:
docker compose downFAQ
No traces appear in the Managed Service for OpenTelemetry console after enabling the plug-in
Set the log level to debug and check whether Kong Gateway generates traces:
Environment variable:
KONG_LOG_LEVEL=debugConfiguration file: add
log_level=debugtokong.conf
Send a request to Kong Gateway and check whether the generated logs contain the Kong trace.
Kong Gateway traces are not linked with traces from other services
Check whether all services use the same propagation format. Kong Gateway defaults to W3C. If another service uses b3 (Zipkin) or Jaeger, configure the Kong OpenTelemetry plug-in to extract the matching format. See Context propagation format.
Does the OpenTelemetry plug-in affect Kong Gateway performance?
Enabling the plug-in adds overhead for span collection and export. To reduce the impact in production:
Lower the sampling rate (for example,
0.1to sample 10% of requests).Tune the plug-in's batch size, retry count, and retry interval. For details, see Kong OpenTelemetry configuration.