The Deployment dashboard and the Pod dashboard use different Prometheus query mechanisms. This difference determines whether monitoring data for deleted pods remains visible.
The Deployment dashboard uses
label_values()to query historical label data. After a pod is deleted, its name stays in the Pod drop-down list for up to three days, and its monitoring data remains accessible through time range filters.The Pod dashboard uses
query_result()to evaluate a live PromQL expression. It returns only running pods, so deleted pods disappear within five minutes.
How the query mechanisms differ
Each dashboard populates its Pod drop-down list with a different Prometheus template variable function:
| Deployment dashboard | Pod dashboard | |
|---|---|---|
| Query function | label_values() -- returns all stored label values for a metric, including values from deleted pods | query_result() -- evaluates a PromQL expression and returns only current results |
| Default query | label_values(kube_pod_info{namespace=~'$namespace'} ,pod) | query_result(kube_pod_info{namespace=~'$namespace'} >0) |
| Filter conditions | Namespace and Deployment | Namespace only |
| Deleted pod visibility | Pod name visible for up to 3 days; monitoring data accessible by time range after that | Deleted pods disappear within 5 minutes |
Why label_values retains deleted pod data
label_values() retrieves every known value for a specified label within the metric's retention window. When a pod is deleted, the kube_pod_info metric data is not removed immediately -- the label values remain queryable for up to three days. After that, the pod name no longer appears in the Pod drop-down list, but you can still view monitoring data by selecting a time range that covers the pod's active period.
Why query_result excludes deleted pods
query_result() evaluates a PromQL expression at query time and returns only results that satisfy the expression. The default expression kube_pod_info{namespace=~'$namespace'} >0 matches only actively running pods. When a pod is deleted, it no longer meets the >0 condition and disappears from the Pod drop-down list within approximately five minutes.
The Pod dashboard also supports only namespace-level filtering. Without a Deployment-level filter, locating a specific deleted pod among all namespace pods would be impractical. For this reason, the Pod dashboard does not support historical data queries.
View historical data for deleted pods
To view monitoring data for a deleted pod, use the Deployment dashboard:
Open the Deployment dashboard in the ARMS console.
Select the target namespace and Deployment.
If the pod was deleted within the last three days, select it from the Pod drop-down list.
If more than three days have passed, the pod name no longer appears in the drop-down list. Adjust the time range to cover the period when the pod was active. The charts display monitoring data for all pods under that Deployment, including deleted ones.
Example
In this example, two pods -- one suffixed with hxv and one suffixed with wcc -- have been deleted.
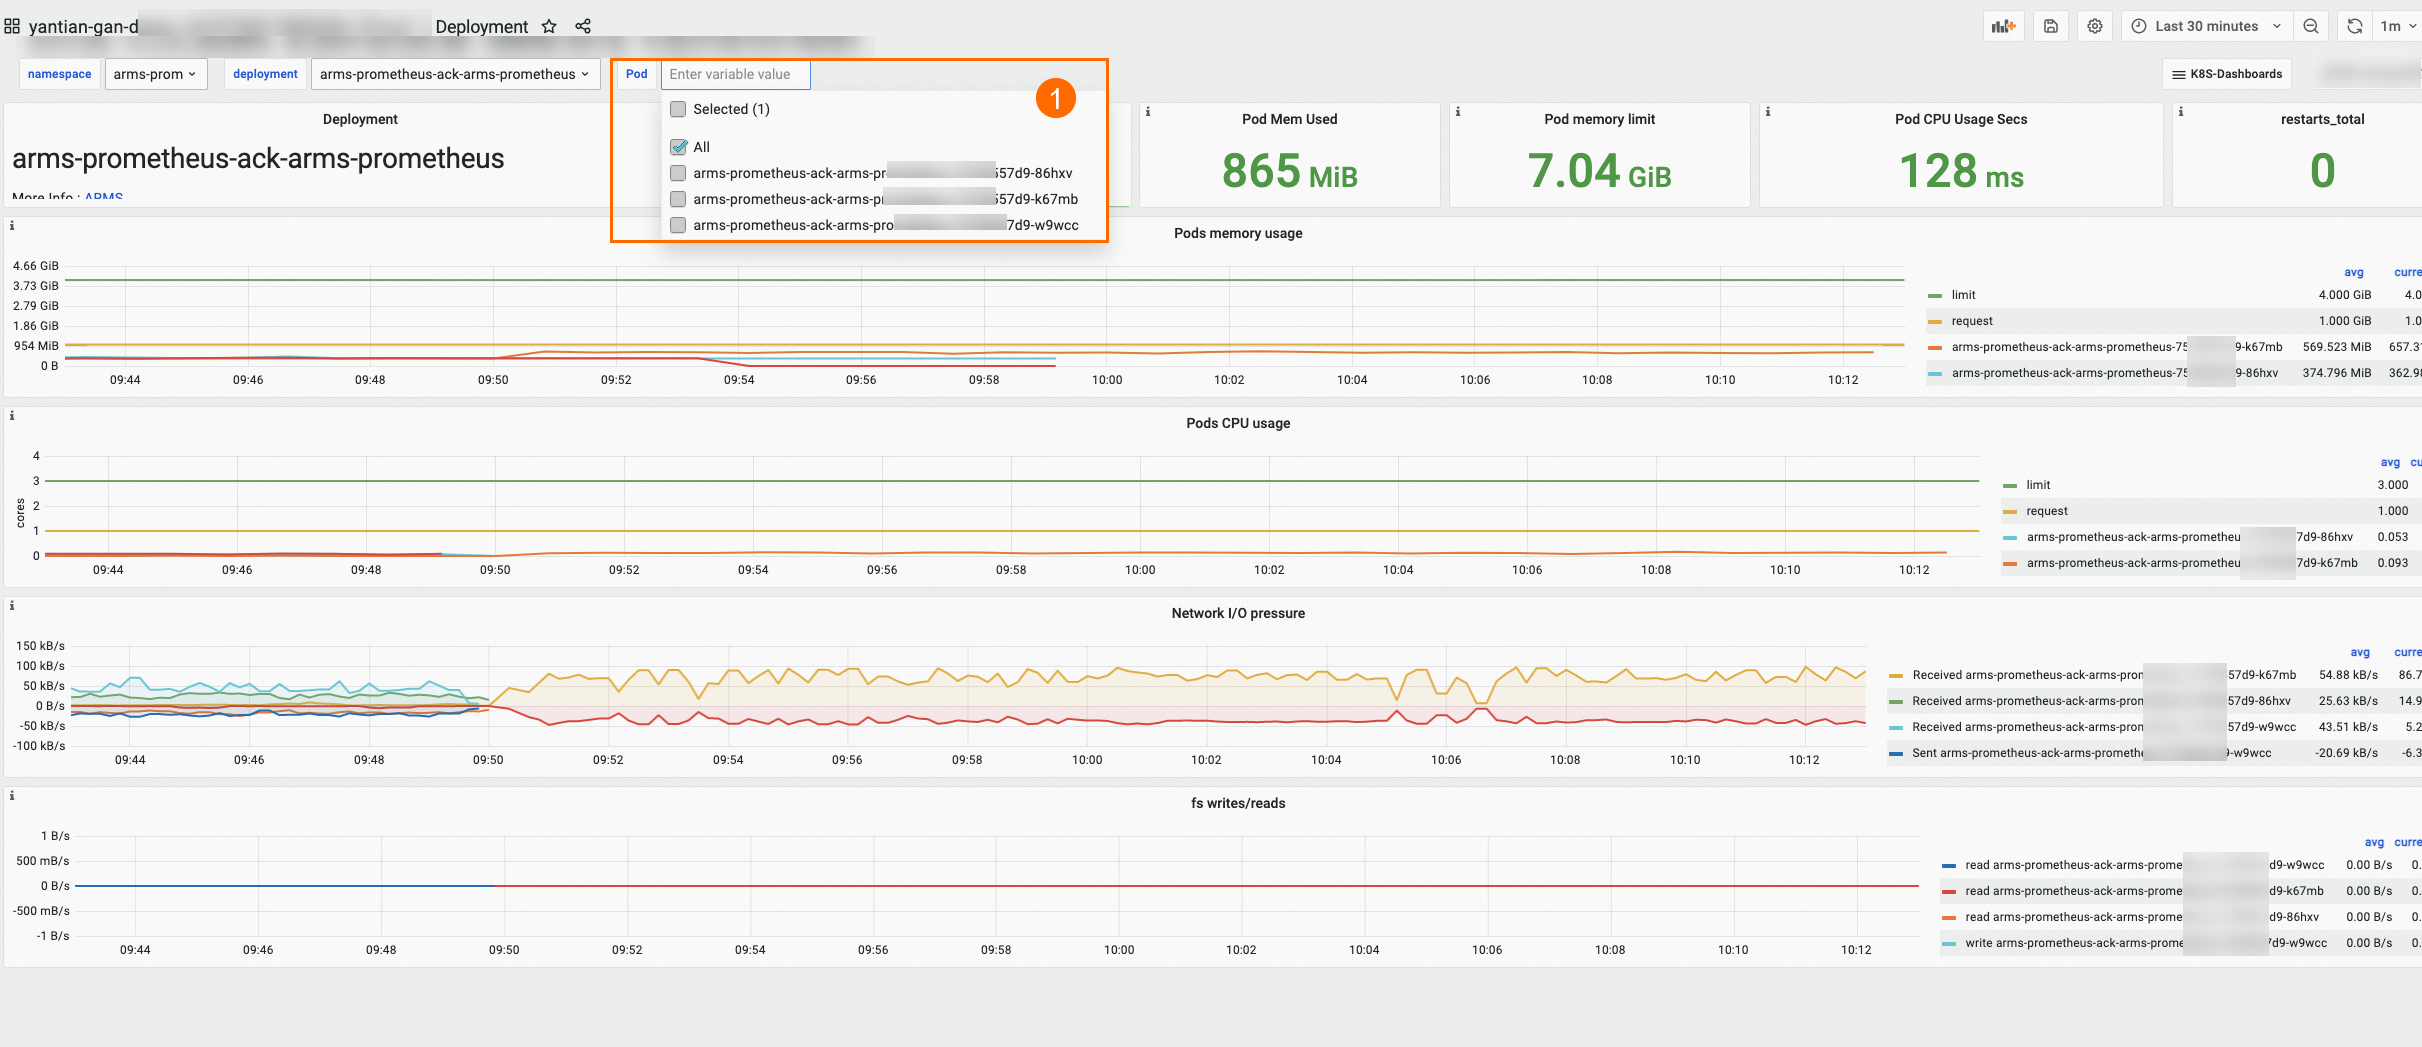
Deployment dashboard: Both pods still appear in the monitoring charts. Their names remain in the Pod drop-down list (Icon 1) for up to three business days after deletion.
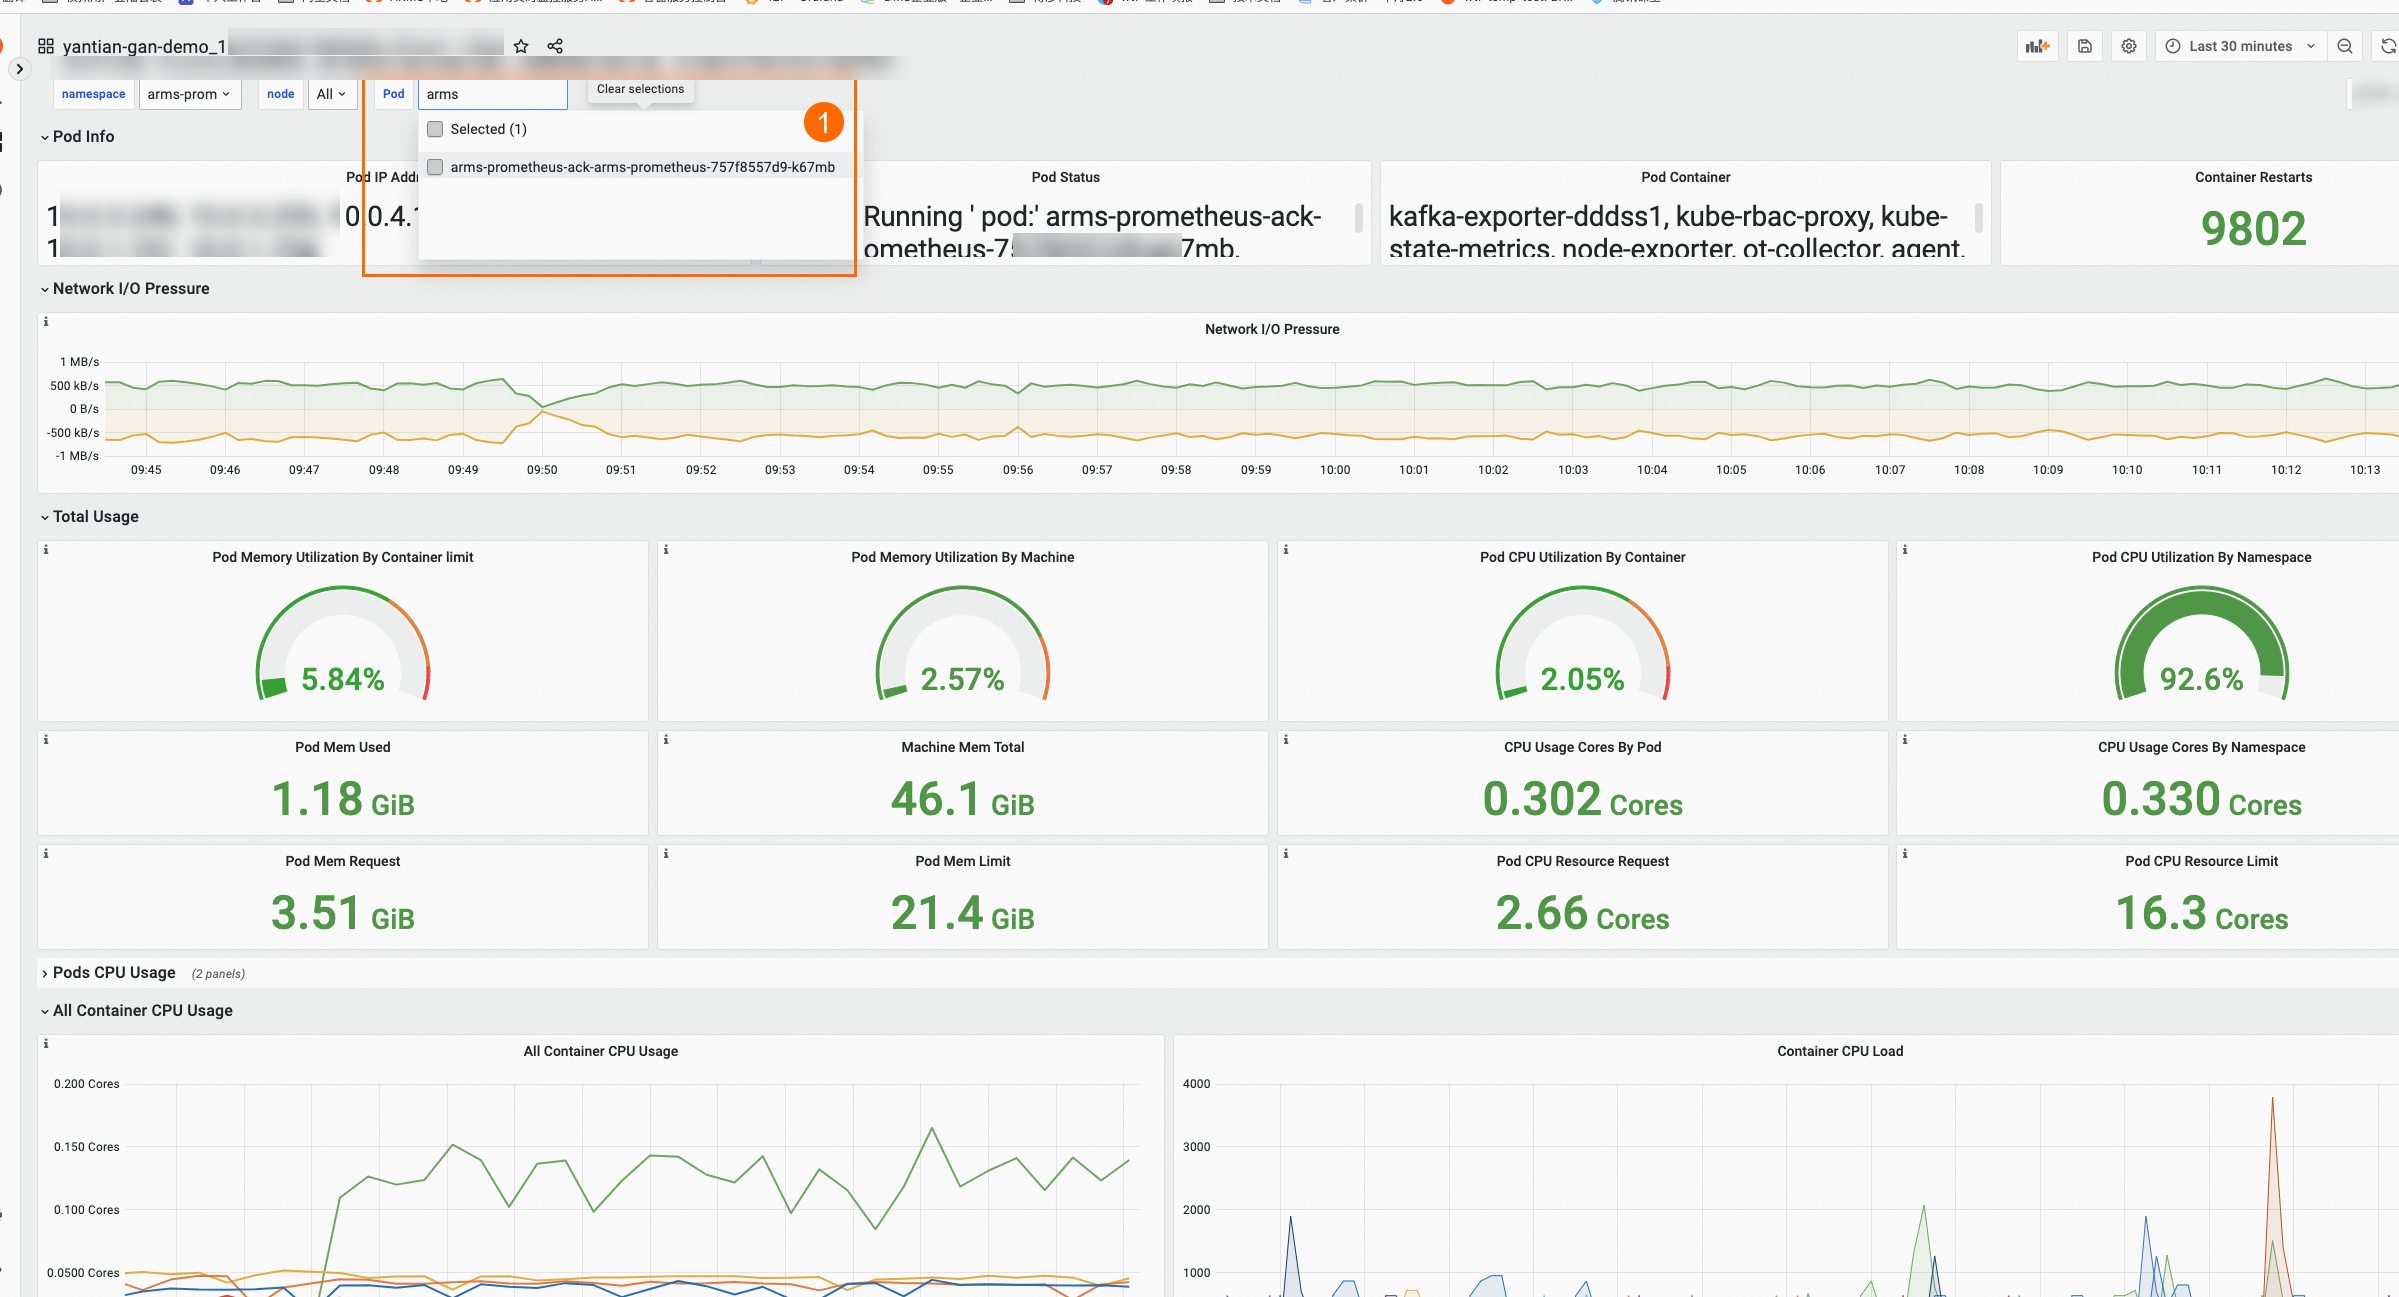
Pod dashboard: Both pods disappear from the Pod drop-down list (Icon 1) within five minutes of deletion. Their historical monitoring data is no longer accessible from this dashboard.