When you run Windows workloads on Elastic Compute Service (ECS), you need visibility into CPU, memory, disk, and network performance. Managed Service for Prometheus collects these system metrics through Windows Exporter, an open-source agent that runs on the instance and exposes Prometheus-format metrics. After you enable the Windows integration in the Application Real-Time Monitoring Service (ARMS) console, pre-built dashboards and alert rules become available without additional configuration.
How it works
Windows Exporter runs on the ECS instance and exposes system metrics on an HTTP port (default:
9182).The Windows component in ARMS discovers the instance and scrapes metrics at a configured interval.
Pre-built dashboards in the ARMS console visualize CPU, memory, disk, and network data.
Prerequisites
Before you begin, make sure that you have:
An ECS instance running Windows Server, deployed in a virtual private cloud (VPC)
Administrator access to the Windows instance
Access to the ARMS console
Step 1: (Optional) Install Windows Exporter
ARMS supports two deployment methods. If you prefer automatic installation, skip this step and go to Step 2. The system installs the exporter for you based on service discovery rules.
| Method | When to use |
|---|---|
| Automatic (recommended) | Let ARMS install and configure the exporter based on service discovery conditions. No manual setup required. |
| Manual | Install the exporter yourself when you need to control the configuration before connecting to ARMS. |
To install Windows Exporter manually:
Log on to the ECS instance as an administrator.
Download the Windows Exporter installation package (
windows_exporter-1.22.0-amd64.msi).Install the exporter. Double-click the
.msifile, or run the following command: The following table lists the MSI installer parameters you can use for automated or customized installations: For example, to install with a custom port and specific collectors:Parameter Description Default value ENABLED_COLLECTORSComma-separated list of metric collectors to enable cpu, cpu_info, memory, process, tcp, cs, logical_disk, net, os, system, textfile, time LISTEN_PORTPort that the exporter listens on 9182LISTEN_ADDRIP address to bind to Empty (all local addresses) METRICS_PATHHTTP path at which metrics are served /metricsTEXTFILE_DIRSDirectories containing custom textfile collector files None CONFIG_FILEPath to a YAML configuration file None Installation directory -- C:\Program Files (x86)\windows_exportermsiexec /i windows_exporter-1.22.0-amd64.msimsiexec /i windows_exporter-1.22.0-amd64.msi LISTEN_PORT="9183" ENABLED_COLLECTORS="cpu,memory,logical_disk,net,os,system"Verify that the exporter is running. Open a browser or run the following command, and confirm that Prometheus-format metrics are returned: A successful response looks similar to the following output: You can also open Windows Console (Services) and confirm that the windows_exporter service is in the Running state.
curl localhost:9182/metrics# HELP windows_os_info OperatingSystem.Caption, OperatingSystem.Version # TYPE windows_os_info gauge windows_os_info{product="Windows Server 2019 Datacenter",version="10.0.17763"} 1 # HELP windows_cpu_time_total Time that processor spent in different modes (dpc, idle, interrupt, privileged, user) # TYPE windows_cpu_time_total counter windows_cpu_time_total{core="0,0",mode="dpc"} 4.421875 ...(Optional) Customize the configuration. Edit the
config.ymlfile to change the port or modify which collectors are enabled. For the full list of configuration options, see the Windows Exporter documentation. After saving your changes, restart the service:sc stop windows_exporter && sc start windows_exporter
Step 2: Enable the Windows component
Log on to the Application Real-Time Monitoring Service (ARMS) console.
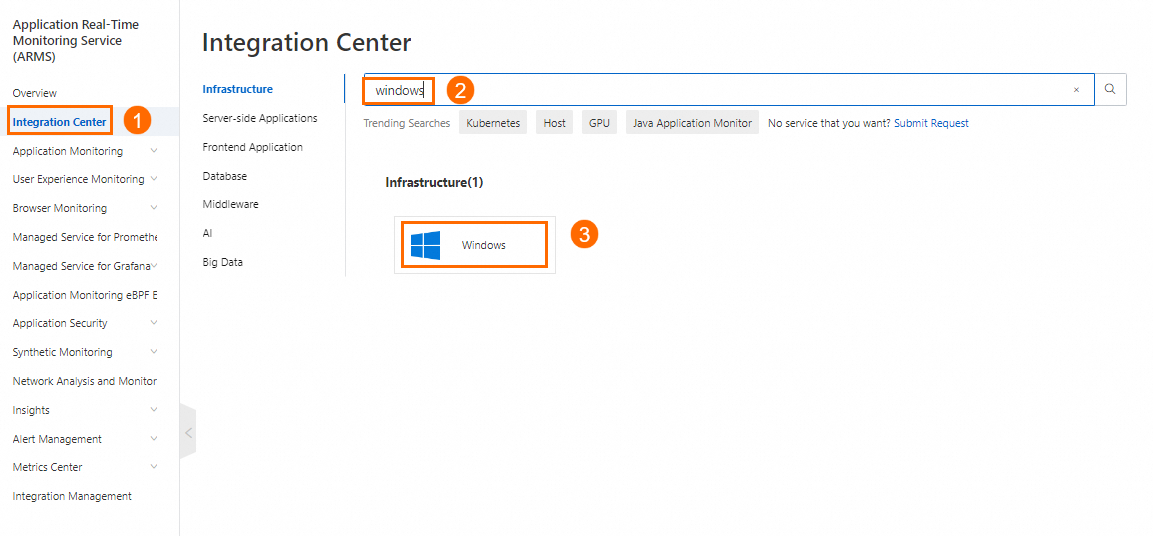
In the left-side navigation pane, click Integration Center.
Search for Windows and click the component to open it.
On the Start Integration tab, configure the following parameters and click OK.
Parameter Description Select the environment type The environment where Windows is running. Valid value: ECS(VPC). WindowsExporter Installation Mode How to deploy the exporter. Select Automatic Installation to let ARMS install and manage the exporter, or Self Installation if you already installed it in Step 1. Host Service Discovery Mode How ARMS discovers target instances. Options: Unconditional (Select all Windows instances in the current VPC), Stain Label Selection, Tag Label Selection, IP CIDR, or Instance ID. Collect TextFile The absolute path to a directory containing textfile collector files. Environment variables are not supported. Example: /home/app/textfiles.Windows-Exporter Service port The port that Windows Exporter listens on. The default value ( 9182) is filled in automatically.Security Groups Are Automatically Configured When enabled, ARMS checks the security group of the ECS instance to verify that the exporter port is accessible over the VPC, and automatically adds inbound rules if needed. Custom ECS Tag Injection Tag keys from the ECS instance to inject into scraped metrics as label key-value pairs. Metric Scrape interval (unit/second) How often ARMS scrapes metrics from the exporter. Default: 15seconds.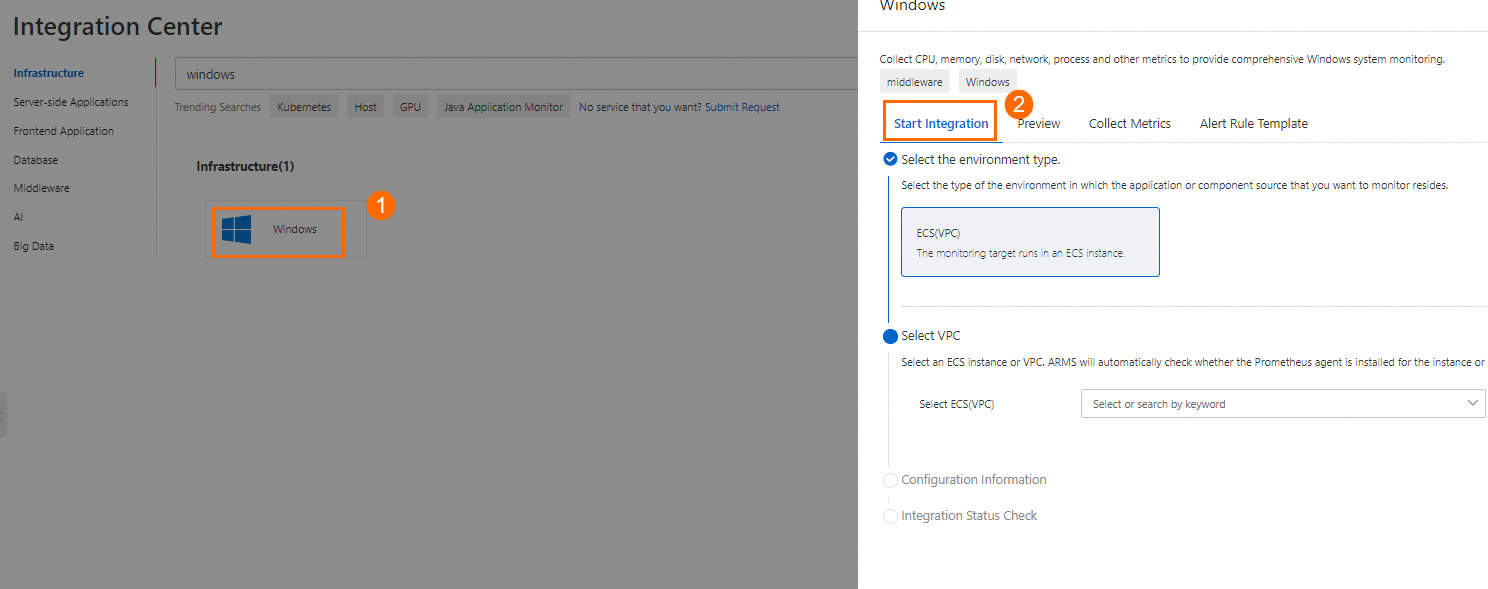
Step 3: View Windows dashboards
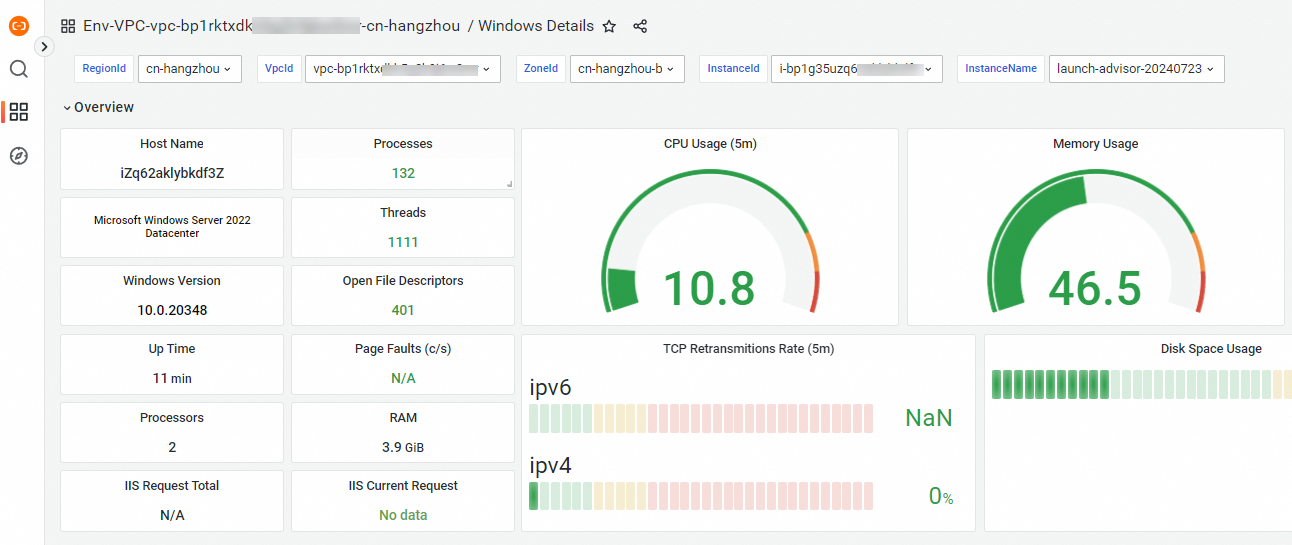
After the integration is enabled, ARMS creates pre-built dashboards for the monitored instance.
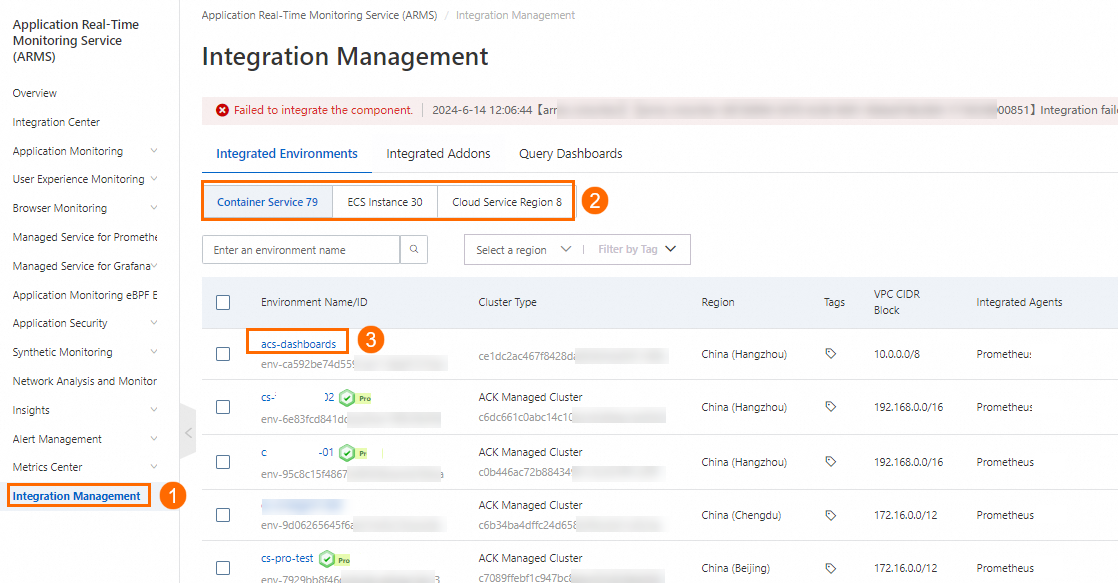
In the left-side navigation pane of the ARMS console, click Integration Management.
On the Integrated Environments tab, click the name of your ECS instance.
On the Component Management tab, in the Addon Type section, click Windows, then click Dashboards to see all available dashboard names.
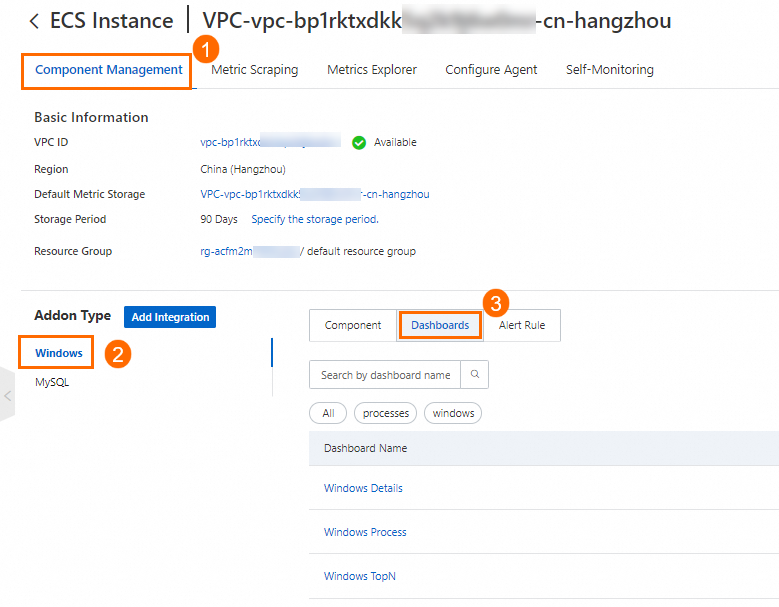
Click a dashboard name to open it.
Step 4: Configure alerting
After dashboards are available, set up alert rules to get notified when metrics cross thresholds such as high CPU usage, low available memory, or disk space running low.
For instructions, see Create an alert rule for a Prometheus instance.
Default metric collectors
The following table lists the metric collectors enabled by default when Windows Exporter is installed through ARMS. Each collector exposes a group of related Prometheus metrics.
| Collector | Description | Example metrics |
|---|---|---|
| cpu | CPU usage per core and mode | windows_cpu_time_total |
| cpu_info | CPU hardware information | windows_cpu_info |
| memory | Physical and virtual memory usage | windows_memory_physical_free_bytes, windows_memory_physical_total_bytes |
| process | Per-process resource usage | windows_process_cpu_time_total |
| tcp | TCP connection statistics | windows_tcp_connections_established |
| cs | Computer system properties | windows_cs_hostname |
| logical_disk | Disk I/O and free space per volume | windows_logical_disk_free_bytes, windows_logical_disk_size_bytes |
| net | Network interface throughput | windows_net_bytes_received_total, windows_net_bytes_sent_total |
| os | Operating system metadata | windows_os_info |
| system | System-level counters (context switches, threads) | windows_system_boot_time_timestamp |
| textfile | Custom metrics from text files | (user-defined) |
| time | System clock and NTP offset | windows_time_computed_time_offset_seconds |
To enable additional collectors, edit the config.yml file and restart the service. For the full collector catalog, see the Windows Exporter documentation.