Each Prometheus agent consumes approximately 1 CPU core and 1 GB of memory per 1 million scraped metrics. To keep CPU and memory utilization at 50%, allocate double the baseline. For example, assign 2 cores and 2 GB for 1 million metrics.
Sizing recommendations
Use the following table to determine CPU and memory limits for a single Prometheus agent.
| Scraped metrics | Recommended CPU | Recommended memory |
|---|---|---|
| 500K | 1 core | 1 GB |
| 1M | 2 cores | 2 GB |
| 2M | 4 cores | 4 GB |
The scaling is linear: for every additional 500K metrics, add 1 CPU core and 1 GB of memory.
For example, if the Grafana dashboard shows that an agent scrapes 1 million metrics, set the agent's resource limits to 2 CPU cores and 2 GB of memory.
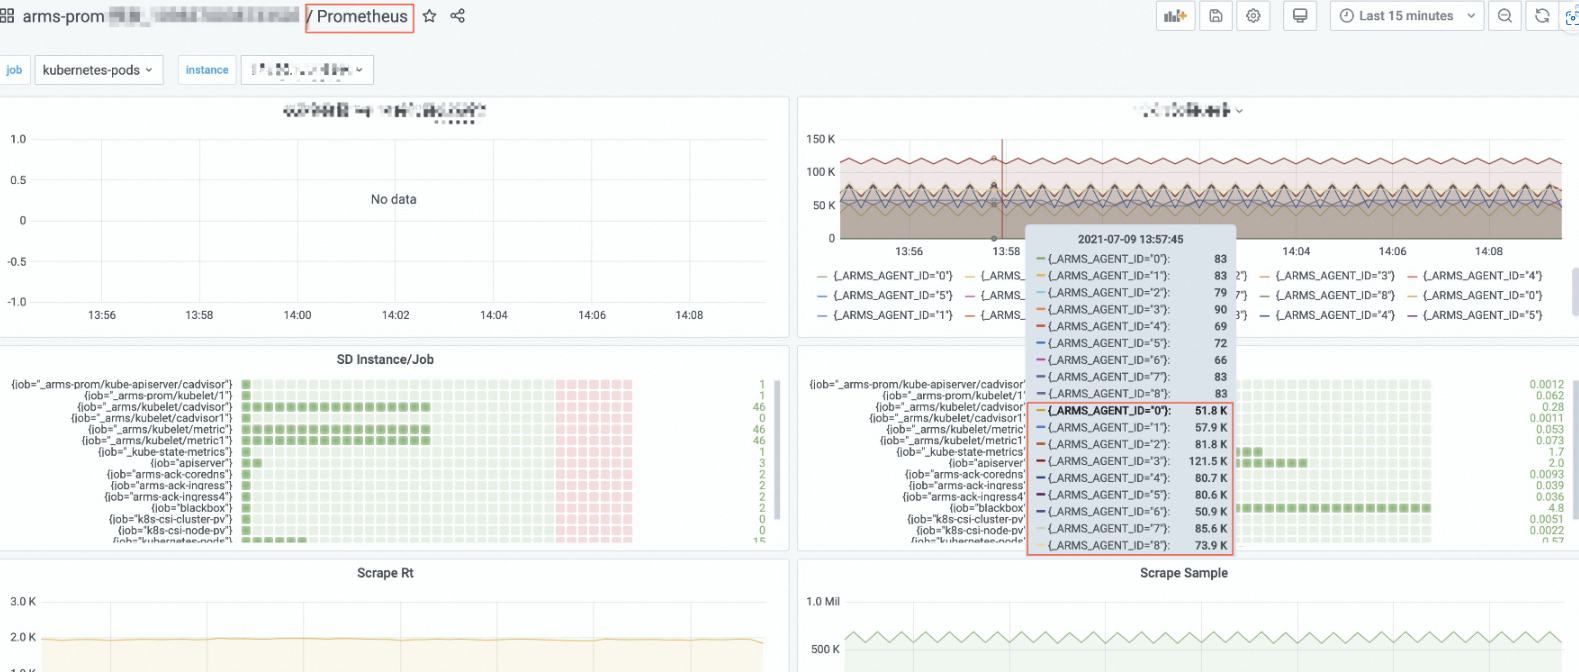
Check how many metrics an agent scrapes
Open the Grafana dashboard whose name contains Prometheus and run the following PromQL query:
sum (scrape_samples_scraped) by (_ARMS_AGENT_ID)The query returns the total scraped samples grouped by agent ID. Compare each agent's count against the sizing table to determine whether you need to adjust resources.
Stress test benchmarks
The sizing recommendations are derived from the following stress test results. The table shows actual CPU and memory consumption of a single Prometheus agent under increasing metric loads.
| Scraped metrics (per agent) | CPU (cores) | Memory (GB) |
|---|---|---|
| 1M | 0.95 | 1.09483 |
| 1.1M | 1.11 | 1.16045 |
| 1.2M | 1.36 | 1.09452 |
| 1.3M | 1.66 | 1.15971 |
| 1.4M | 1.29 | 1.09465 |
| 1.5M | 1.50 | 1.15977 |
| 1.6M | 1.39 | 1.15971 |
| 1.7M | 1.64 | 1.1599 |
| 1.8M | 1.63 | 1.42331 |