When you run self-managed Kafka clusters on Alibaba Cloud, you need visibility into broker performance, producer throughput, and consumer lag. Kafka JMX agents expose Java Management Extensions (JMX) metrics in Prometheus format, enabling Managed Service for Prometheus to scrape and visualize these metrics from your Kafka nodes.
Supported environments
Kafka JMX agents are supported only in the following Prometheus instance types:
| Prometheus instance type | Environment |
|---|---|
| Prometheus instance for Container Service for Kubernetes (ACK) | Kafka running in Kubernetes pods |
| Prometheus instance for Elastic Compute Service (ECS) | Kafka running on ECS instances |
Prerequisites
Before you begin, make sure that you have:
A running Kafka cluster deployed on ACK or ECS
Shell access to each pod or ECS instance where Kafka runs
The JVM startup parameters for each Kafka component (Producer, Broker, and Consumer)
Deploy the Kafka JMX agent
Download the agent
Download the Kafka JMX agent package to each pod or ECS instance where Kafka runs.
wget https://arms-public.oss-cn-shanghai.aliyuncs.com/Prom/agent/kafka-jmx_prometheus_javaagent-1.18.1.jar -O /opt/kafka/kafka-jmx_prometheus_javaagent-1.18.1.jarAdd the JVM agent parameter
Add the -javaagent flag to the JVM startup parameters of each Kafka component: Producer, Broker, and Consumer.
-javaagent:/<jmx-agent-directory>/kafka-jmx_prometheus_javaagent-1.18.1.jar=<jmx-listening-port>Replace the following placeholders with your actual values:
| Placeholder | Description | Example |
|---|---|---|
<jmx-agent-directory> | Directory where the JMX agent JAR file is stored | /opt/kafka |
<jmx-listening-port> | Port on which the JMX agent serves metrics | 9404 |
For example, if the agent JAR is stored in /opt/kafka and you want metrics served on port 9404:
-javaagent:/opt/kafka/kafka-jmx_prometheus_javaagent-1.18.1.jar=9404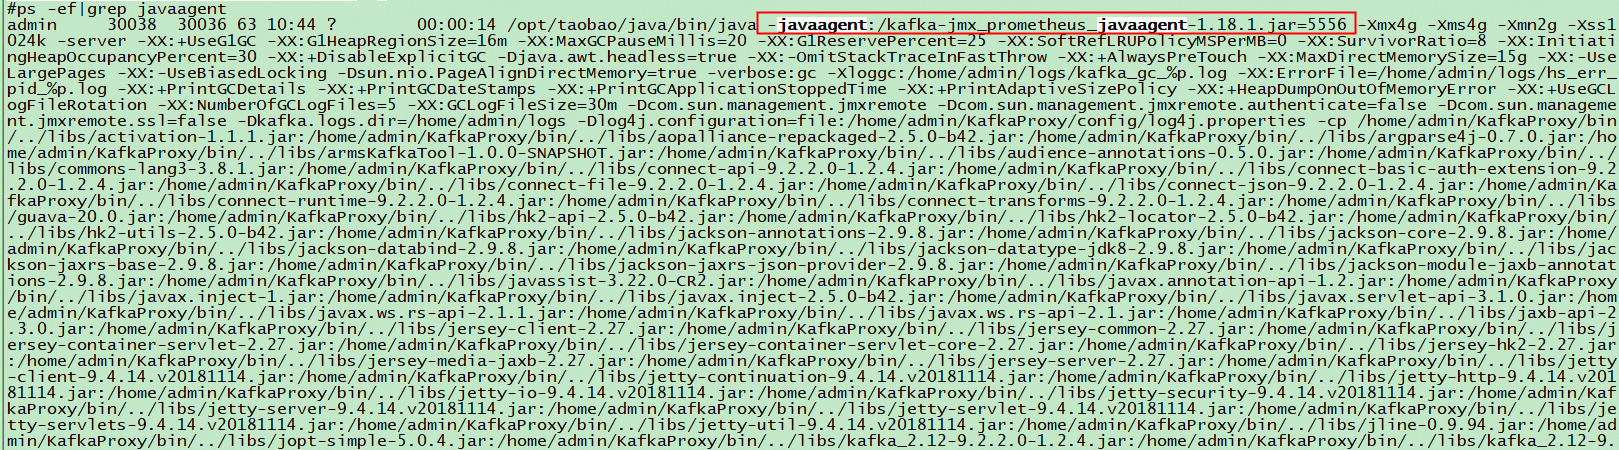
Restart and verify
Restart Kafka Producer, Broker, and Consumer for the changes to take effect.
Run the following command on each pod or ECS instance to verify that the JMX agent is serving metrics: Replace
<jmx-listening-port>with the port you specified in the previous step (for example,9404). A successful response returns Prometheus-format metrics similar to the following: If no metrics are returned, verify that the JMX agent JAR path and listening port in the JVM startup parameters are correct.curl localhost:<jmx-listening-port>/metrics# HELP kafka_server_brokertopicmetrics_messagesin_total Attribute exposed for management # TYPE kafka_server_brokertopicmetrics_messagesin_total counter kafka_server_brokertopicmetrics_messagesin_total{topic="my-topic"} 1024.0 # HELP jvm_memory_bytes_used Used bytes of a given JVM memory area. # TYPE jvm_memory_bytes_used gauge jvm_memory_bytes_used{area="heap"} 2.56901E8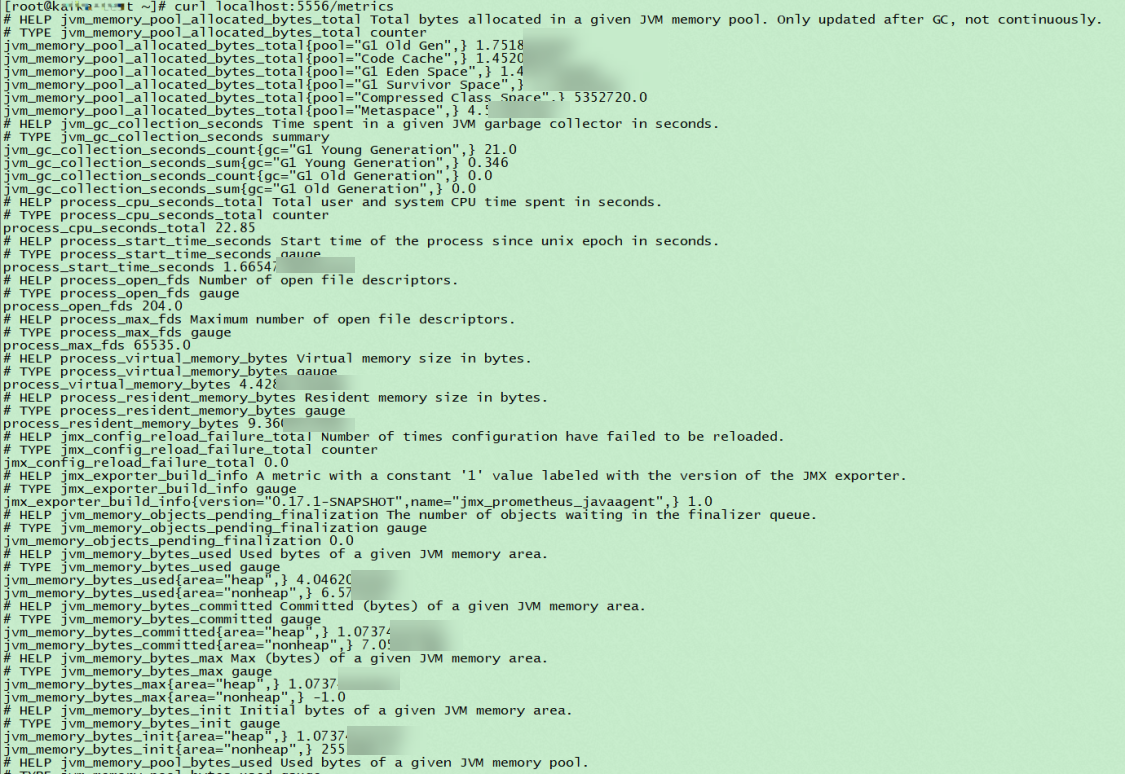
Configure the container port (ACK only)
This step applies only to Prometheus instances for Container Service (ACK). If your Kafka cluster runs on ECS, skip to Attach tags or labels for service discovery.
Expose the JMX agent port in the container specification so that Managed Service for Prometheus can scrape metrics from the pods.
Log on to the ACK console. In the left-side navigation pane, click Clusters.
On the Clusters page, find the target cluster and click its name. In the left-side pane, choose Workloads > Deployments.
In the Actions column of the target deployment, click Edit.
In the panel that appears, set the following fields:
Field Description Example Name A descriptive name for the JMX agent port app1-kafka-jmxContainer Port The JMX listening port specified during agent deployment 9404Protocol The network protocol TCP 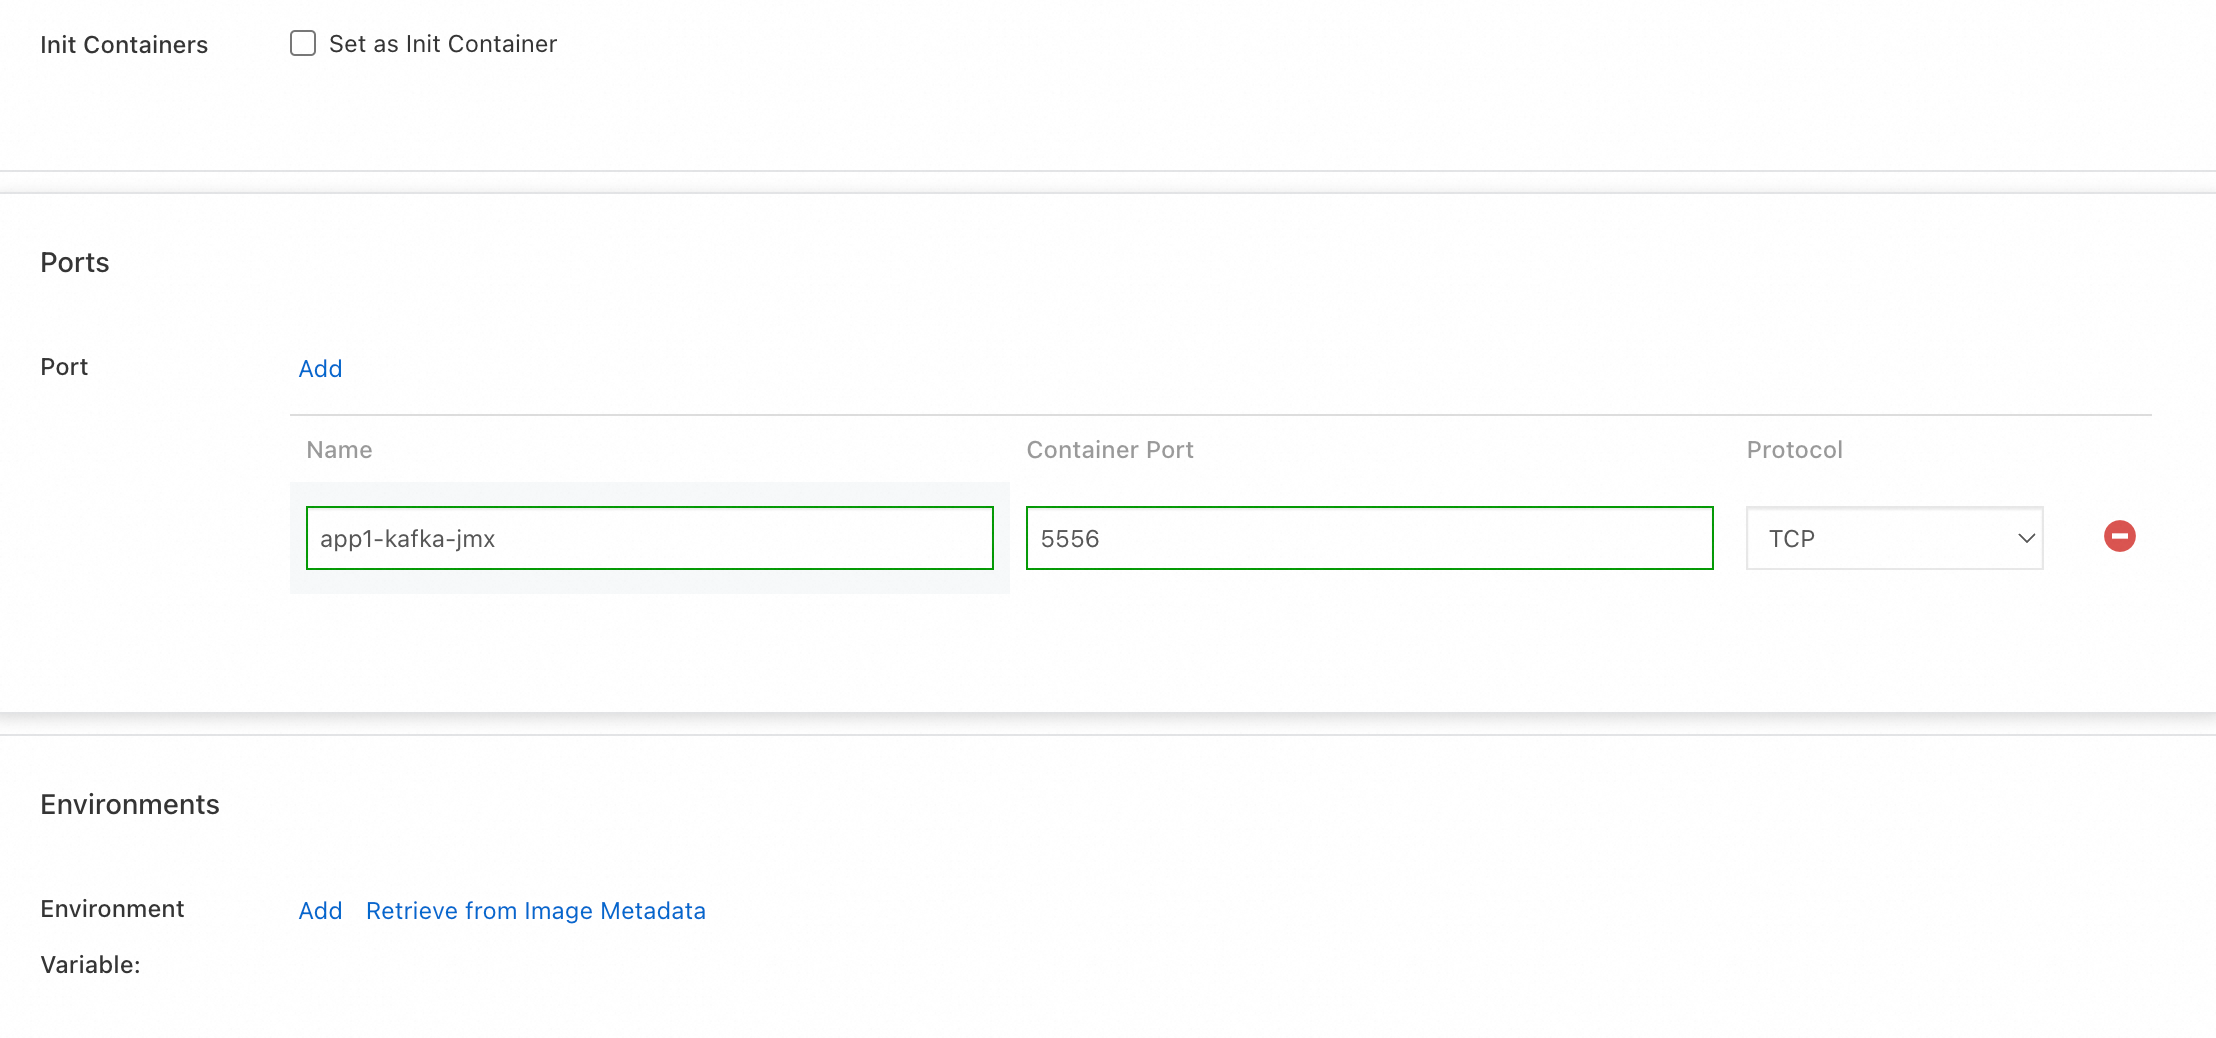
Attach tags or labels for service discovery
Managed Service for Prometheus uses tags (on ECS) or labels (on Kubernetes) to discover and scrape Kafka instances. If your Kafka pods or ECS instances already have service discovery tags or labels configured, skip this step.
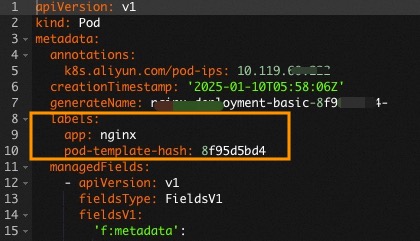
ACK: Add pod labels
Add a label in the format <key>:<value> to each Kafka Producer, Broker, and Consumer pod. For example: arms-kafka-exporter:my-kafka1.
Log on to the ACK console. In the left-side navigation pane, click Clusters.
On the Clusters page, find the target cluster and click its name. In the left-side pane, choose Workloads > Pods.
On the Pods page, click Edit in the Actions column of the target pod.
Add the label and click Update.
ECS: Add instance tags
Add a tag in the format <key>:<value> to each ECS instance running Kafka Producer, Broker, or Consumer. For example: arms-kafka-exporter:my-kafka1.
For instructions on creating ECS tags, see Tags.
What to do next
After all Kafka JMX agents are deployed and service discovery is configured, set up monitoring dashboards in the Managed Service for Prometheus console. For detailed instructions, see Use Managed Service for Prometheus to monitor self-managed Kafka clusters and ApsaraMQ for Kafka instances.