Managed Service for Prometheus stores your metric data in the cloud. To access this data, choose the method that fits your workflow:
Console: Run ad-hoc queries with a built-in metric explorer.
HTTP API: Retrieve metric data programmatically using the standard Prometheus HTTP API.
Self-managed Grafana: Add Managed Service for Prometheus as a data source in your own Grafana instance.
Self-managed Prometheus: Configure remote read so your Prometheus server can query metrics stored in Managed Service for Prometheus.
Prerequisites
Before you begin, make sure you have:
An activated Managed Service for Prometheus instance with at least one component enabled. For more information, see Manage components
Query metrics in the console
The Metrics Explorer in the Application Real-Time Monitoring Service (ARMS) console provides a visual query interface with PromQL support.
Log on to the ARMS console.
In the left-side navigation pane, click Integration Management.
On the Integrated Environments tab, click the name of the target environment.
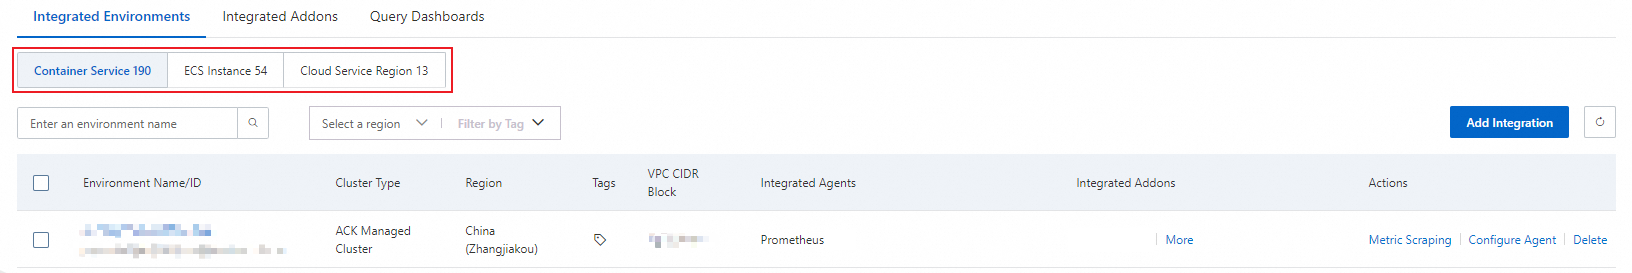
Click the Metrics Explorer tab.
In the Explore section, select a metric from the Metric drop-down list, add a key-value pair in the Labels field, and click Run query.
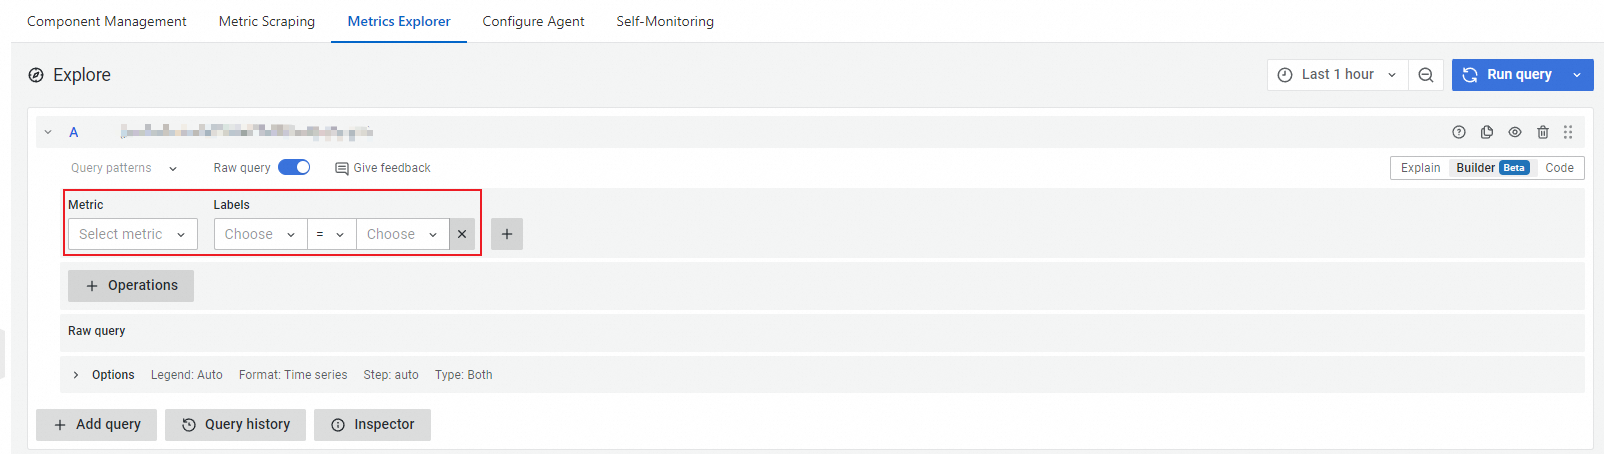
By default, the query returns data from the past hour. Click theicon to change the time range.
Use PromQL functions and the code editor
Click + Operations to add a PromQL function such as
sum(),irate(), orabsent(). For a full list, see Prometheus query functions.Switch to Code mode to write PromQL statements directly. For syntax details, see Prometheus query basics.
PromQL quick reference
The following examples cover common query patterns:
# Instant vector selector
up{job="prometheus"}

# Range vector selector (last 5 minutes)
http_requests_total[5m]

# Rate of increase per second
rate(http_requests_total[5m])

# Total increase over one hour
increase(http_requests_total[1h])

# Aggregate by label
sum by (job) (http_requests_total)

# CPU usage percentage
100 - (avg by (instance) (rate(node_cpu_seconds_total{mode="idle"}[5m])) * 100)

# Memory usage percentage
(1 - (node_memory_MemAvailable_bytes / node_memory_MemTotal_bytes)) * 100

# p95 request latency
histogram_quantile(0.95, sum(rate(http_request_duration_seconds_bucket[5m])) by (le))
For the full PromQL specification, see Prometheus documentation.
Query metrics with the HTTP API
Use the standard Prometheus HTTP API to retrieve metric data programmatically. This involves two steps: get your API endpoint URL, then send queries against it.
Step 1: Get the HTTP API URL
Log on to the ARMS console.
In the left-side navigation pane, choose Managed Service for Prometheus > Instances.
In the top navigation bar, select the region of your Prometheus instance. On the Instances page, find the instance and click Settings in the Actions column.
On the Settings tab, copy a public or internal URL from the HTTP API URL (Grafana Read URL) section.
URL type When to use Internal Your application runs within the same Alibaba Cloud region. Internal traffic is faster and does not incur internet bandwidth charges. Public Your application runs outside Alibaba Cloud or in a different region. 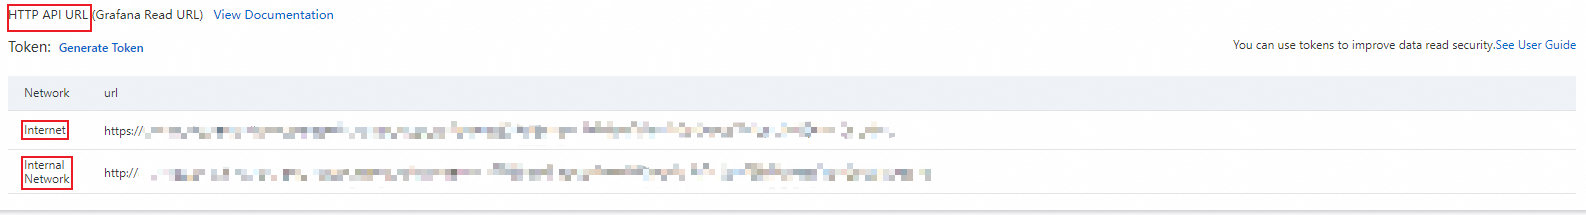
Secure API access with a token
To require authentication for all API requests, click Generate Token on the Settings tab. After you generate a token, every HTTP request must include the token in the Authorization header. Without a valid token, requests are rejected.
Step 2: Send a query
The following examples use the Prometheus HTTP API. Replace the placeholders with your values:
| Placeholder | Description | Example |
|---|---|---|
<http-api-url> | The HTTP API URL from Step 1 | http://cn-hangzhou.arms.aliyuncs.com |
<token> | The authentication token (if generated) | a]DZae2at**** |
<promql> | A valid PromQL expression | up{job="prometheus"} |
Instant query
Returns the value of a metric at a single point in time.
curl -H "Authorization:<token>" \
  "<http-api-url>/api/v1/query?query=<promql>&time=$(date +%s)&timeout=1000"
The time parameter accepts a Unix timestamp. $(date +%s) returns the current timestamp. You can also pass a specific value such as 1709171676.
Range query
Returns the values of a metric over a time range, at regular intervals.
curl -H "Authorization:<token>" \
"<http-api-url>/api/v1/query_range?query=<promql>&start=$(date -d '1 hour ago' +%s)&end=$(date +%s)&step=60"Thedate -dflag is specific to GNU/Linux. On macOS, usedate -v-1H +%sinstead.
For a complete API reference, see Prometheus HTTP API documentation.
Add Managed Service for Prometheus as a Grafana data source
Connect your self-managed Grafana instance to Managed Service for Prometheus to build dashboards from your cloud-hosted metrics.
Before you begin
Make sure you have:
The HTTP API URL from the ARMS console (see Step 1: Get the HTTP API URL in the previous section)
The authentication token, if you generated one
Administrator access to your Grafana instance
The following steps use Grafana v10.0.x. The UI may differ slightly in other versions.
Step 1: Add the Prometheus data source
Log on to Grafana as an administrator.
The default credentials for a new Grafana installation are
admin/admin. Change the password on first login.Click the
 icon in the upper-left corner.
In the left-side navigation pane, choose Configuration > Data sources.
Click Add data source.
Select Prometheus.
Configure the data source:
Name: Enter a descriptive name, for example,
arms-prometheus.Prometheus server URL: Paste the HTTP API URL from the ARMS console.

*(If you generated a token)* In the Custom HTTP Headers section, click + Add header, set Header to
Authorization, and set Value to the token.Click Save & test. A success message confirms that Grafana can reach Managed Service for Prometheus.
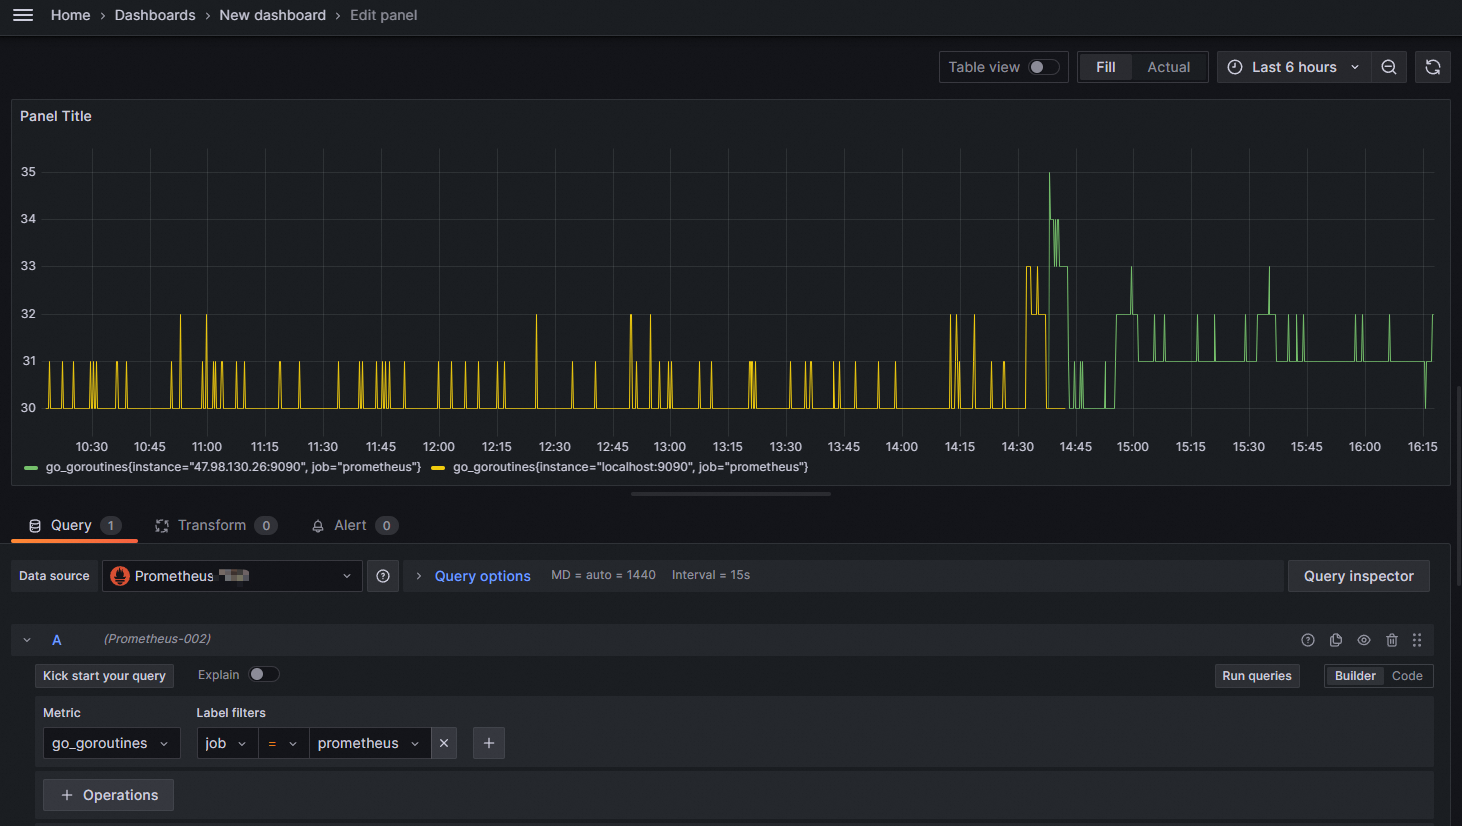
Step 2: Verify the data source
In the left-side navigation pane, click Dashboards.
Click New and select New dashboard.
Click + Add visualization and select the data source you created.
In the A section, enter a metric name in the Metrics field and press Enter. If a chart appears, the data source is working.
Troubleshooting
| Symptom | Possible cause | Resolution |
|---|---|---|
| No data displayed | Invalid HTTP API URL | Verify the URL on the ARMS console Settings tab. Make sure it does not contain extra path segments. |
| No data displayed | Missing or invalid token | Regenerate the token and update the Authorization header in Grafana. |
| No data displayed | No metric data available | Confirm that your monitored components are sending data to Managed Service for Prometheus. |
| Connection timeout | Network issue | If Grafana runs outside Alibaba Cloud, use the public URL. If both run in the same region, use the internal URL. |
If Grafana runs in a container (Docker or Kubernetes),localhostrefers to the container's own network namespace. Use the actual host IP orhost.docker.internalinstead.
Configure remote read for self-managed Prometheus
If you run your own Prometheus server, configure remote read to query metrics stored in Managed Service for Prometheus alongside your locally scraped data.
Known limitations
Managed Service for Prometheus remote write does not support HTTP/2.
Step 1: Get the remote read endpoint
Log on to the ARMS console.
In the left-side navigation pane, choose Managed Service for Prometheus > Instances.
In the top navigation bar, select the region of your Prometheus instance. On the Instances page, find the instance and click Settings in the Actions column.
On the Settings tab, copy the public or internal remote read endpoint.
Step 2: Configure prometheus.yml
Download open source Prometheus from the Prometheus download page.
Decompress the installation package.
Open
prometheus.ymland add the following block at the end of the file. Replace the URL with the remote read endpoint from Step 1.Placeholder Description Example <remote-read-endpoint>The remote read endpoint from the ARMS console http://cn-hangzhou.arms.aliyuncs.com:9443/api/v1/readremote_read: - url: "<remote-read-endpoint>" read_recent: trueSave the file and start (or restart) Prometheus.
Step 3: Verify remote read
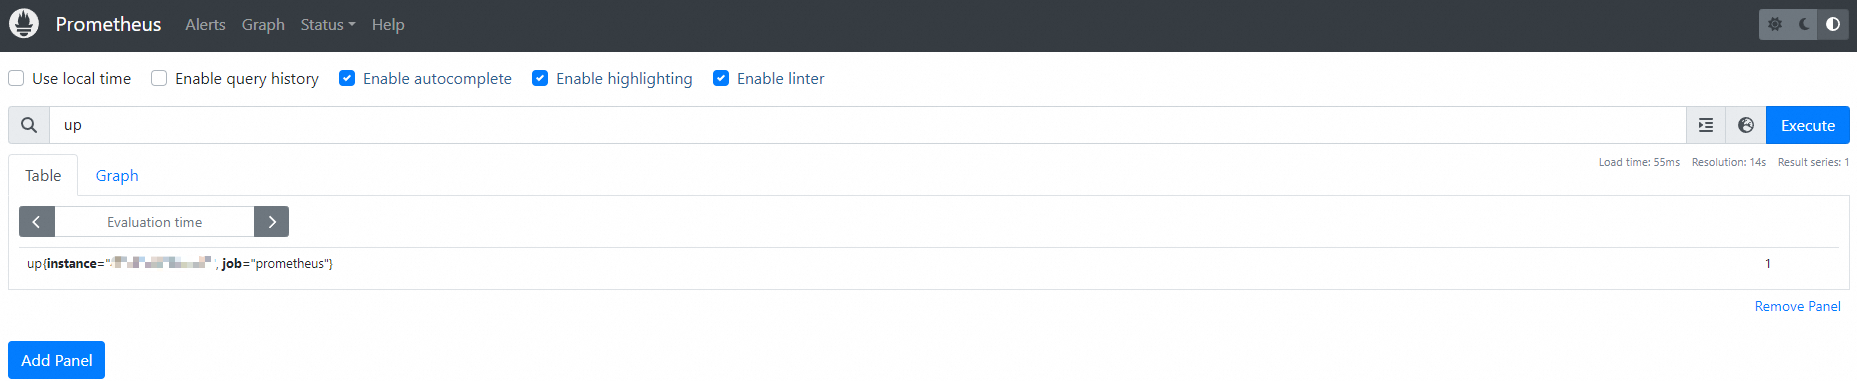
Open
http://localhost:9090in a browser.In the search box, enter a metric name that exists in Managed Service for Prometheus and click Execute. If the query returns results, remote read is configured correctly.