When your applications expose Prometheus metrics in a Container Service for Kubernetes (ACK) cluster, you need a way to discover and scrape those endpoints automatically as pods scale. ServiceMonitor, a Prometheus Operator Custom Resource Definition (CRD), selects Kubernetes Services through labels and configures Prometheus scrape targets declaratively. Enable ServiceMonitor in an ACK cluster with Alibaba Cloud Managed Service for Prometheus to collect application metrics without maintaining scrape configurations manually.
How it works
ServiceMonitor bridges your application pods and Prometheus through a label-based discovery chain:
A Kubernetes Service selects pods by label and exposes their endpoints.
A ServiceMonitor selects Services by label and defines how Prometheus should scrape them -- which port, which path, and at what interval.
Managed Service for Prometheus detects the ServiceMonitor configuration and automatically starts collecting metrics from the matched endpoints.
Because discovery is label-based, Prometheus picks up new pods as they scale up and stops scraping pods as they scale down, with no manual intervention.
Limitations
ServiceMonitor is available only for instances deployed in ACK clusters.
Prerequisites
Before you begin, make sure that you have:
An ACK cluster
A Kubernetes Service for the pods that expose metrics
Enable ServiceMonitor
ServiceMonitor is disabled by default. To enable it:
Log on to the ARMS console.
In the left-side navigation pane, click Integration Management.
On the Integrated Environments tab, click the Container Service tab, find the target ACK environment instance, and then click Metric Scraping in the Actions column.
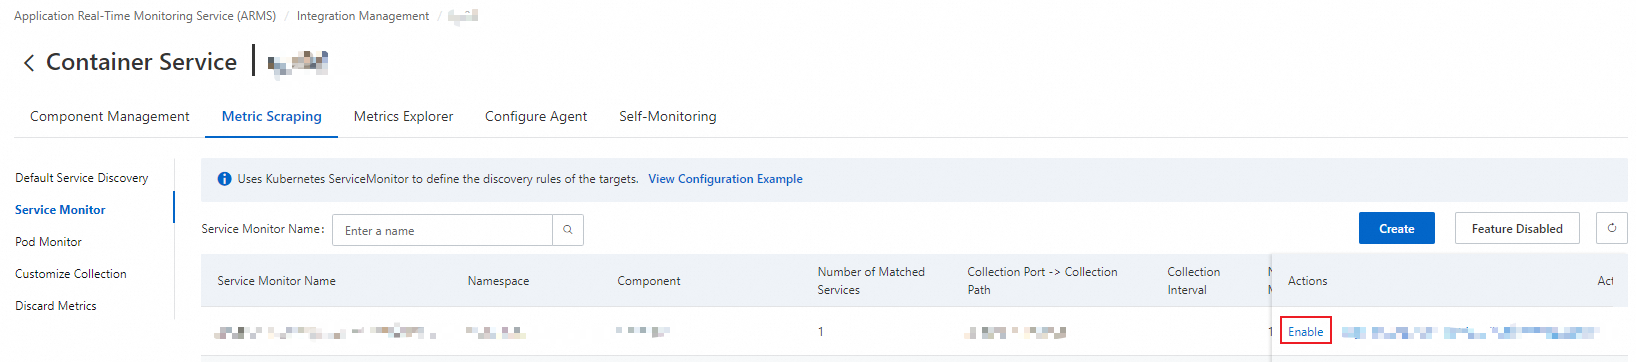
On the Metric Scraping tab, click Service Monitor.
On the Service Monitor tab, click Enabled.
After you enable ServiceMonitor, all existing ServiceMonitor configurations in the ACK cluster appear on this tab. Application Real-Time Monitoring Service (ARMS) scrapes metrics from the configured pod paths at the specified intervals.
Create a ServiceMonitor configuration
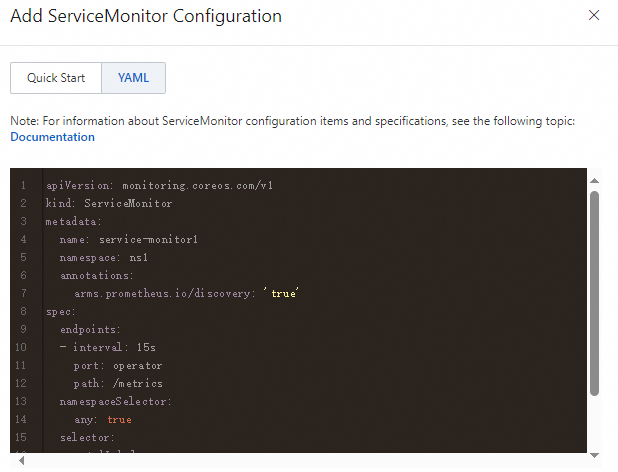
On the Service Monitor tab, click Create to open the Add ServiceMonitor Configuration panel. Two configuration methods are available: Quick Start and YAML.
Quick Start
Specify the following parameters, and then click Check to validate. If the validation succeeds, click Create.
| Parameter | Description |
|---|---|
| Namespace | The namespace where the target Service is deployed. |
| Service | The Kubernetes Service that selects the pods exposing metrics. |
| Port | The port on which the metrics endpoint is exposed. |
| Metric Path | The HTTP path where Prometheus metrics are served, for example, /metrics. |
| Collection Interval | How often Prometheus scrapes the endpoint, for example, 30s. |

YAML
Define a ServiceMonitor configuration in YAML for more control. The following example scrapes metrics from all pods behind a Service labeled app: example-app, on a port named web, every 30 seconds:
apiVersion: monitoring.coreos.com/v1
kind: ServiceMonitor
metadata:
  name: example-app
  namespace: default
spec:
  selector:
    matchLabels:
      app: example-app
  endpoints:
  - port: web
    path: /metrics
    interval: 30s
Fields in the spec section:
| Field | Description |
|---|---|
selector.matchLabels | Label selector that matches the target Kubernetes Service. |
endpoints[].port | Named port defined in the Service. Must match a port name in the Service spec, not a port number. |
endpoints[].path | HTTP path where the application serves Prometheus metrics. Defaults to /metrics if omitted. |
endpoints[].interval | Scrape interval. Common values: 15s, 30s, 60s. |
Paste your YAML into the editor, click Check to validate, and then click Create.
Manage ServiceMonitor configurations
On the Service Monitor tab, find the target configuration. The Actions column provides the following operations:
| Operation | Description |
|---|---|
| Edit | Modify the ServiceMonitor YAML in the Edit Service Monitor Configuration panel. |
| Disable | Suspend metric collection for this configuration. The configuration is retained but no longer takes effect. |
| Delete | Permanently remove the ServiceMonitor configuration. |
To stop all ServiceMonitor-based metric collection, click Feature Disabled on the Service Monitor tab. After you disable the feature, Prometheus no longer discovers or scrapes new targets defined by ServiceMonitor configurations. Targets that are already being scraped continue to be collected.
Verify metric collection
After you create a ServiceMonitor configuration, confirm that metrics are being collected:
In the ARMS console, go to Prometheus Monitoring and select your ACK cluster.
Run a PromQL query for a metric exposed by your application, for example,
up{job="example-app"}.If data appears, the ServiceMonitor is working. If no data appears, check the following:
The Service label selector matches the target pods.
The pods expose metrics on the specified port and path.
The ServiceMonitor configuration is enabled on the Service Monitor tab.
Billing
ServiceMonitor metric collection through Managed Service for Prometheus incurs fees.
If your cluster previously used open-source Prometheus with ServiceMonitor configurations, migrating to Managed Service for Prometheus retains those configurations. The retained ServiceMonitor settings continue to incur costs.
What's next
Configure alert rules for the collected metrics.