When your Container Service for Kubernetes (ACK) cluster runs workloads that expose Prometheus-compatible metrics, you need a way to automatically discover and scrape those metrics without manually configuring each target. PodMonitor automates metric collection from specific pods in your ACK cluster through Managed Service for Prometheus, scraping metrics at defined intervals based on label selectors.
Limitations
PodMonitor is available only for instances deployed in ACK clusters.
Billing
PodMonitor incurs fees through Managed Service for Prometheus. For pricing details, see Billing.
-
If your cluster previously used open-source Prometheus with PodMonitor configurations, migrating to Managed Service for Prometheus retains these configurations. PodMonitor charges apply after migration.
Prerequisites
Before you begin, ensure that you have:
-
An ACK cluster
-
Pods that expose Prometheus-compatible metrics in the cluster
Enable PodMonitor
In the left navigation pane, click Integration Management.
On the Integrated Environments tab, view the environment list on the Container Service tab. Find the ACK instance and click Metric Scraping in the Actions column.
-
On the Metric Scraping tab, click Pod Monitor.
-
On the Pod Monitor tab, click Enabled. After you enable PodMonitor, Managed Service for Prometheus discovers all PodMonitor configurations in the ACK cluster and scrapes metrics from matching pods at the configured interval.
NotePodMonitor is disabled by default.

Create a PodMonitor configuration
-
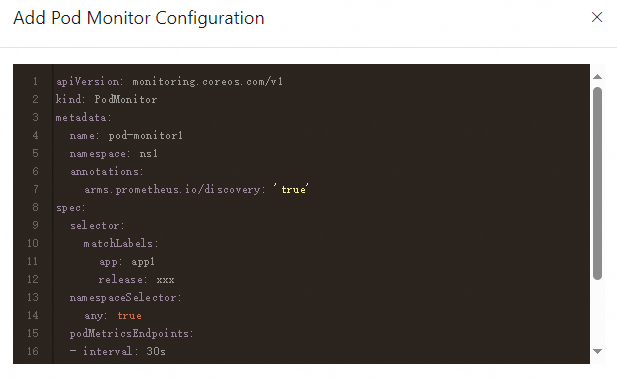
On the Pod Monitor page, click Create.
-
In the Add Pod Monitor Configuration panel, edit the YAML template to define the target pods, metrics endpoint, and scrape settings.
-
Click Create.
Edit a PodMonitor configuration
-
In the PodMonitor configuration list, find the target configuration.
-
Click Edit Configuration in the Actions column.
-
In the Edit Pod Monitor Configuration panel, modify the YAML template as needed.
Disable a PodMonitor configuration
In the PodMonitor configuration list, find the target configuration and click Disable in the Actions column. A disabled configuration stops taking effect but is retained in the list.
Delete a PodMonitor configuration
In the PodMonitor configuration list, find the target configuration and click Delete in the Actions column.
Disable the PodMonitor feature
On the Pod Monitor tab, click Feature Disabled to turn off the entire PodMonitor feature. After the feature is turned off, Managed Service for Prometheus stops discovering and scraping metrics exposed by pods. Targets that are already being collected continue to be collected.