Application Real-Time Monitoring Service (ARMS) Browser Monitoring captures real user data across your web applications -- page load performance, JavaScript (JS) errors, and API call reliability -- to surface issues that server-side monitoring alone cannot detect.
Why browser monitoring matters
When end users access your website, the process spans three phases:
| Phase | What happens | Monitored by |
|---|---|---|
| Page production | The server generates the page | Server-side monitoring |
| Page loading | The browser downloads and renders resources | Browser monitoring |
| Page running | Client-side JS executes and handles user interactions | Browser monitoring |
Server-side monitoring covers only the first phase. Browser monitoring covers the second and third -- where most user-facing issues originate.
Common challenges
Performance bottlenecks are hard to isolate
Slow page loads can stem from network issues, resource loading issues, or Document Object Model (DOM) parsing issues. The root cause often varies by the province and country where the user resides, or the browser and device of the user, making issues difficult to reproduce and causes difficult to identify.
JS errors go undetected until users report them
After a deployment, a spike in JS errors can silently break functionality for a subset of users. Without real-time error tracking, you may lose a large number of users. Even when a user reports an issue, you may not be able to reproduce the scenario or quickly fix the error without sufficient context.
API failures hide behind HTTP 200 responses
An API call that returns HTTP status code 200 can still contain a business logic exception. Without visibility into API success rates and response times, you cannot isolate the slow or failing calls that degrade the user experience.
How ARMS Browser Monitoring solves these challenges
The following table maps each challenge to the ARMS feature that addresses it. Start from the Application overview page to detect anomalies, then drill into the dedicated pages for root cause analysis.
| Challenge | ARMS feature | What it provides |
|---|---|---|
| Performance bottlenecks | Page Speed | Performance metrics and a waterfall chart of page loading phases |
| JS errors | JS Error Diagnosis | Page-level error rate rankings and frequent error listings |
| API failures | API Request | API success rates and response times, including business logic exceptions |
| Reproducing user issues | View Details | Multiple types of access logs |
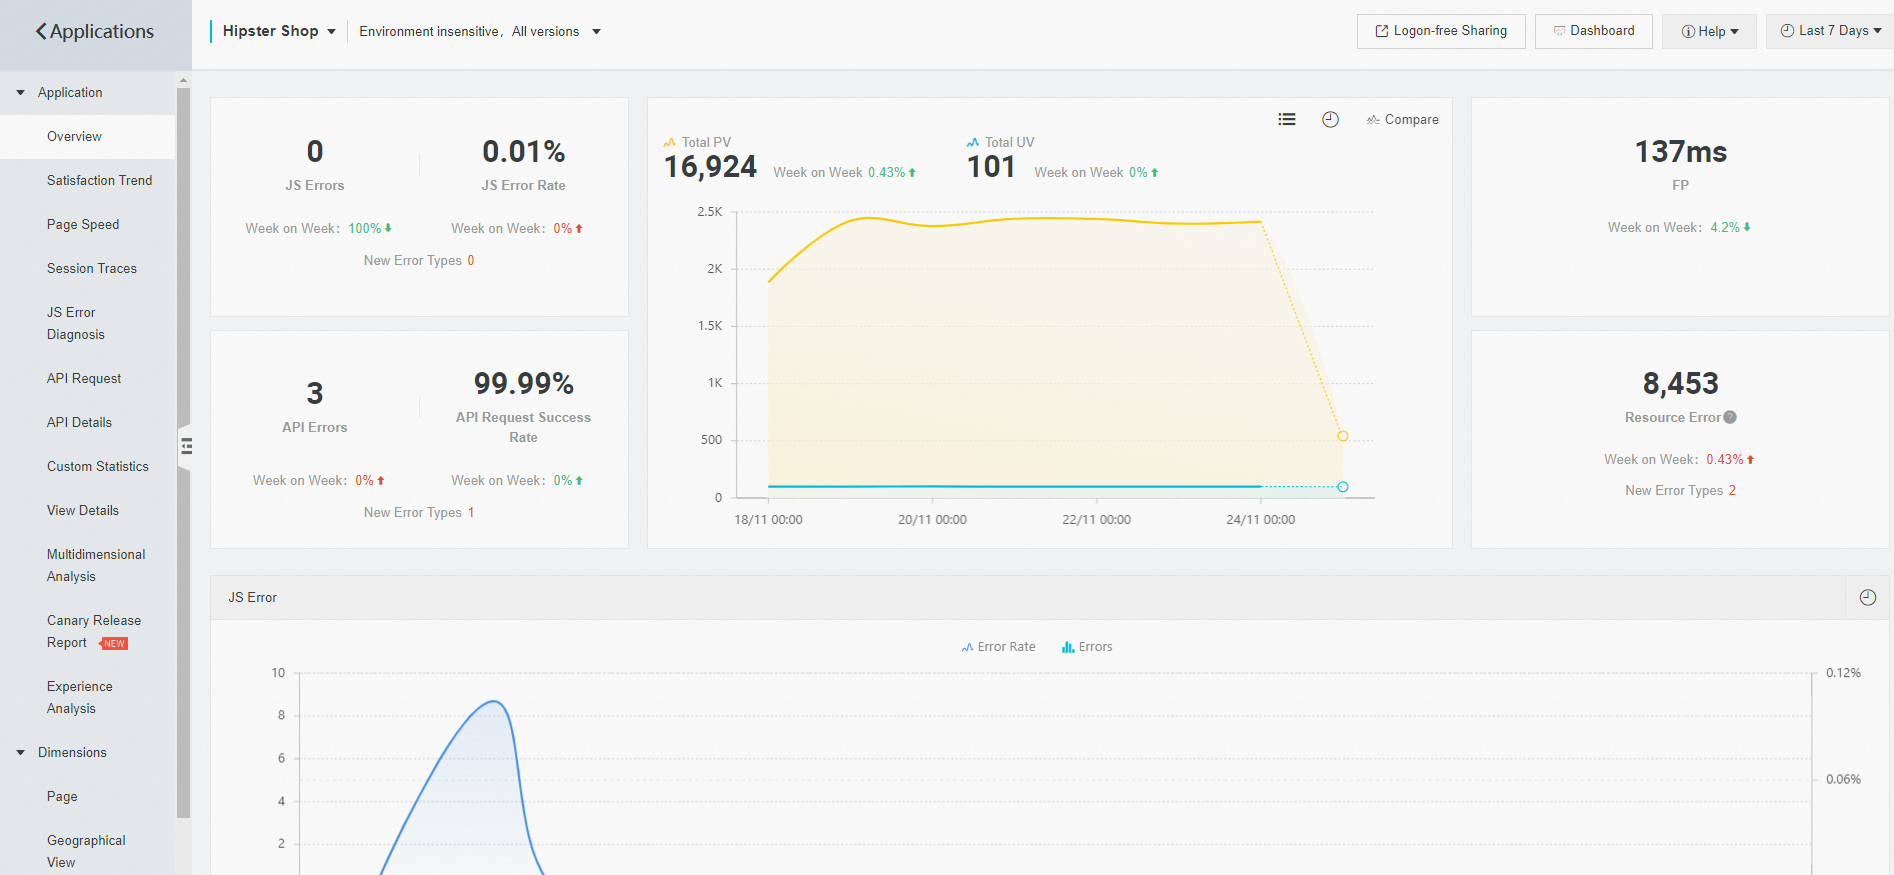
Spot anomalies at a glance
The Application overview page provides a real-time summary of key metrics:
JS error count and error rate
API error count and success rate
Page views (PVs) and unique visitors (UVs)
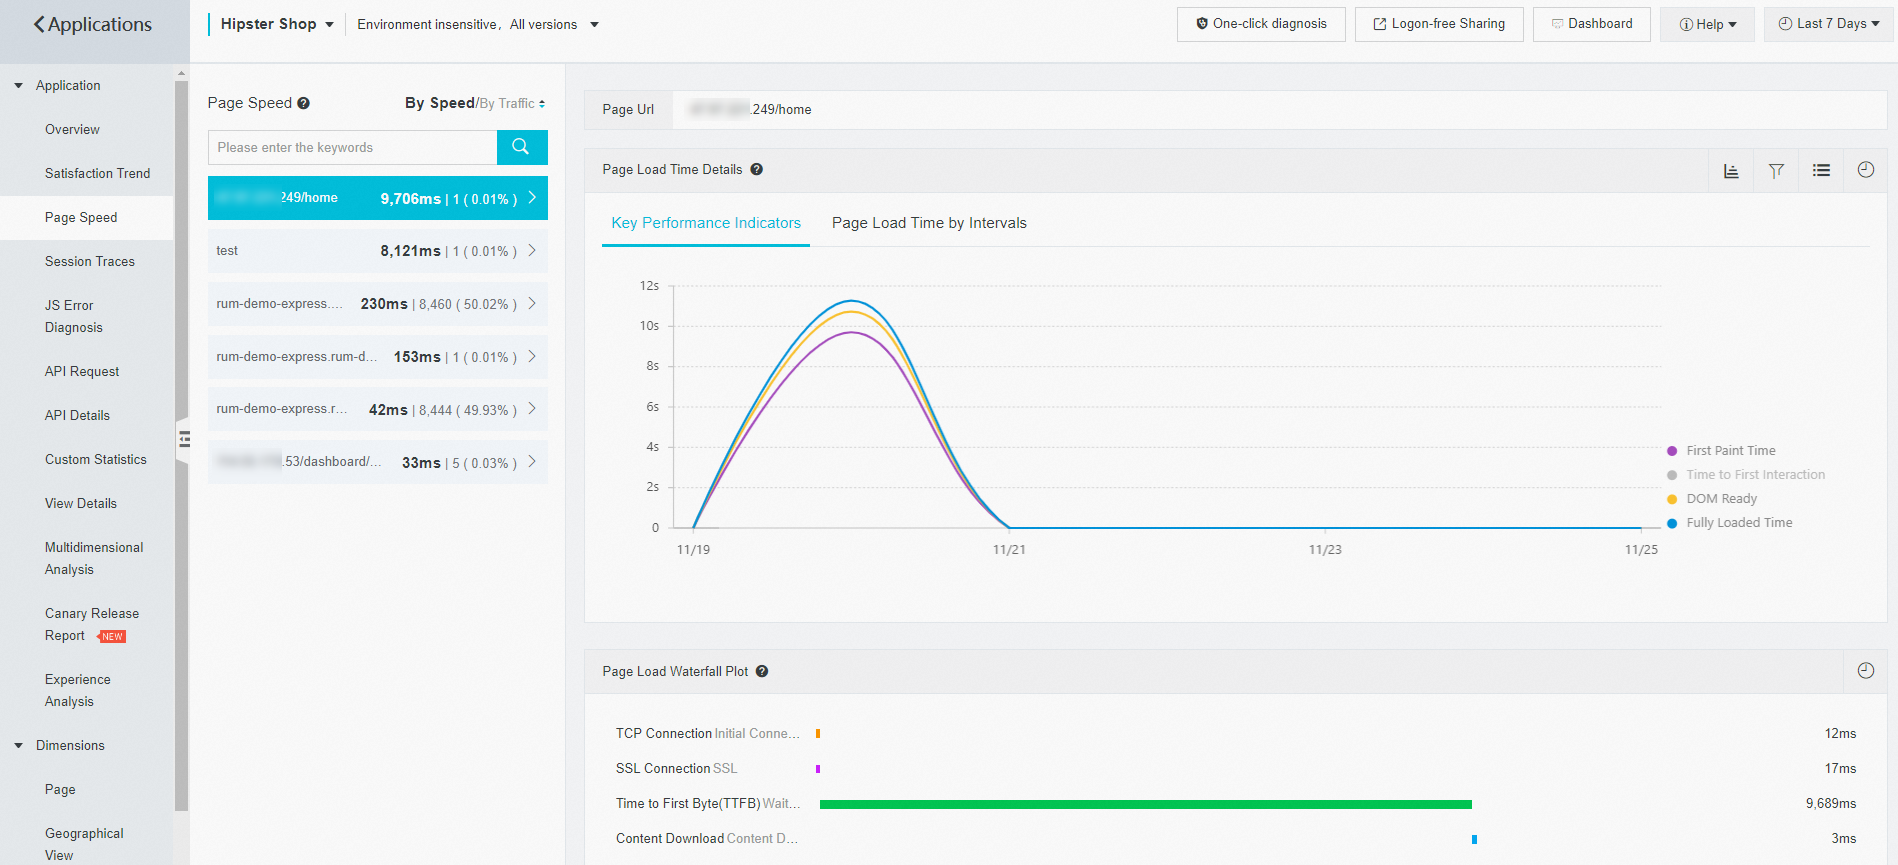
Track page performance
The Page Speed page displays performance metrics and a waterfall chart of page loading. Use the waterfall chart to identify which loading phase causes the bottleneck and locate the performance issue based on the detailed data.
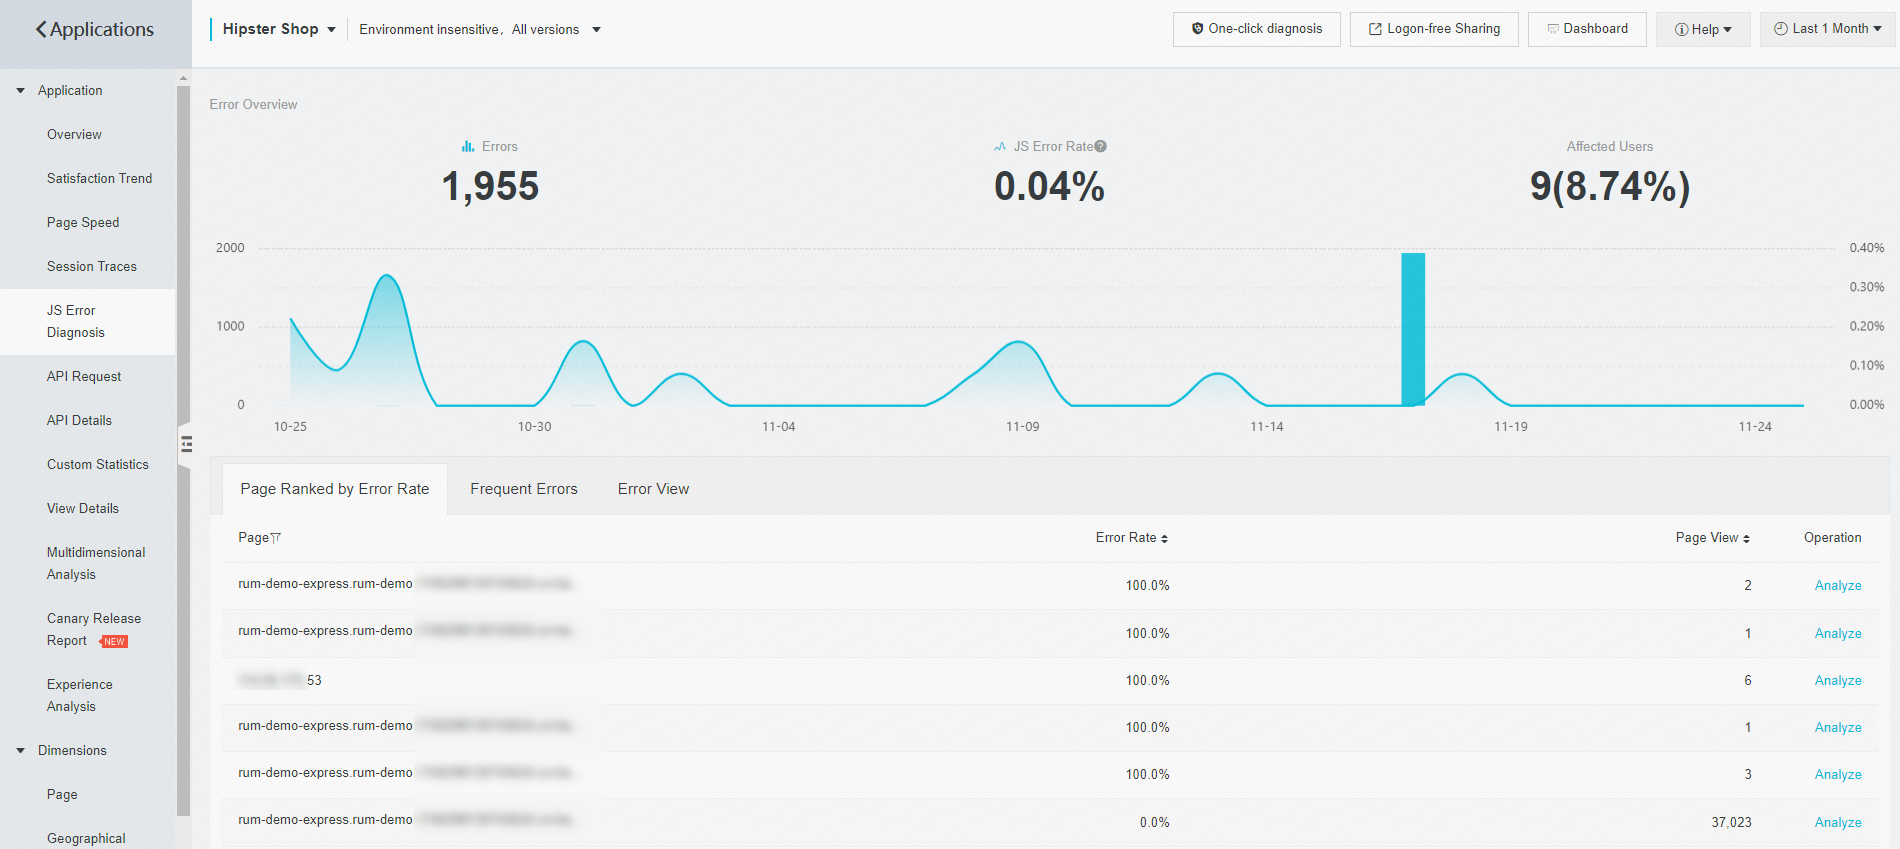
Diagnose JS errors
The JS Error Diagnosis page ranks pages by error rate and lists the most frequent errors across your application. Use these rankings to prioritize fixes for the most frequent errors.
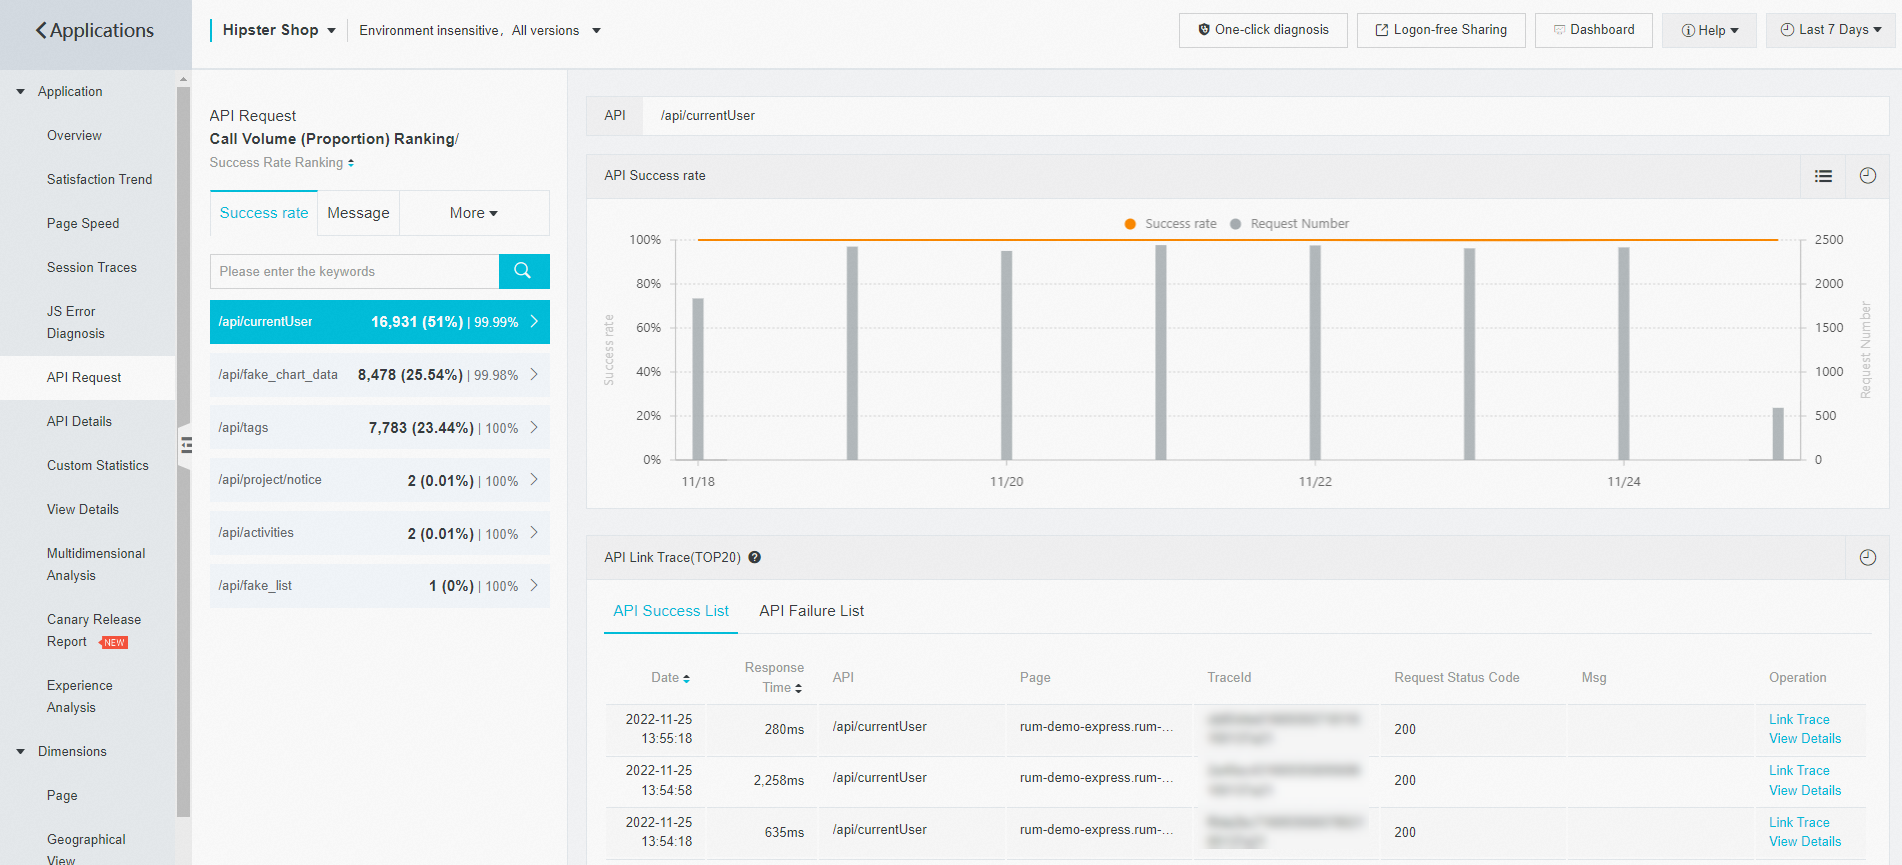
Monitor API requests
The API Request page shows the success rate and response time of API calls. Identify endpoints with high failure rates or slow responses, even when the HTTP status code indicates success.
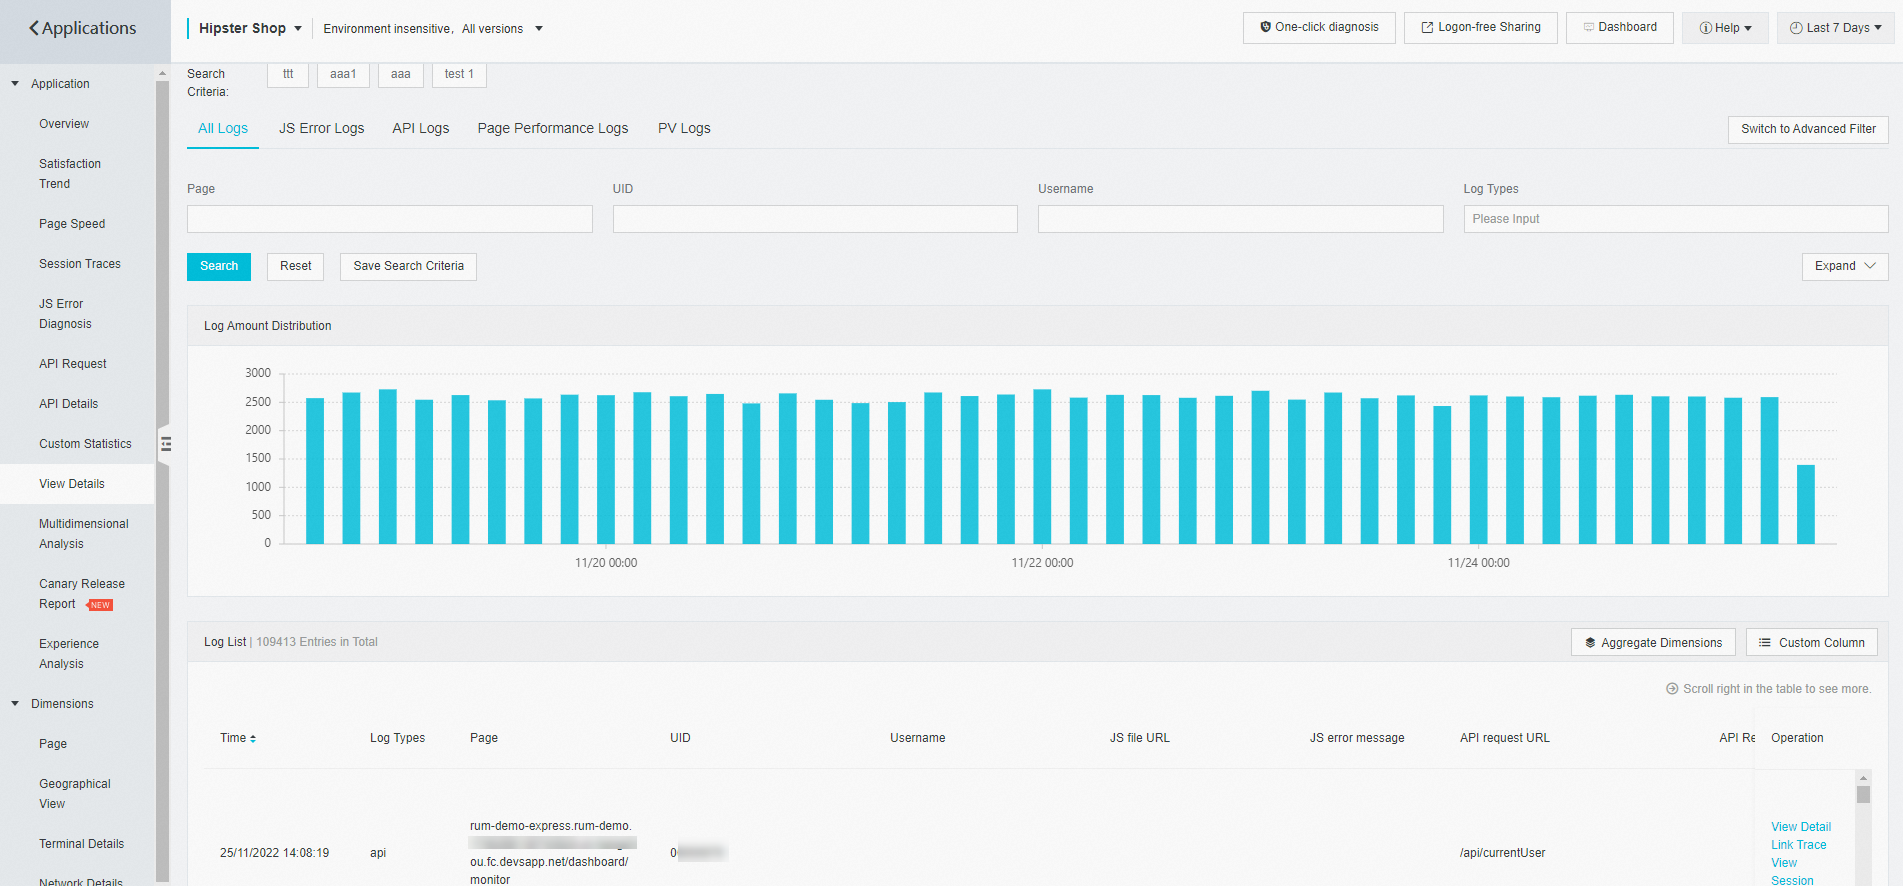
Inspect access details
The View Details page provides multiple types of access logs. Use these logs to review the full context of a reported issue.
What to do next
[Get started with Browser Monitoring]() -- Set up browser monitoring for your web application.
[Page speed]() -- Learn how to analyze page load performance in detail.
[JS error diagnosis]() -- Learn how to diagnose and resolve JS errors.
[API request monitoring]() -- Learn how to monitor API call success rates and response times.