Starting from February 16, 2023, Managed Service for Prometheus dashboards will be updated along with the exporters. After a dashboard is updated, the old dashboards of the same type are overwritten by the new dashboards.
Effective date
The dashboard updates take effect from February 16, 2023.
Announcement
Managed Service for Prometheus dashboards will be updated along with the exporters. After a dashboard is updated, the old dashboards of the same type are overwritten by the new dashboards.
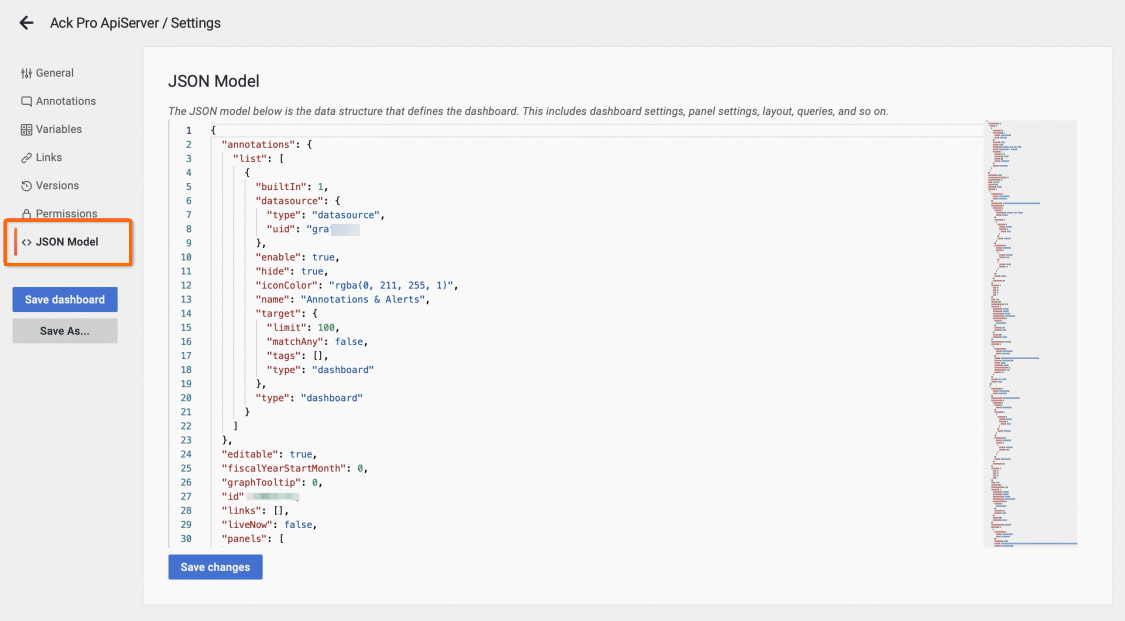
If you want to save an old dashboard, you can save the JSON file of the dashboard in the JSON Model module of the Grafana dashboard page. Then, you can create a new dashboard and replace the JSON file of the new dashboard with the JSON file of the old dashboard to restore the data of the old dashboard. Perform the following steps:
- Go to the Grafana dashboard homepage. Note You must activate Grafana Pro Edition.
- Click the
 icon in the upper-right corner of the dashboard page to go to the settings page.
 - In the left-side navigation pane, click JSON Model. Copy the JSON content and save it to your computer. Then, create a new dashboard and replace the JSON file of the new dashboard with the JSON file of the old dashboard. This way, you can restore the data of the old dashboard.
 Note If you have any questions when you save the old dashboard, you can search for group chat ID 34590319 in DingTalk and contact technical support.