PromQL and LogQL are expressive query languages, but writing them from scratch can be difficult to understand and write. Grafana v9.0.x lowers this barrier with visual query builders for Prometheus and Loki data sources. This release also refreshes the UI, improves navigation, and redesigns the Alerting module.
Query builders for Prometheus and Loki
Grafana v9.0.x adds visual query builders in Explore for composing and understanding PromQL and LogQL queries without memorizing syntax.
Three editing modes are available:
| Mode | Description |
|---|---|
| Code | Write query statements as raw text. |
| Builder | Select metrics, specify labels, and add operations through a visual interface. |
| Explain | View a step-by-step breakdown of how a query works, whether written in Code or Builder mode. |
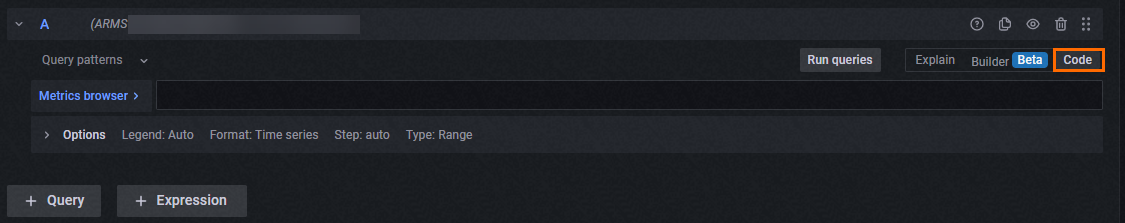
Code mode
Write raw PromQL or LogQL query statements directly.
Builder mode
Select metrics, specify labels, and add operations through a visual interface to generate query statements.

Metric and Labels filters: Search metrics by keyword, select a metric, and filter by label values.
Operations: Click + Operation to add functions, range functions, aggregations, and binary operations.
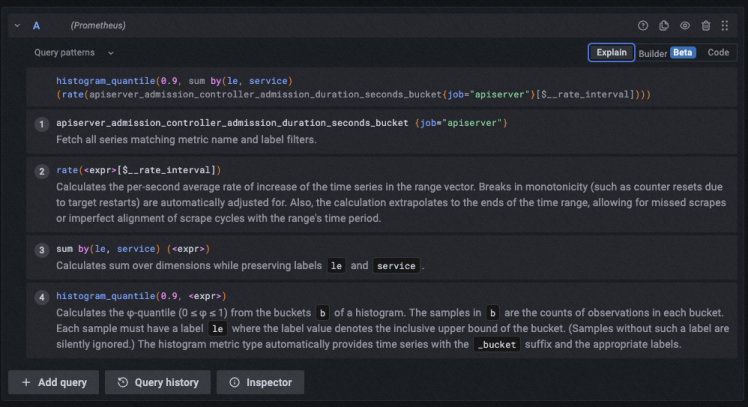
Explain mode
View a step-by-step breakdown of how a query works, whether it was written in Code or Builder mode.
Navigation and search
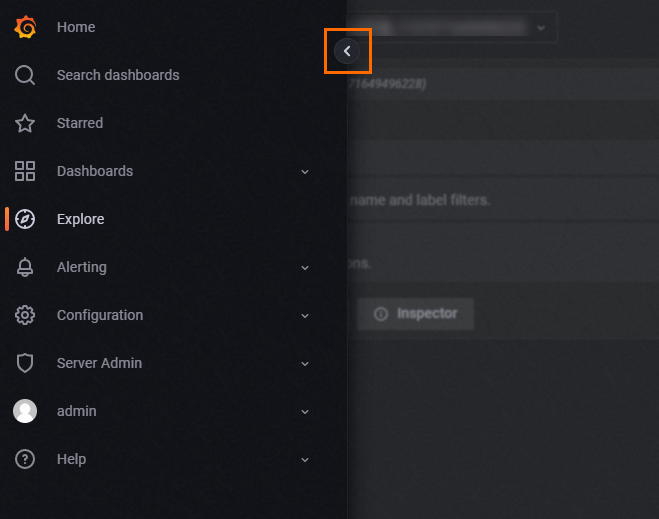
Expandable navigation bar
Expand the navigation bar to see all Grafana features and installed integrations at a glance.
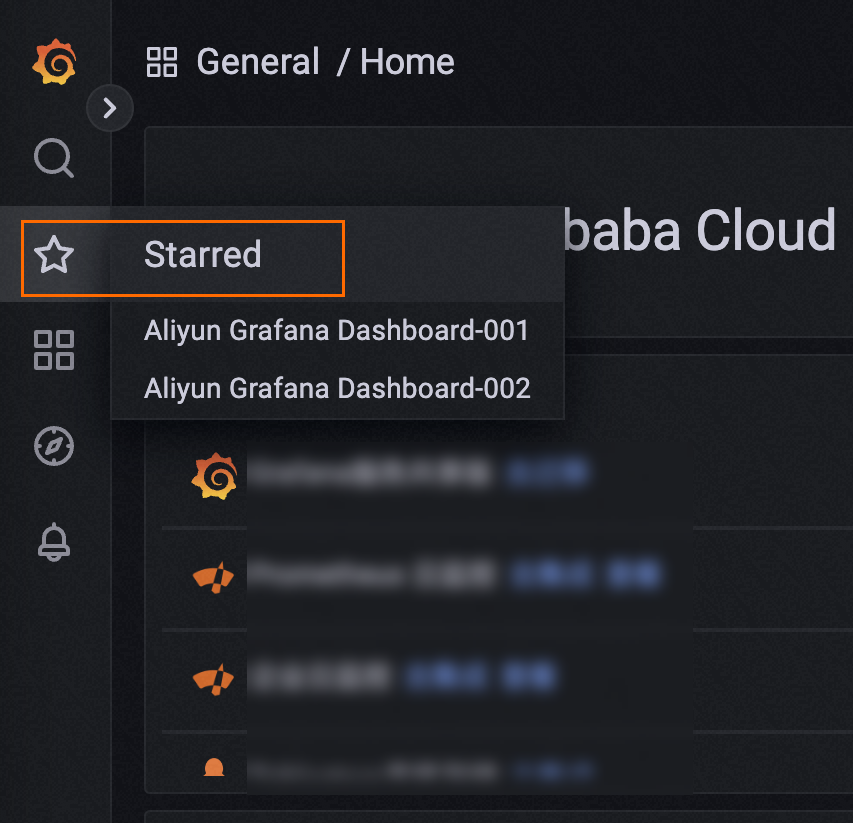
Starred dashboards
Mark frequently used dashboards with a star, then access them from the Starred section in the navigation bar.
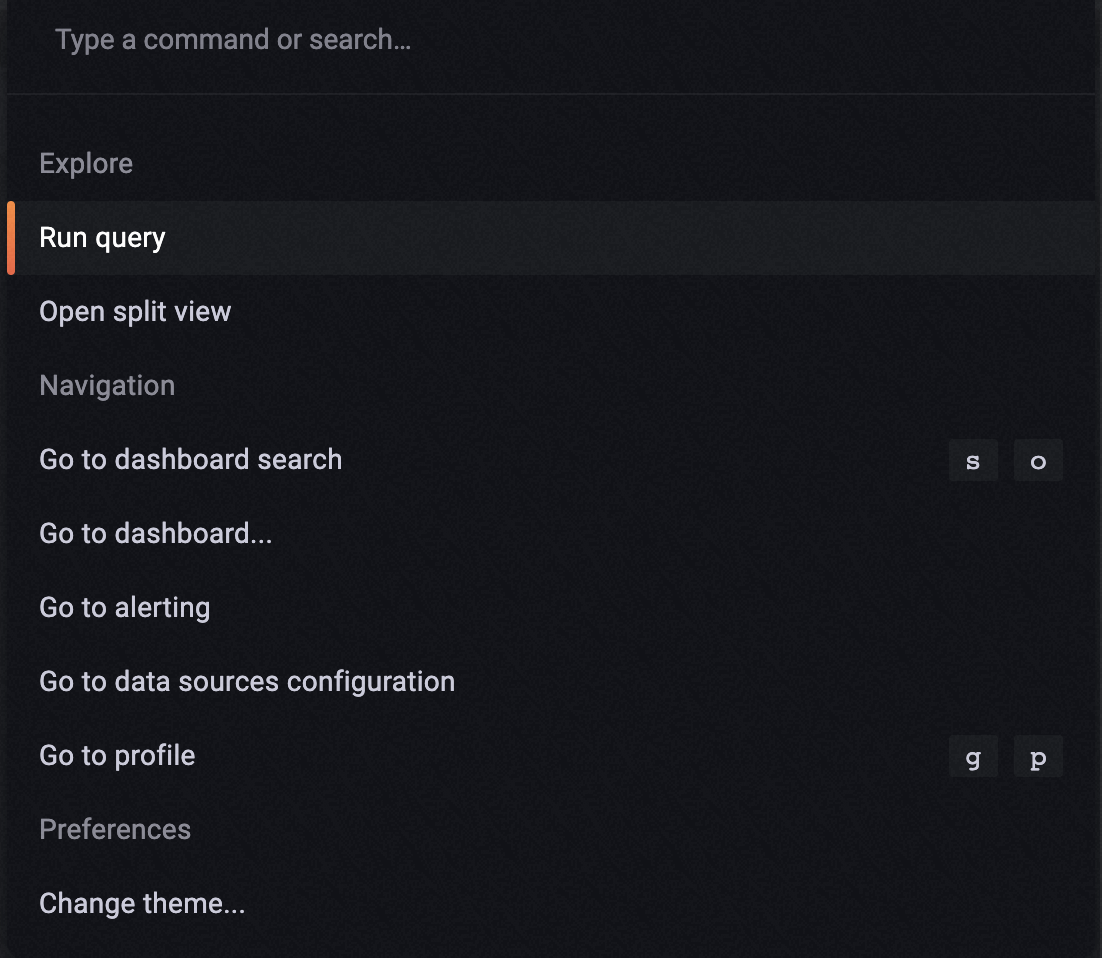
Command palette
Press Cmd+K on macOS or Ctrl+K on Linux and Windows to open the command palette. Search for and run commands directly from the palette.
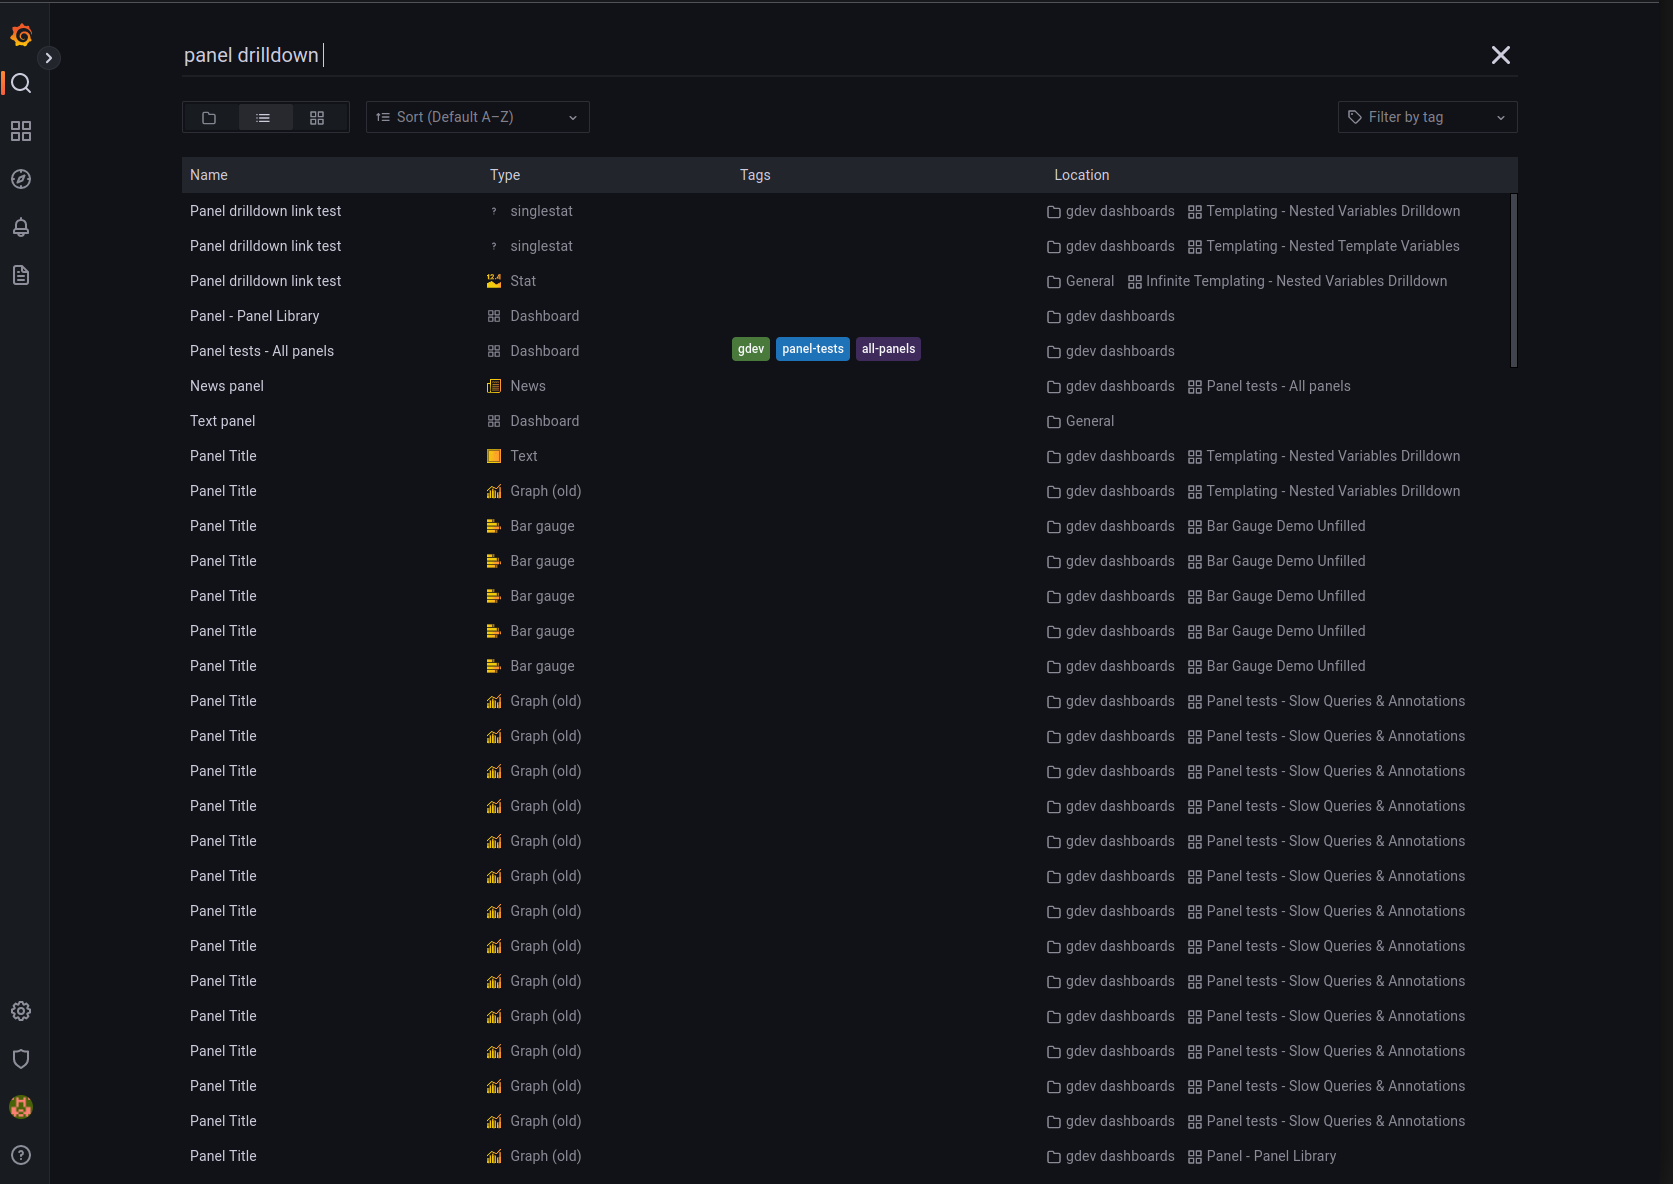
Dashboard search
Dashboard search now uses an in-memory full-text index instead of SQL-based queries, and supports searching by panel title.
Explore improvements
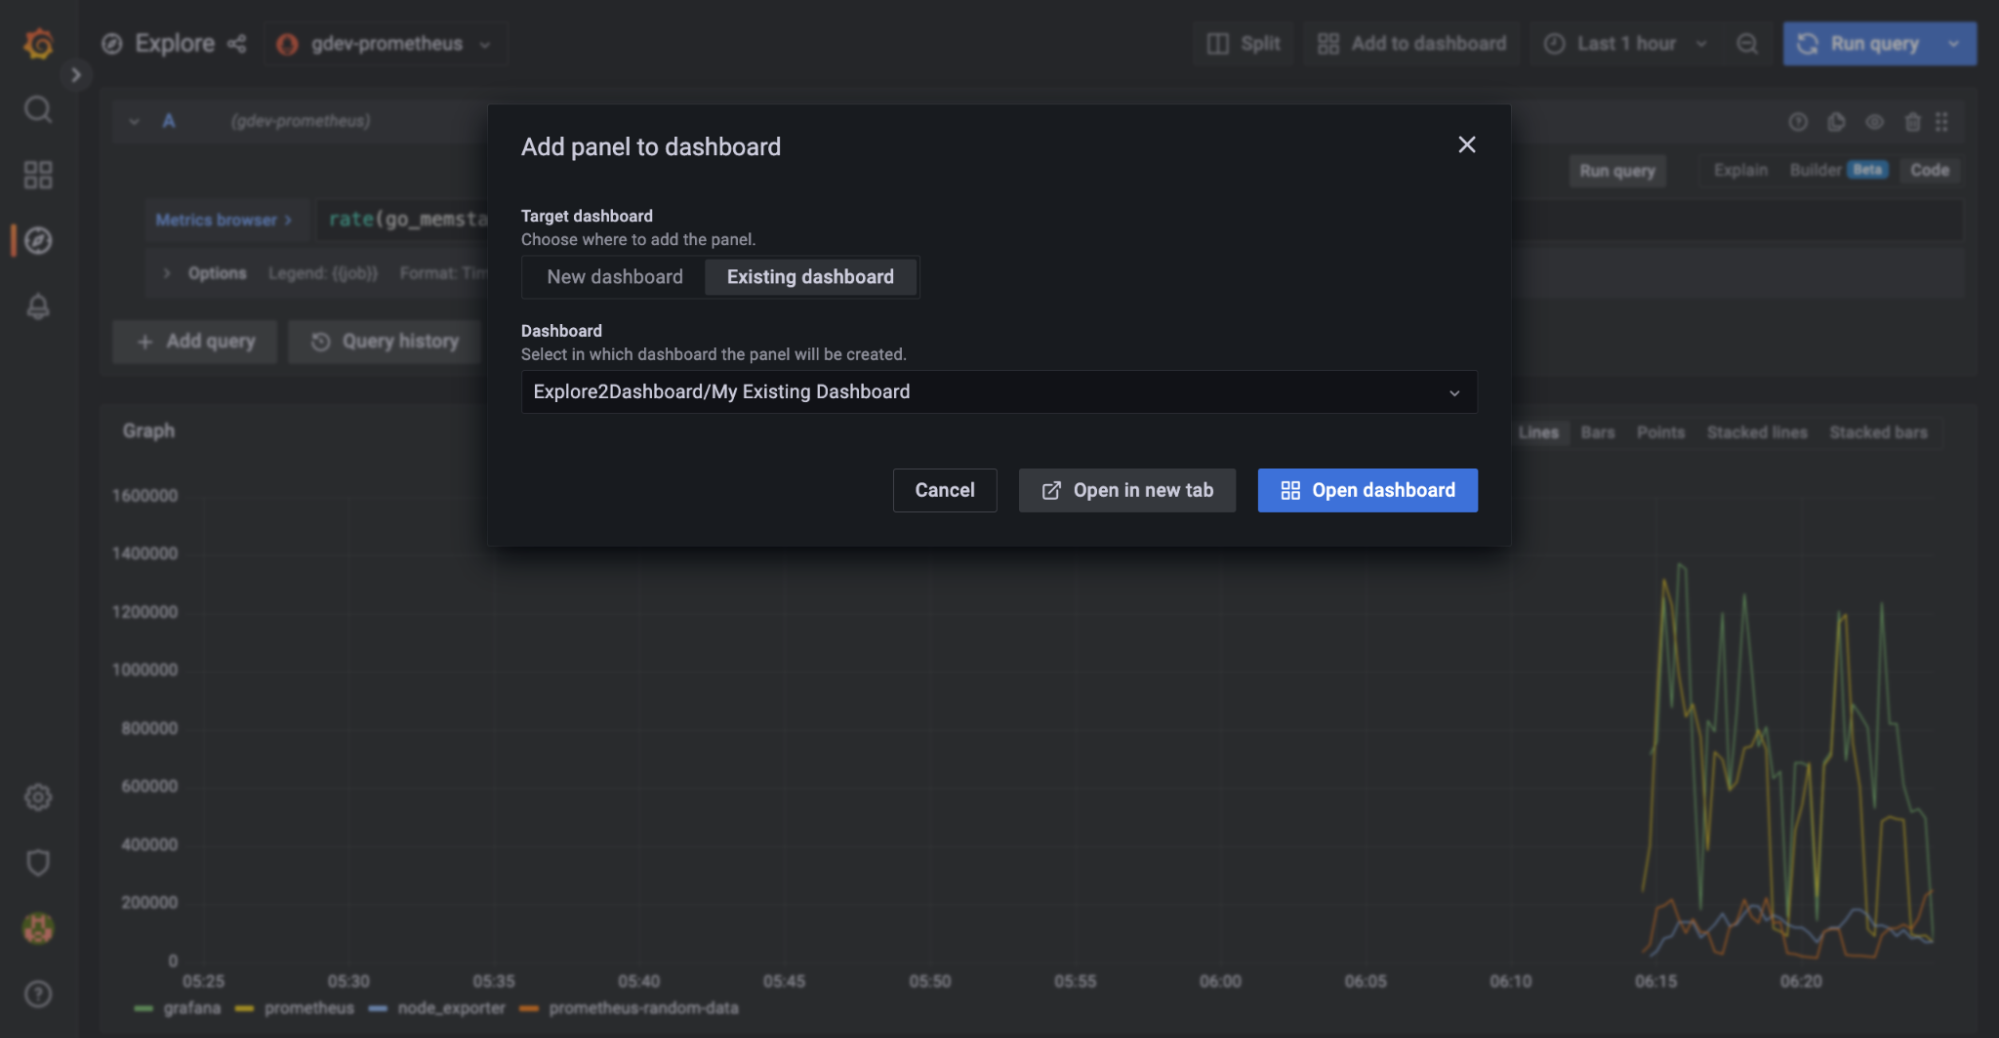
Create panels and dashboards from Explore
In earlier versions, you could import panels and dashboards into Explore but not the other way around. Grafana v9.0.x adds the ability to create panels or dashboards directly from query statements in Explore.
Query history
Click Query history to view all queries run in Explore.

Panel updates
Heatmap panel
The heatmap panel is rebuilt on a new architecture with the following improvements:
| Improvement | Description |
|---|---|
| Performance | Better performance and faster response time. |
| Resolution | Higher resolution support. |
| Color spectrum | Custom, fine-grained control over the color spectrum. |
Traces panel
The new traces panel displays trace data directly in a dashboard panel, removing the need to query traces in Explore.
Dashboard previews
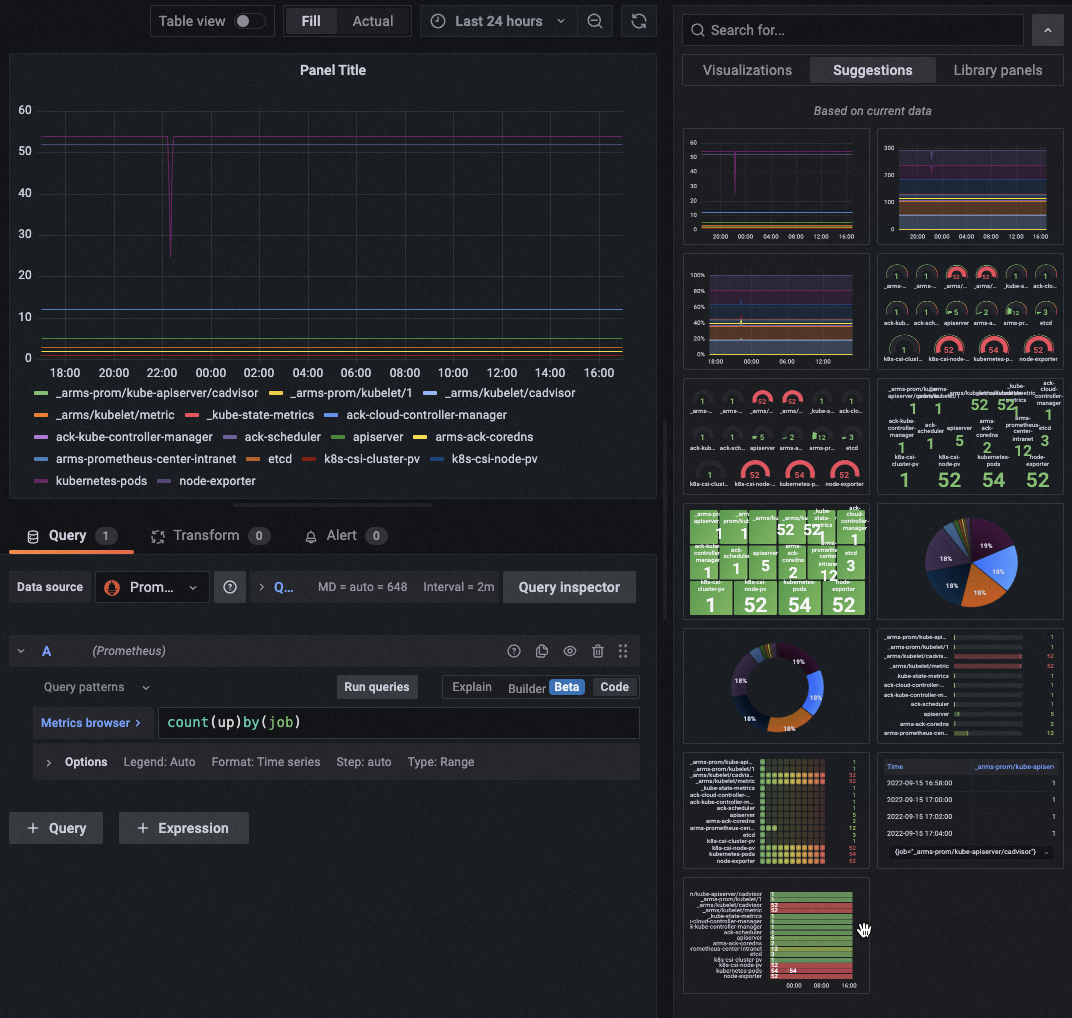
Enter a query statement and preview matching dashboards on the Suggestions tab in the right-side panel, without opening each dashboard individually.
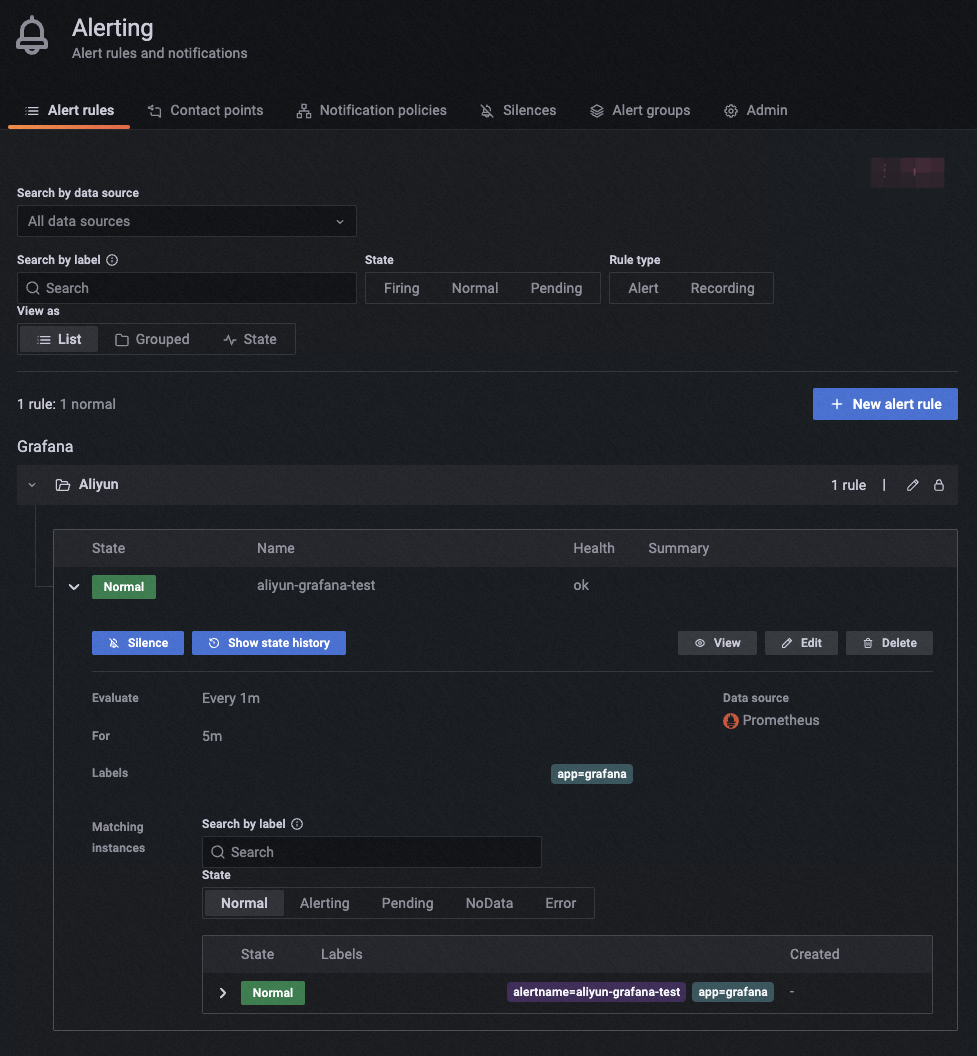
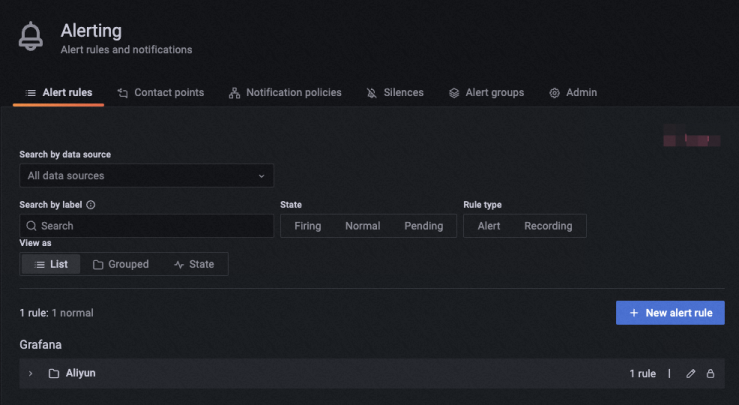
Alerting
Grafana v9.0.x includes a redesigned Alerting UI.
Alert state history
Track how alert states change over time and why. The Alerting or OK state indicates that an error occurred during evaluation or no evaluation result was returned. The state history distinguishes between three alert types:
| State | Meaning |
|---|---|
| Alerting | A configured alert condition was triggered. |
| Alerting (NoData) | No evaluation result was returned. |
| Alerting (Error) | An error occurred during alert rule evaluation. |
This distinction clarifies whether an alert resulted from a triggered condition, missing data, or an evaluation error.
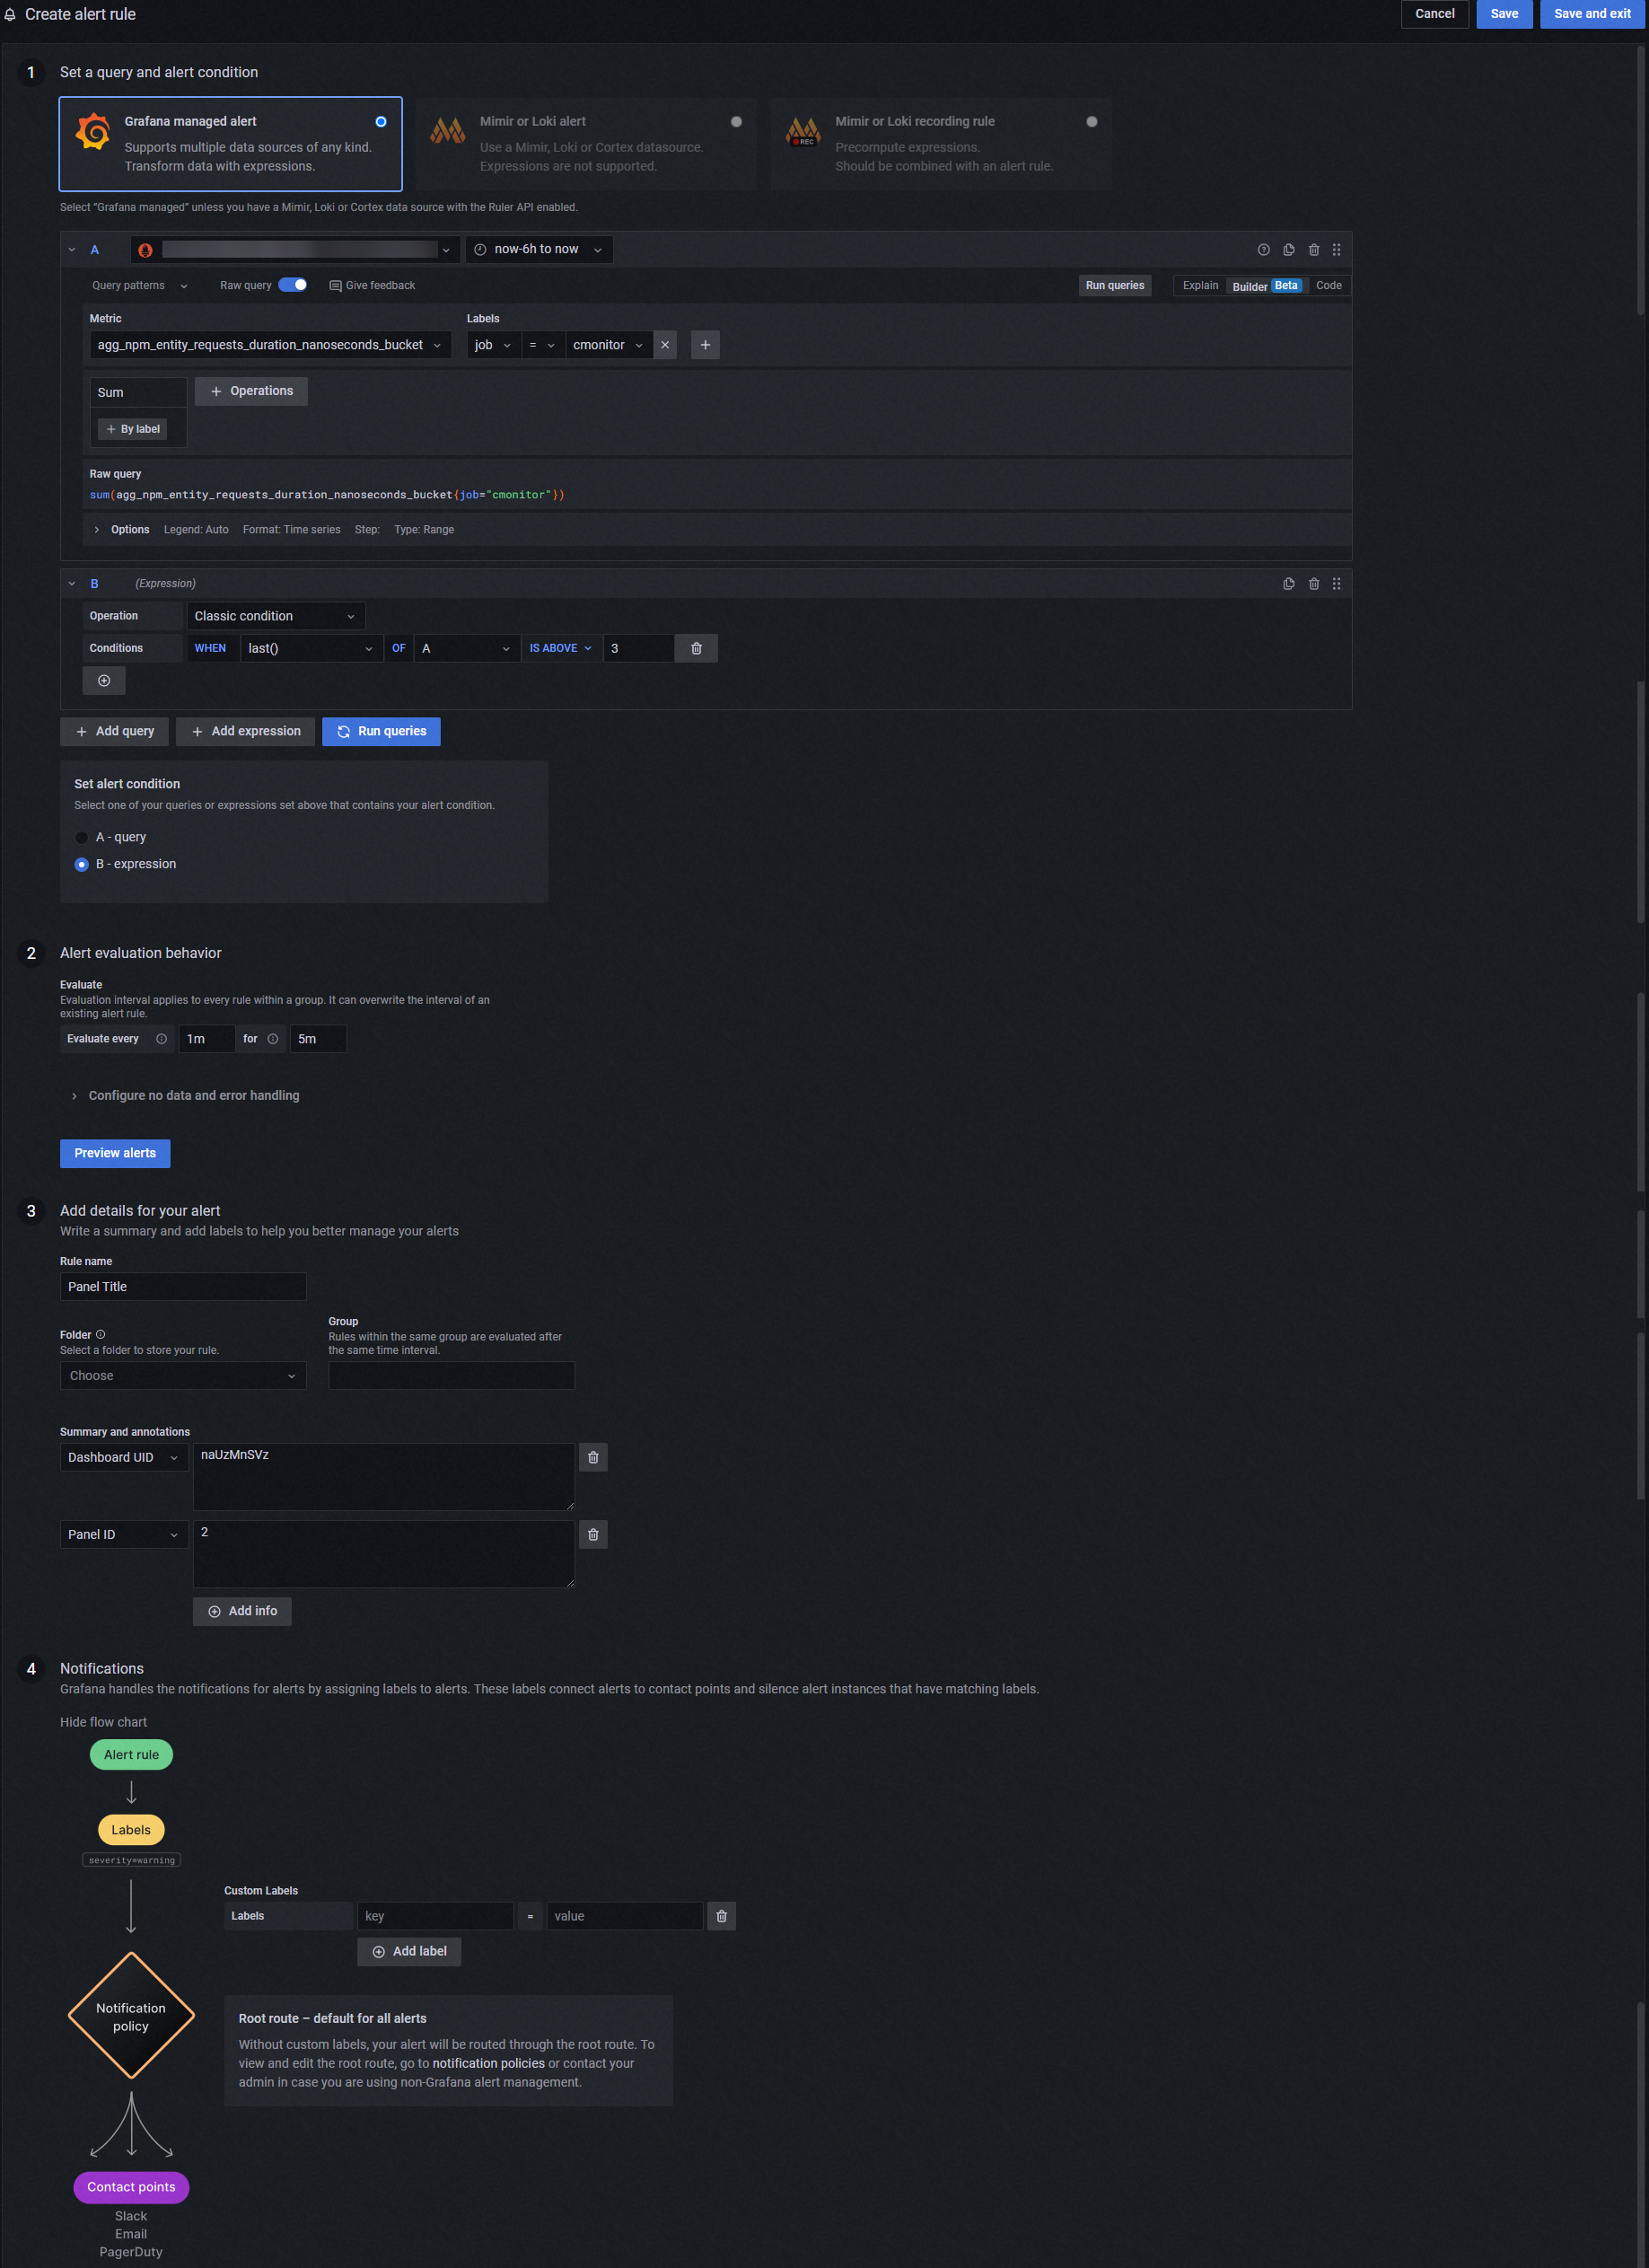
Alert rule creation
Create alert rules in two ways:
Panel-bound: Create an alert rule inside a panel and link it to the dashboard by configuring the Dashboard UID and Panel ID parameters.
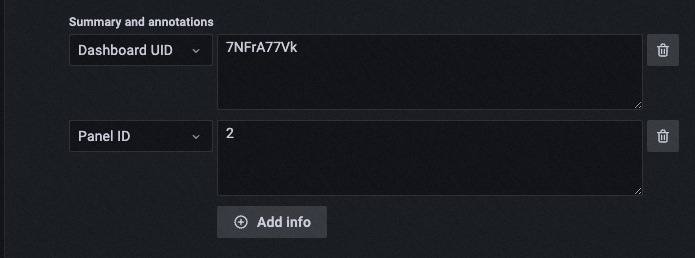
Standalone: Create an alert rule independently, without linking it to any dashboard.
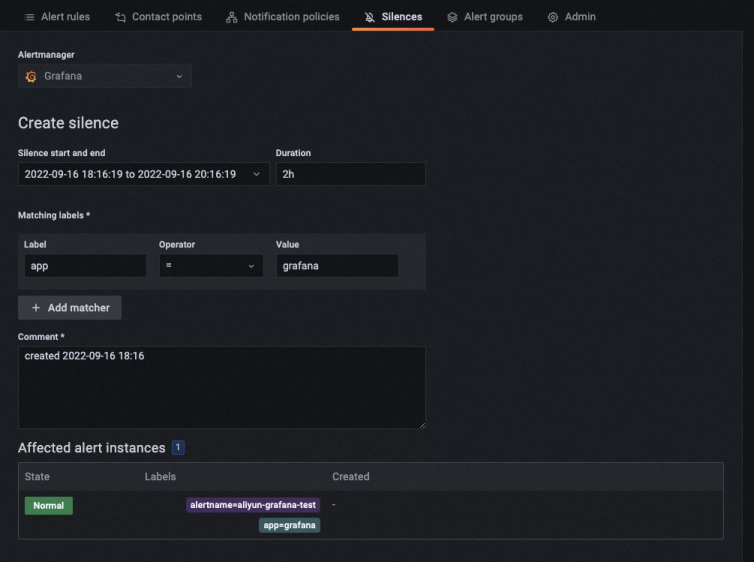
Notification policies and silences
Use Notification Policies to route alerts to the right channels. Set the Matching labels parameter to associate alert rules with specific notification methods.
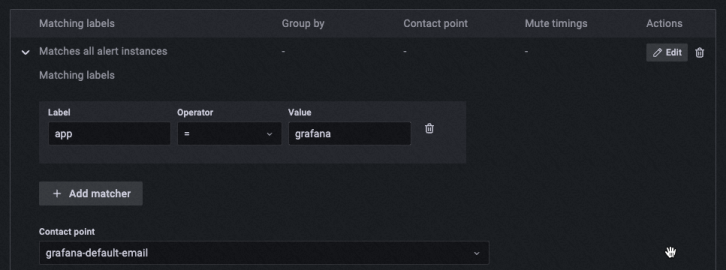
To suppress noisy alerts, configure rules in the Silences section.