Grafana V11.x introduces substantial improvements across dashboards, data exploration, alerting, and enterprise capabilities. Highlights include:
Separate View and Edit modes for cleaner dashboards
Query-free exploration of Prometheus metrics and Loki logs through Explorer Metrics and Explorer Logs
Redesigned alerting with simplified rule creation and Role-Based Access Control (RBAC) support
Faster PDF exports -- an SLO dashboard with approximately 200 panels exports in 11 seconds instead of over 7 minutes
This topic covers selected updates in Grafana V11.x. For the complete list, see What's new in Grafana v11.2 in the Grafana documentation.
Dashboards and visualization
Grafana V11.x redesigns the dashboard architecture for a more stable, dynamic, and flexible experience.
View mode and Edit mode
Dashboards now separate viewing from editing. In View mode, dashboards display a clean interface without editing controls. Switch to Edit mode to access options such as adding panels and changing settings.
View mode

Edit mode

Template variables and time picker
The time picker has moved from the toolbar into the dashboard variable bar. Both the time picker and template variables now stick to the top of the page as you scroll.

Timezone URL parameter
A new timezone URL parameter lets you set the dashboard timezone directly through the URL.
Dashboard controls in TV mode and Kiosk mode
When playing a playlist or displaying a dashboard in full screen (TV mode or Kiosk mode), use the following URL parameters to show or hide controls:
| Parameter | Description |
|---|---|
_dash.hideTimePicker | Hides the time and refresh picker |
_dash.hideVariables | Hides variables and annotation controls |
_dash.hideLinks | Hides dashboard links |

Subfolders
Generally available in all editions of Grafana 11.
Create subfolders in any folder where you have edit or manage permissions -- no additional permissions required. Subfolders support:
Folder browsing

Folder moving
Permission management -- grant users the minimum necessary permissions to keep your instance secure.

Library panels and overrides
Several UI changes improve the panel editing experience:
The library panel tab has been removed.


V11.3.0: An Overrides tab now appears at the bottom of the panel options list.


V11.3.0: A drop-down menu collapses the visualization picker.


V11.3.0: The Share button is now visible in Edit mode.
In Cell Inspect, table cell values are automatically formatted.

Transformations
Grafana V11.x adds new transformations and more intuitive interaction modes for data manipulation.

Template variable support
Template variables are now supported in the following transformations: Limit, Sort by, Filter data by values, Grouping to matrix, Heatmap, and Histogram.
Filter data by values
Filter rows by adding a condition: select a field, choose a matcher, and enter the string to match.

Transpose
Pivot a data frame by converting rows into columns and columns into rows. This transformation is useful for data sources that do not support pivot queries.

Group to nested tables
Group table data by specified fields and run calculations on each group, adding depth to table visualizations.
Format string
Generally available.
The Format string transformation standardizes string data by formatting it to upper, lower, or title case.

Add field from calculation
Generally available.
The Add field from calculation transformation supports a new All Number Fields option when setting up a binary operation -- for example, dividing each column by a specific value.

Panels
Grafana V11.x updates multiple panel types including Business Charts, Table, Stat, GeoMap, Bar gauge, State timeline, and XY chart.
Plugin details page
The plugin details page has been redesigned to highlight important metadata, including richer icon visualizations for Business Charts (Apache ECharts).


AI-powered enhancement (LLM plugin)
Generate panel and dashboard titles and descriptions using generative AI. Before using this feature, enable and configure the Grafana LLM plugin.
Install the LLM plugin

Generate a title and description

Data links and actions
A new Data links and actions section in the panel options lets you add actions that each call an API endpoint.
The following visualizations support actions: Bar chart, Candlestick, Heatmap, State timeline, Status history, Time series, Trend, and XY chart.
Data links and actions

Edit an action

Canvas
The Canvas visualization now supports flowcharting, universal data links, and infinite panning.
Enhanced flowcharting
New elements: cloud, parallelogram, and triangle.
Midpoint controls for non-straight connectors.
Additional connector styles: dashed lines, corner radius, and direction control.
Horizontal and vertical snapping for connectors.
Rounded corner styling for elements.
Element rotation.

Infinite panning
Zoom in and out of canvases freely.
Enable the canvasPanelPanZoom feature toggle to use this feature.
Universal data link support
Before V11.x, data links were limited to text elements or elements using the TextConfig object. Now, almost all canvas elements support data links and actions.


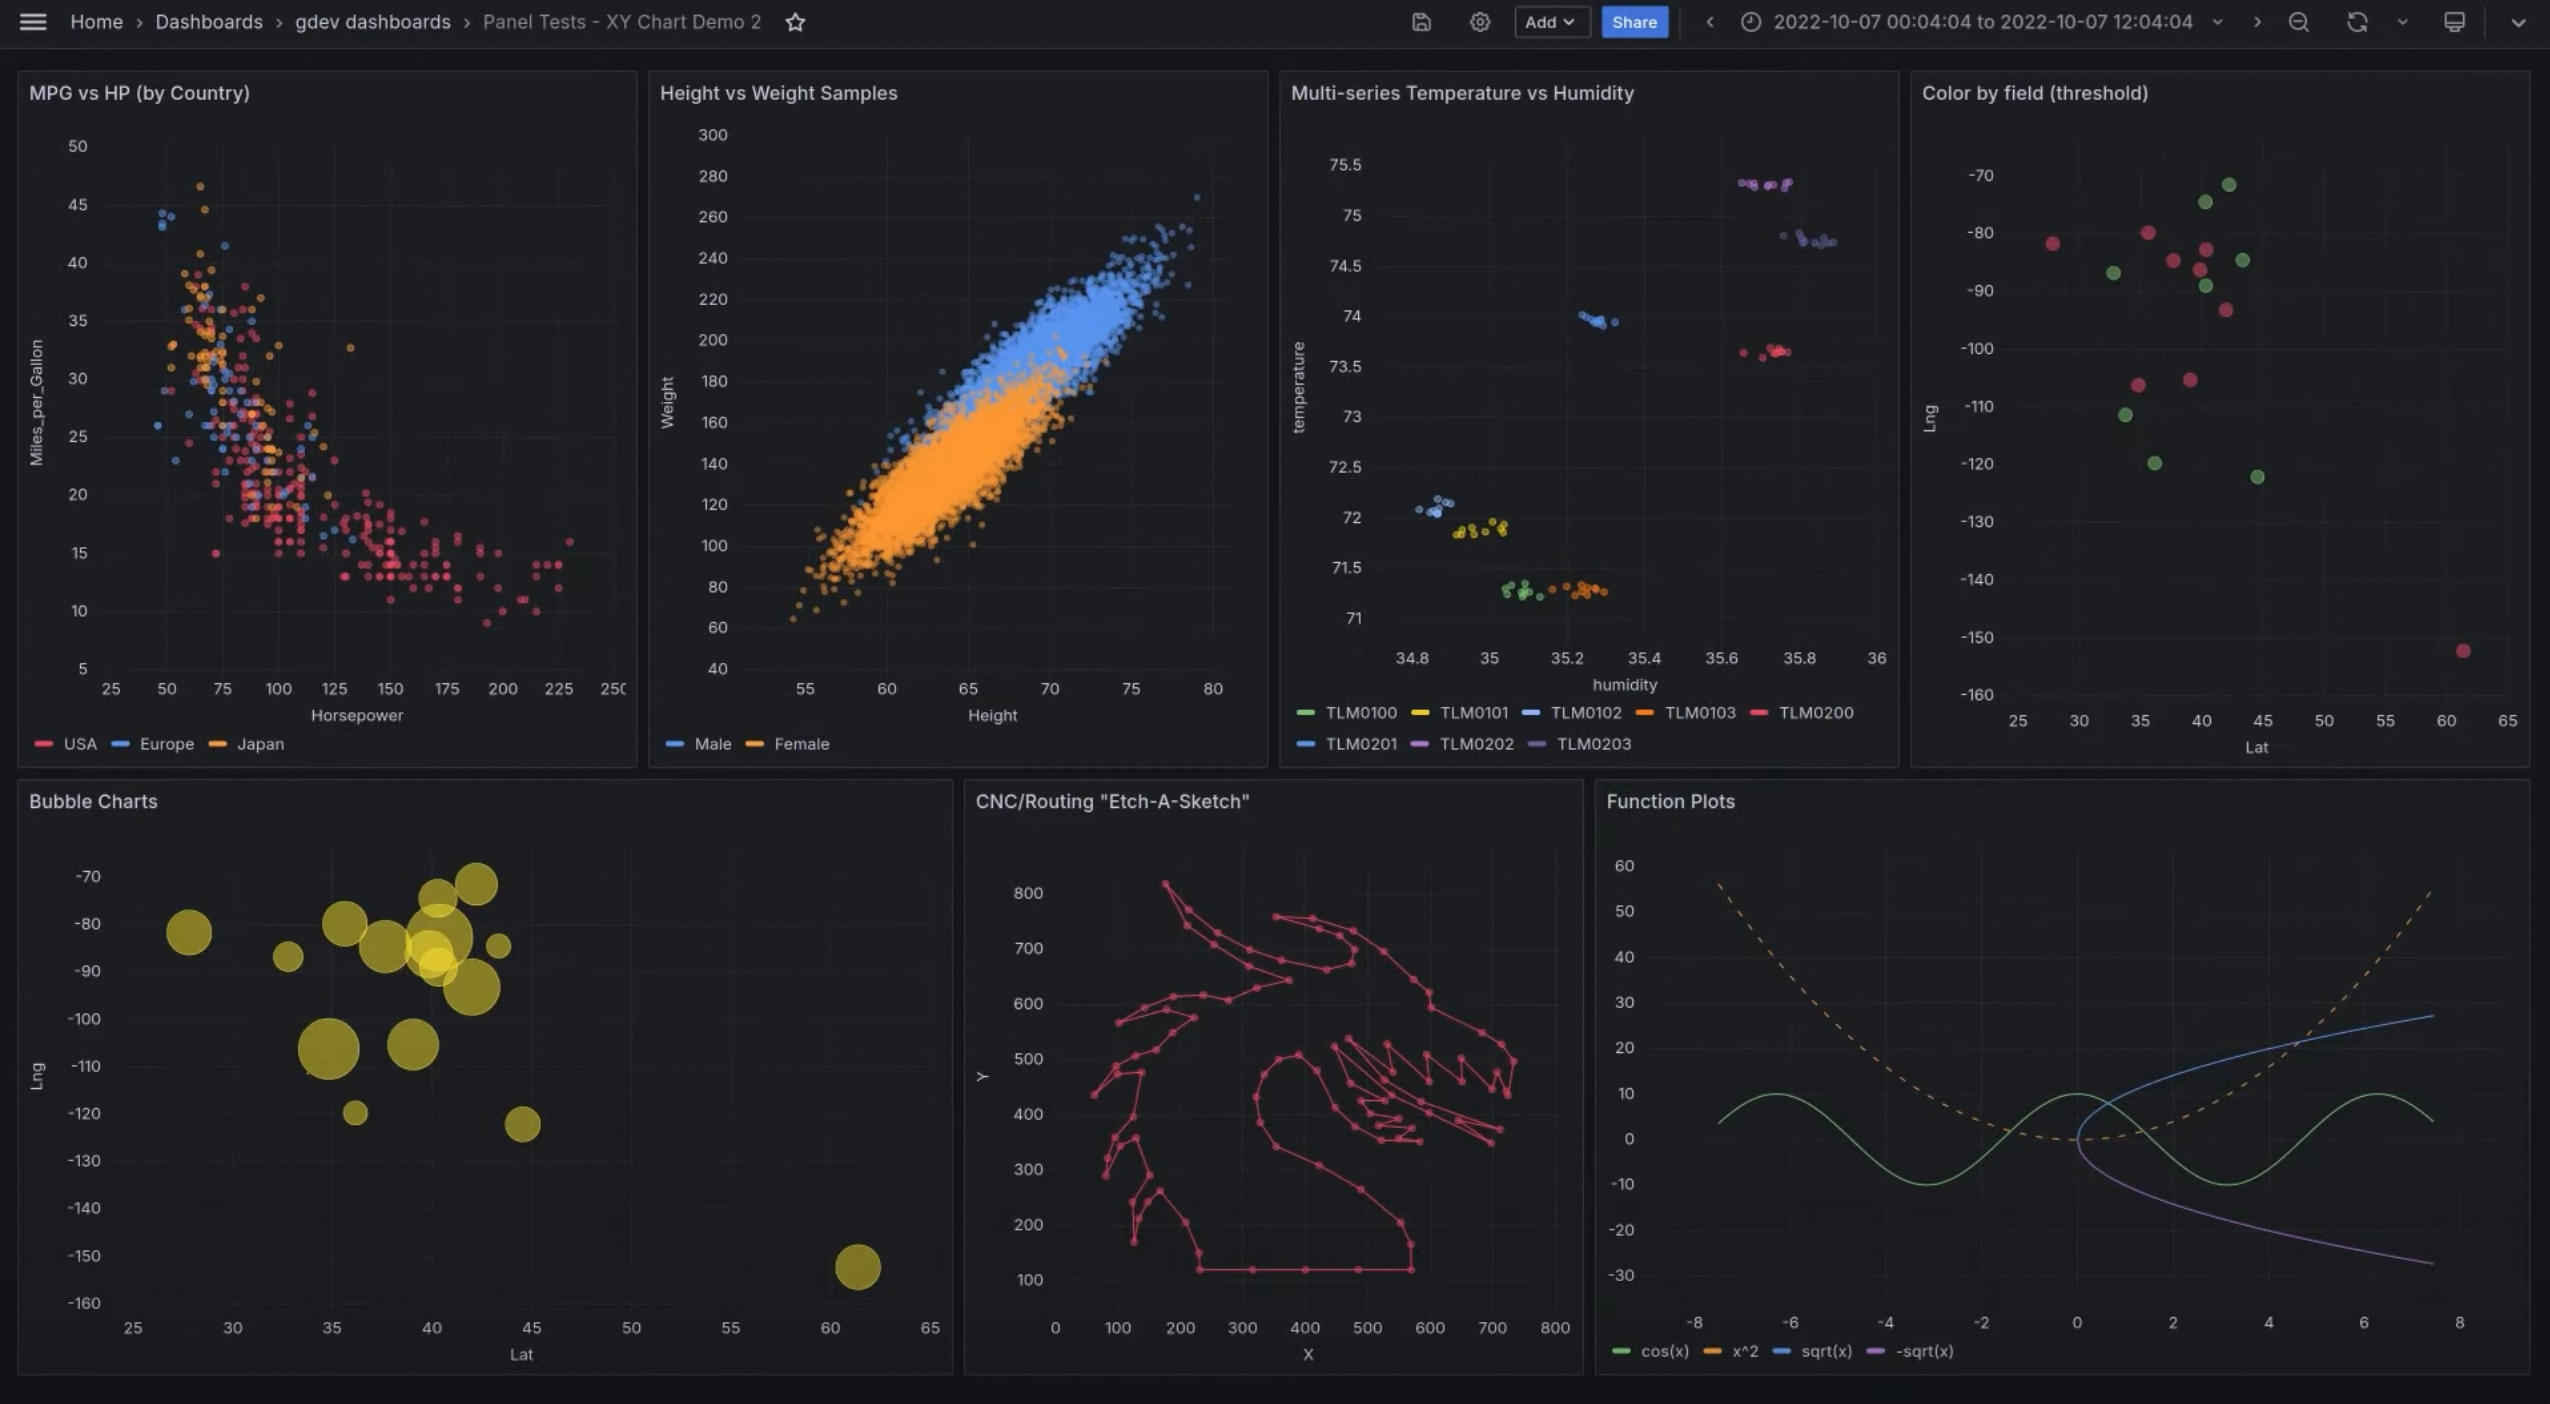
XY chart
Generally available. Enable the autoMigrateXYChartPanel feature toggle to use XY chart.XY charts plot arbitrary x and y values, making them suitable for scatter plots and bubble charts where field values determine bubble size.


Sample XY chart:
Table
Colored rows with conditional formatting
Color full table rows using the Colored Background cell type.

Map status fields (such as
info,debug, orwarning) to colors, and color rows based on thresholds.

When thresholds are set, the field background displays the corresponding threshold color.

Cell text wrapping
Grafana V11.1 adds text wrapping within table cells, either for all columns or specific columns.
All columns

Specific columns

Stat
The Stat visualization supports a new percent change color option.


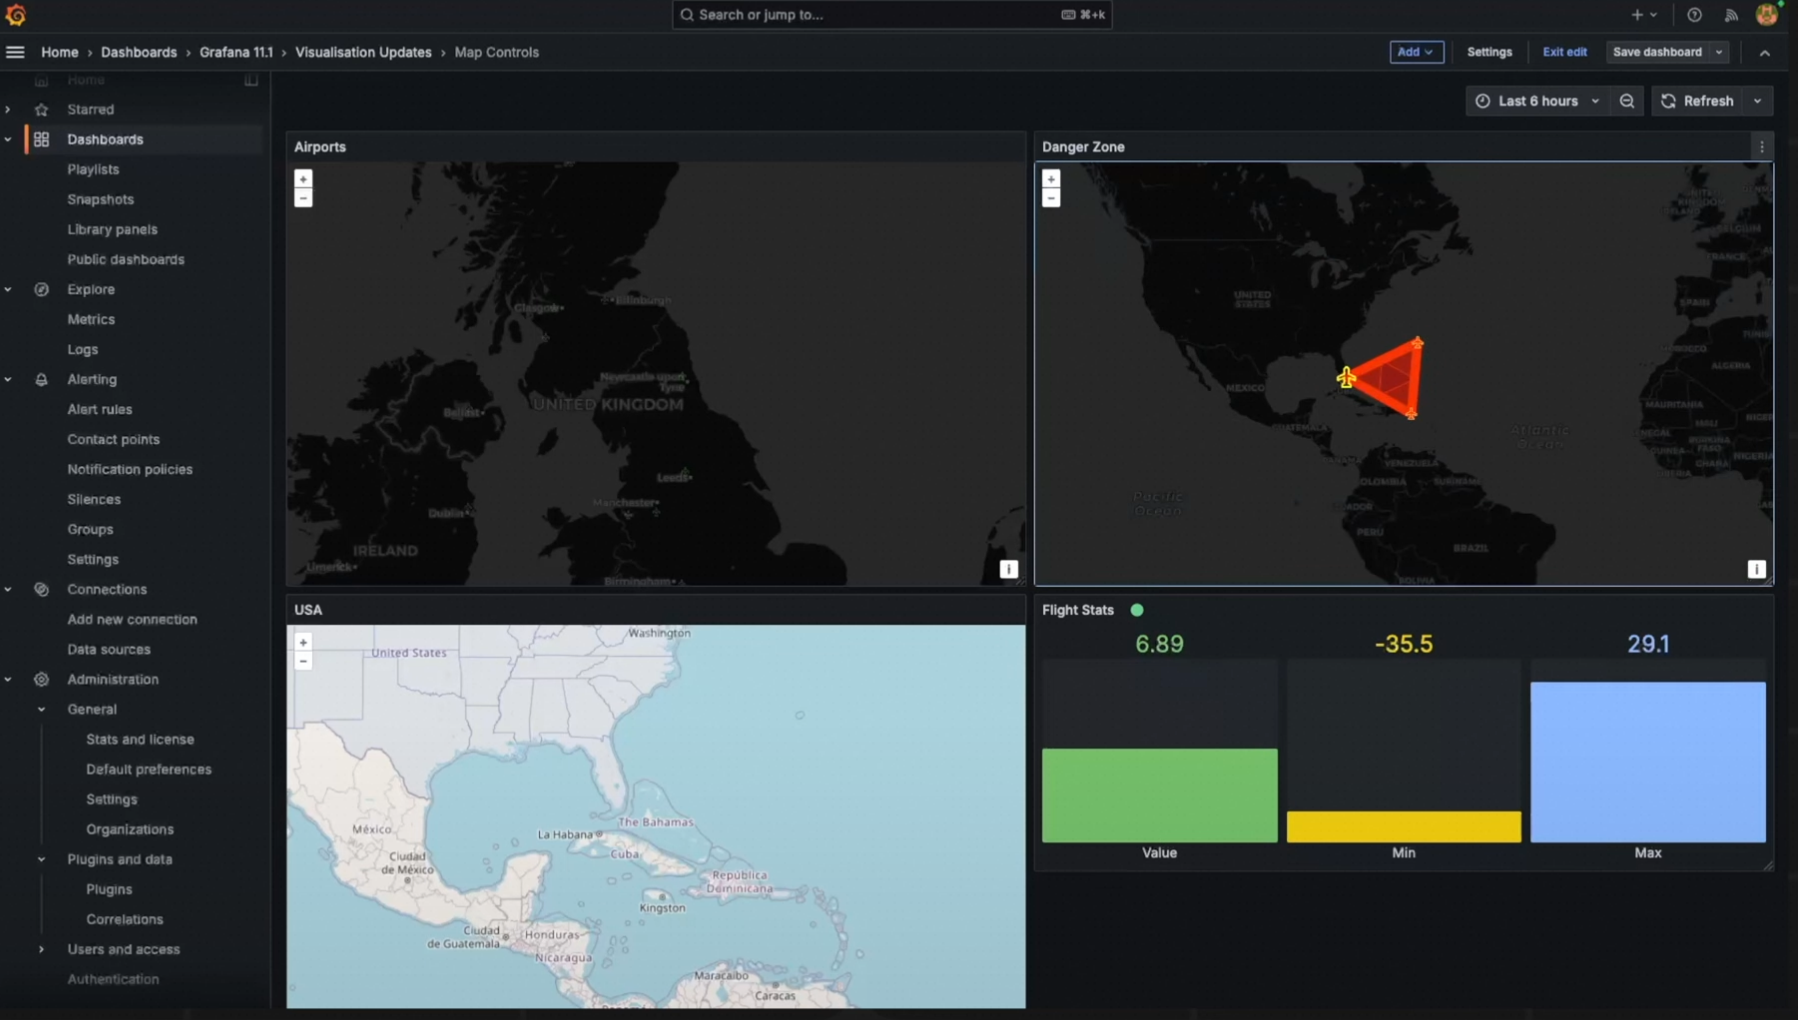
GeoMap
GeoMap now supports keyboard navigation. Focus on the map area, move with arrow keys, and zoom with + and -.

State timeline
State timeline now supports pagination through the Page size option, limiting the number of visible series per page. Previously, all series were compressed into a single panel, making them difficult to read.


Bar gauge
Generally available.
Bar gauge now includes legend support, standardizing legends across more panel types.

Data sources
Authorization
Data sources now support authorization by role, user, service account, and team.

CloudWatch Metric Insights cross-account support
The Metric Insights query builder for the AWS CloudWatch plugin supports cross-account querying. Build SQL queries that monitor across multiple accounts in the same AWS region.

New data source plugins
Zendesk, Catchpoint Enterprise, and Yugabyte data sources are now available in Grafana V11.x.
GitHub App authentication
The GitHub data source supports GitHub App authentication, providing more granular permissions and reducing the risk of over-permissioning. For details, see the GitHub data source documentation.

Explore
In addition to the existing Explore feature, Grafana V11.x adds separate menus for Explorer Metrics, Explorer Logs, Explorer Traces, and Explorer Profiles.

Explorer Traces and Explorer Profiles are not visible in Grafana V11.3.x.
Core Explore updates
A left-side navigation menu for quick positioning.
Forward-direction search for Loki logs -- browse logs in chronological order within a time range.

Correlations -- set up links between data sources to navigate to external URLs based on search results.

Explorer Metrics
Browse Prometheus metrics without writing PromQL queries.
Recent metrics and bookmarks
Return to previously viewed metrics or bookmarked favorites.

Metric filtering by data source
Select a data source on the Metrics page to view or filter its metrics.

History
Navigate through historical metrics and filters.
Metric analysis
Select a metric to view its summary, drill-down data, and related metrics on the detail page.
Drill down

Related metrics

Explorer Logs
Browse Loki logs without writing LogQL queries.
View log volume and log line samples when you first open Explorer Logs.
Filter logs to isolate noise or focus on anomalies -- no LogQL required.
Power users can switch to the familiar Explore interface while preserving context.

Alerting
Grafana V11.x redesigns the alerting experience with a streamlined settings page, simplified rule creation, and broader RBAC support.
Alertmanager settings
The Alertmanager settings page has been reorganized with clearer sections:
Alert settings

Alertmanager configuration

Configuration comparison

OAuth2 for contact points
Contact points now support OAuth2 authentication, in addition to Basic Auth and TLS.

Alerting template selector
Select templates to simplify sending alert notifications.
Simplified query and conditions
Alert rule creation now offers a simplified interface for queries and conditions. Switch to advanced options to add multiple queries and expressions.
Enable the alertingQueryAndExpressionsStepMode feature toggle to use this feature.
Redesigned execution and notification settings
Alert rule execution and notification settings have been redesigned for clarity.
Alert rule detail view
The alert rule detail view has been redesigned with improved paused-alert visibility and metadata displayed at the top. Tabs below provide:
Query and conditions: View the query details used for the alert rule.
Instances: Explore each alert instance with its status, tags, and metadata.
History: Browse the recorded history for an alert rule.
Details: Debug or audit using alert rule metadata (such as rule ID) and view annotations.


Keep Last State
The alert history now shows a bar chart of recent events with per-alert state visibility. Use the Keep Last State option to preserve the most recent state of an alert rule.


Role-based access control (RBAC)
Contact points, silences, and notifications now support RBAC.

Foundational capabilities
LDAP management in the UI
Configure LDAP settings directly from the Grafana UI.
Enable the alertingQueryAndExpressionsStepMode feature toggle to use this feature.
Navigation bookmarks
Pin your favorite pages to the top of the navigation bar for quick access.
Enable the pinNavItems feature toggle in Grafana V11.2 or later to use this feature.
Other updates
Additional improvements include:
Refined title display across the UI.
Reduced transitions and animations for a snappier feel.
Anonymous user billing in Grafana Enterprise.
A new strong password policy.

Enterprise capabilities
Announcement banners
Display customizable banners in the Grafana UI to broadcast critical information to all users.
Available in public preview in Grafana Cloud and Grafana Enterprise.
For self-managed Grafana, enable the notificationBanner feature toggle in Grafana V11.3 or later.
PDF export
Dashboard PDF exports are dramatically faster -- an SLO dashboard with approximately 200 panels that previously took over seven minutes now exports in eleven seconds.
Available in public preview in Grafana Cloud and Grafana Enterprise.
Enable the newPDFRendering feature toggle to use this feature.
Grafana Cloud Migration Assistant
Migrate from self-managed Grafana (OSS or Enterprise) to Grafana Cloud through a guided interface that automates resource migration, eliminating manual HTTP API calls.
Start the migration and create a token.

Complete the migration.
Available in public preview in Grafana Open Source and Grafana Enterprise.
