When multiple teams need visibility into Grafana dashboards but not everyone has workspace access, sharing live links is impractical. Data reports in Managed Service for Grafana let you export any dashboard as an image snapshot, either on demand or on a recurring weekly schedule delivered by email.
Prerequisites
Before you begin, make sure that you have:
A Managed Service for Grafana workspace running Pro Edition or Advanced Edition
The dashboard URL you want to export
The Developer Edition does not support data reports. Upgrade to Pro or Advanced Edition before proceeding.
Access the data reports page
Log on to the ARMS console.
In the left-side navigation pane, choose Managed Service for Grafana > Workspace Management.
On the Workspace Management page, click the ID of the workspace you want to manage.
In the left-side navigation pane, choose Advanced Features > Data Reports.
Export a report on demand
Use the Export Report tab to generate a one-time image snapshot of any dashboard.
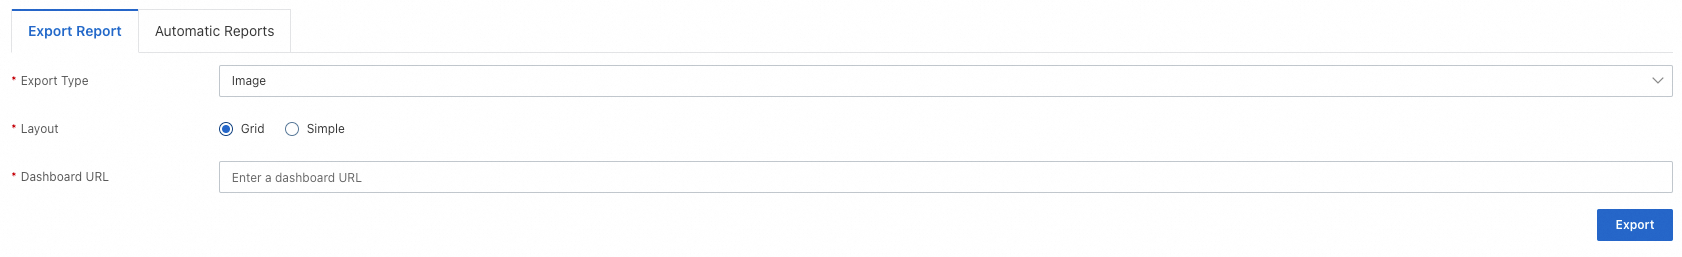
| Parameter | Description |
|---|---|
| Export Type | Output format. Currently only image export is supported. |
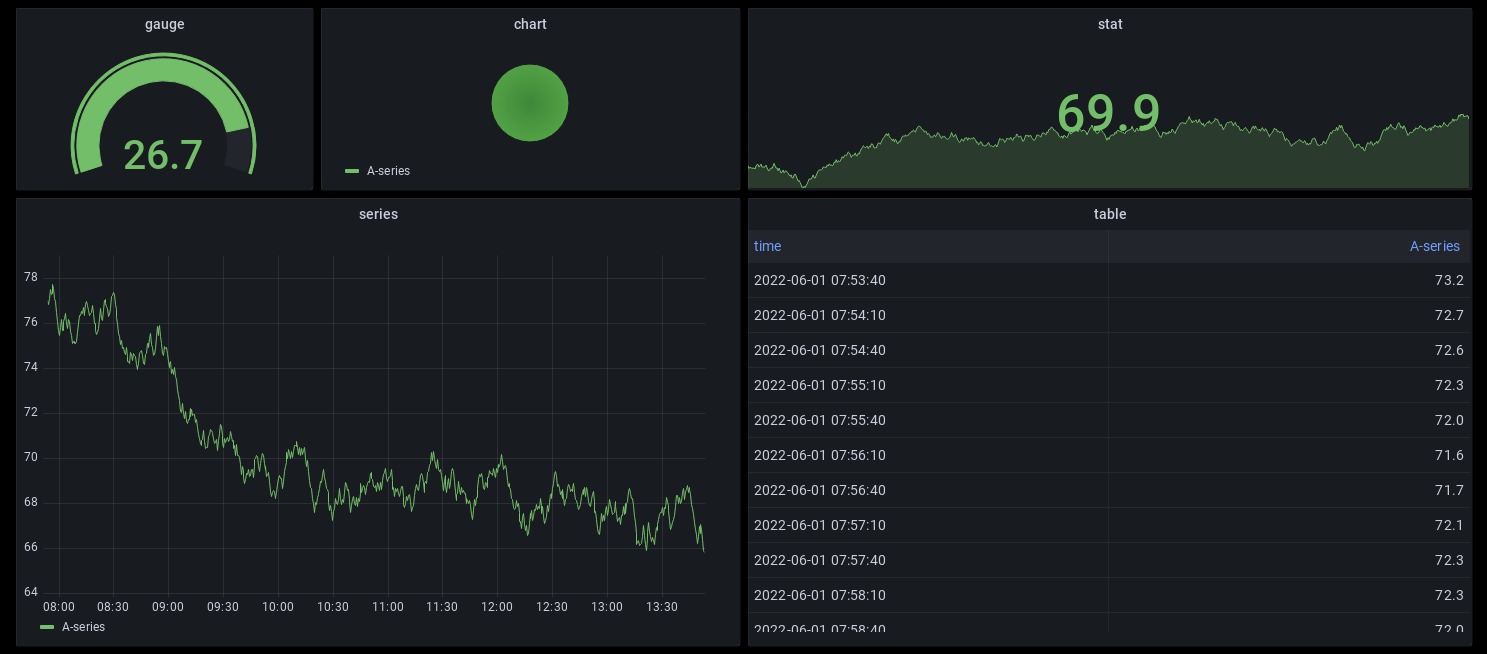
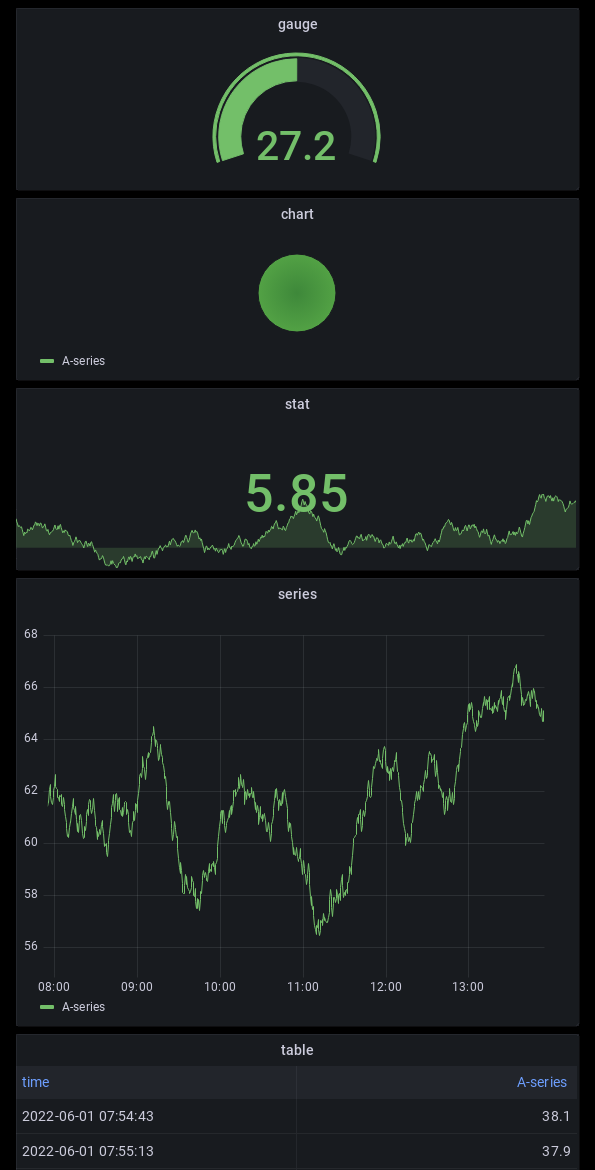
| Layout | Panel arrangement in the exported image:
|
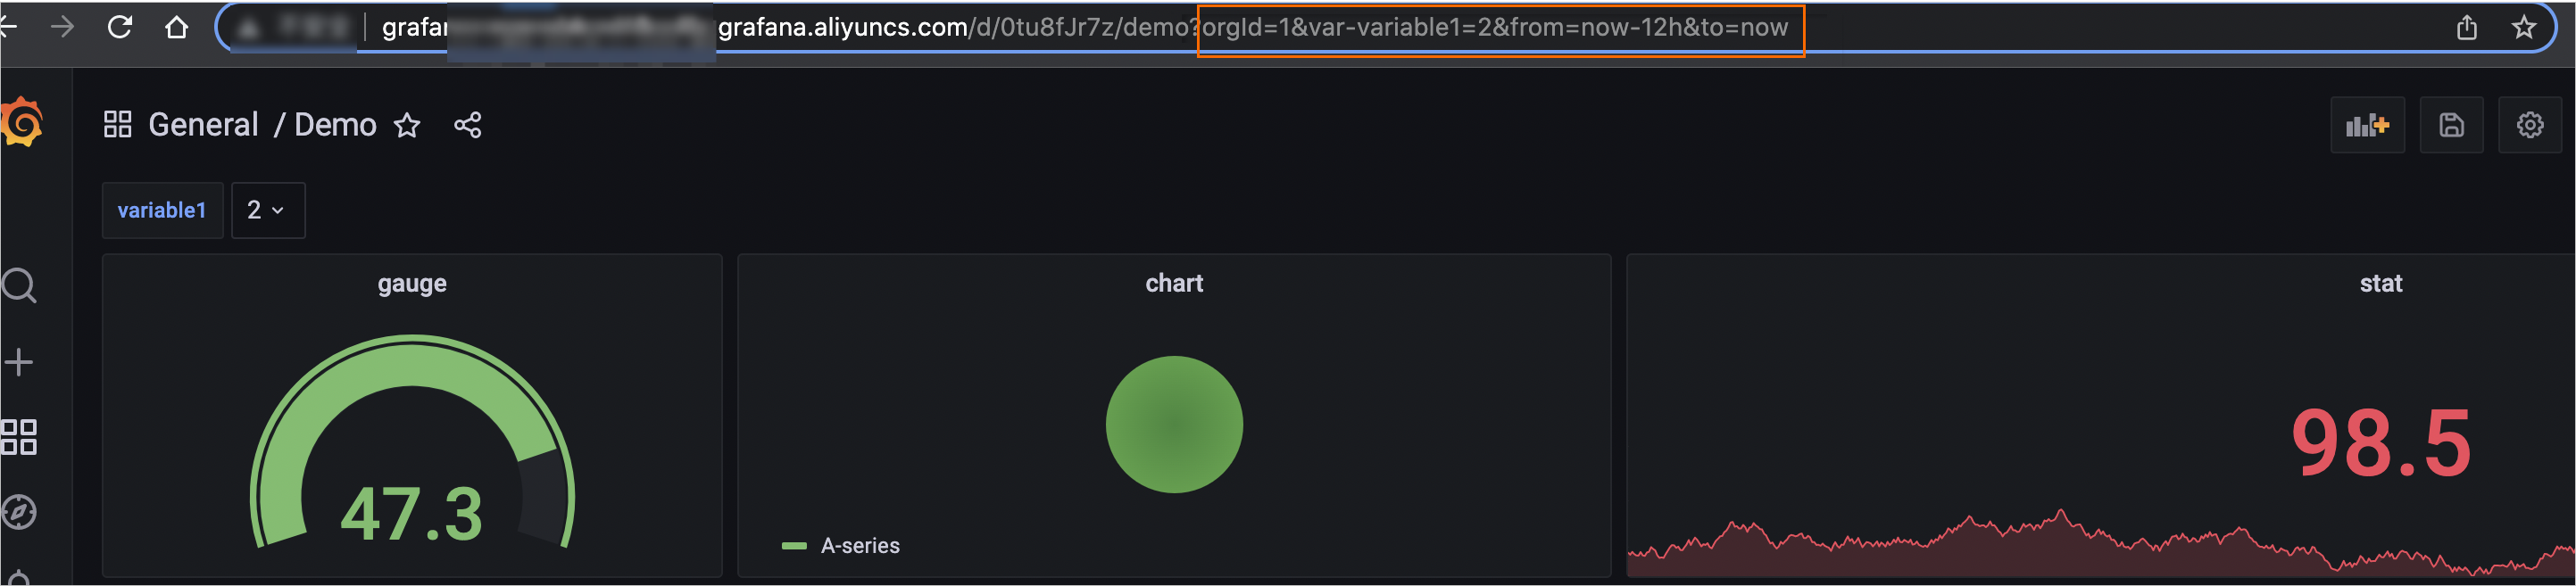
| Dashboard URL | Full URL of the dashboard to export. Copy it from the browser address bar. The URL includes query parameters and time range settings that determine the data shown in the report. 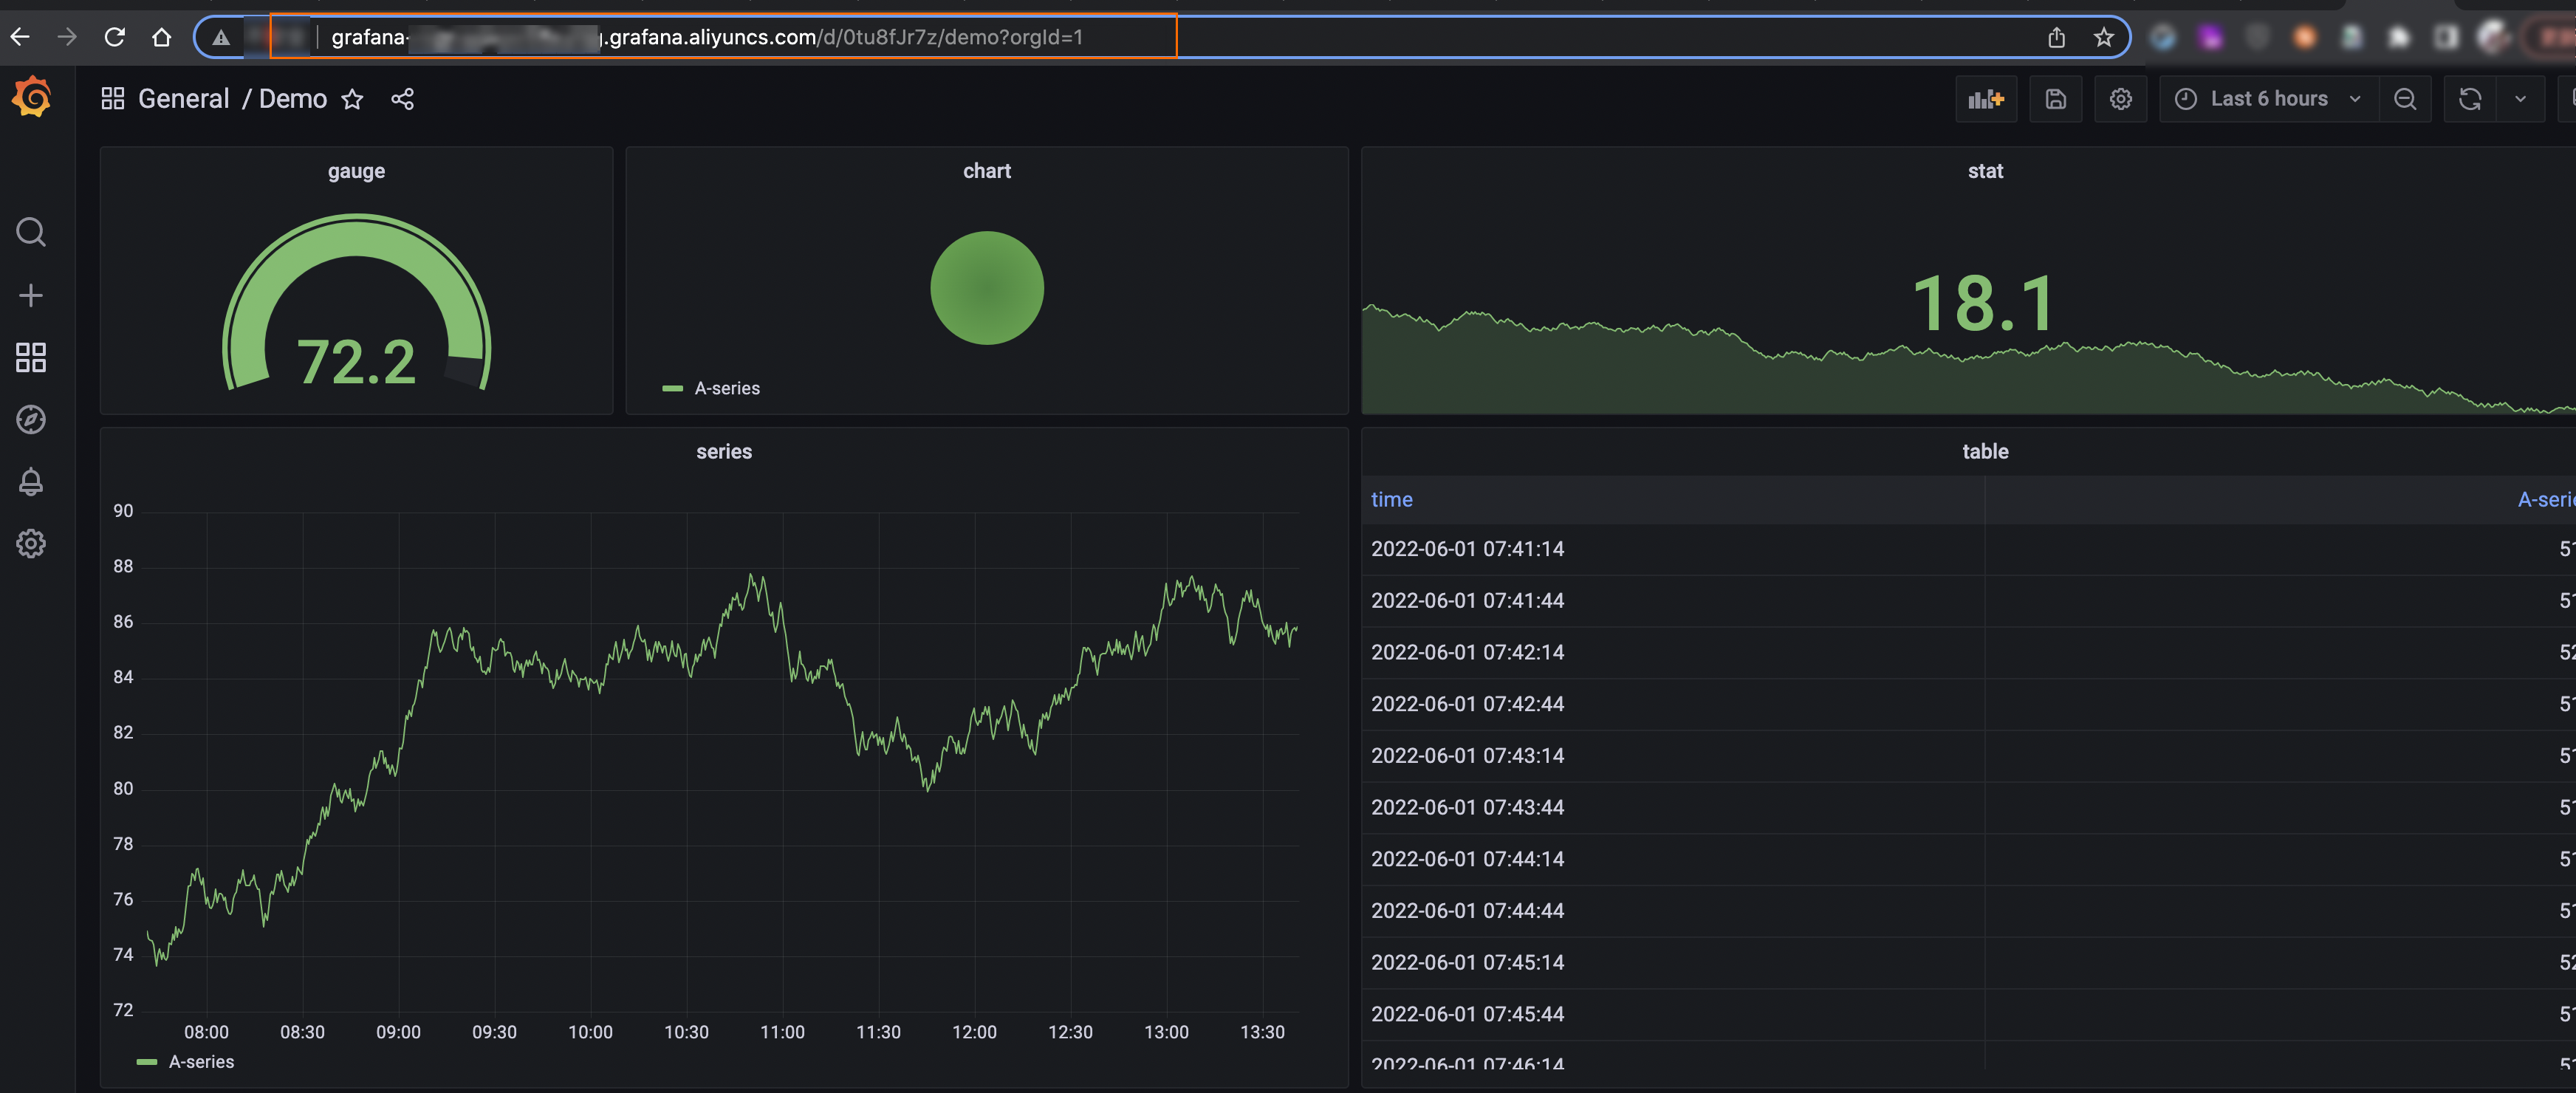 |
If the dashboard takes too long to render, the export may be canceled. See Optimize dashboard rendering for guidance.
Schedule automatic reports
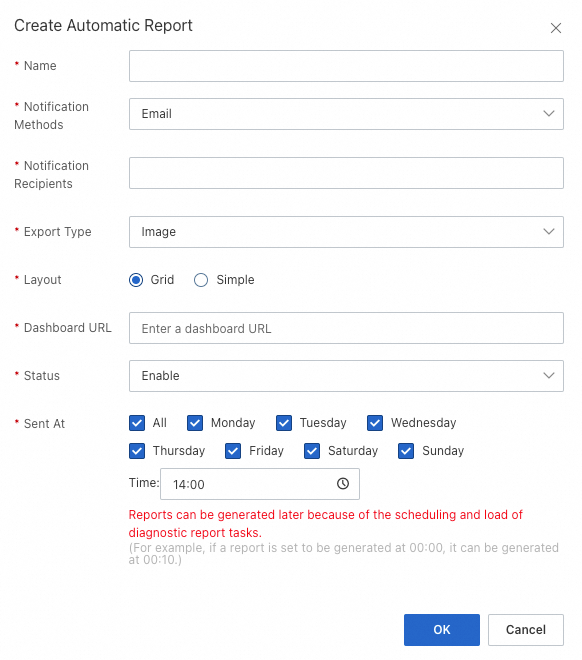
Automatic reports deliver dashboard snapshots to specified email addresses on a recurring weekly schedule. You can create up to five scheduled tasks per workspace.
Before creating a scheduled report, export the dashboard on demand first to verify that it renders correctly and the output matches your expectations.
To create a scheduled report:
On the Data Reports page, click the Automatic Reports tab.
Click Create Automatic Report.
Configure the following parameters.
| Parameter | Description |
|---|---|
| Name | A descriptive name for the scheduled task. |
| Notification Methods | Delivery channel. Currently only email is supported. |
| Notification Recipients | One or more email addresses, separated by commas (,). |
| Export Type | Output format. Currently only image export is supported. |
| Layout | Grid (desktop layout) or Simple (mobile phone display). |
| Dashboard URL | Full URL of the dashboard to export. Copy it from the browser address bar, including query parameters and time range settings. The URL captures the exact filters and time window for the report. See Optimize dashboard rendering for rendering guidance. |
| Status | Enable or disable the scheduled task. |
| Sent At | Delivery schedule. Reports are sent weekly at the configured time. The actual send time may vary by a few minutes. |
Manage scheduled tasks
After you create a scheduled report, it appears on the Automatic Reports tab.
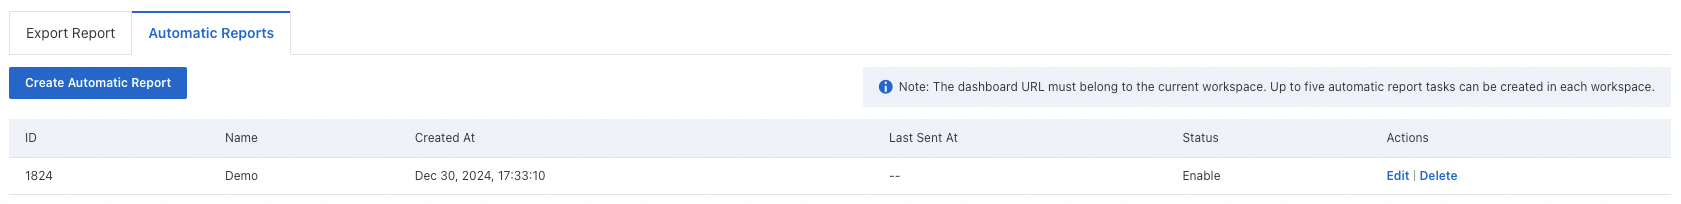
From this list, you can:
Monitor the status of each scheduled task.
Click Edit to disable a task.
Optimize dashboard rendering
Both on-demand and scheduled exports render the target dashboard as an image. The rendering timeout is 5 minutes. If a dashboard exceeds this limit, the system may cancel the export.
To produce reliable exports:
Configure the query parameters reasonably to ensure the dashboard loads within 5 minutes.
Target a load time under 30 seconds for optimal performance.
The dashboard URL captures your current query parameters and time range. Make sure the URL reflects the exact filters and time window you want in the exported report.
Limits
| Item | Limit |
|---|---|
| Maximum scheduled tasks per workspace | 5 |
| Dashboard rendering timeout | 5 minutes |
| Recommended dashboard load time | Under 30 seconds |
| Supported export format | Image only |
| Supported notification channel | Email only |
| Report scheduling frequency | Weekly |