Grafana alert rules periodically query your data sources and check conditions. When a threshold is breached, an alert fires and sends a notification to your team through the configured channel, helping you detect and resolve issues before they affect users.
The alerting model differs between Grafana versions:
| Version | Alert rules | Notifications |
|---|---|---|
| 8.2.x and earlier | Tied to dashboard panels | Sent through notification channels |
| Later than 8.2.x | Standalone resources | Sent through contact points, routed by notification policies based on labels |
Choose the section that matches your Grafana version:
Grafana 8.2.x and earlier -- Panel-based alert rules with notification channels.
Grafana later than 8.2.x -- Standalone alert rules with contact points and notification policies.
Prerequisites
Before you begin, make sure you have:
An Alibaba Cloud account with access to the ARMS console
A Managed Service for Grafana workspace
The Grafana administrator account credentials, or an Alibaba Cloud account with permissions to access the workspace
Grafana 8.2.x and earlier versions

Step 1: Log on to Grafana
Log on to the ARMS console. In the left-side navigation pane, choose Managed Service for Grafana > Workspace Management.
On the Workspace Management page, find your workspace and click the URL in the URL column to open Grafana.
Log on with the Grafana administrator account and the password set during workspace creation, or click Sign in with Alibaba Cloud to use your Alibaba Cloud account.
Step 2: Create a notification channel
A notification channel defines where alert notifications are sent (for example, a DingTalk chatbot, a webhook endpoint, or an email address).
In the left-side navigation pane, click
 and select Notification channels.
Click New channel and configure the following parameters.
Parameter Description Name The channel name. Type The notification method. Supported types include DingTalk, webhook, and email. Addresses The endpoint for notifications. For example, enter the webhook URL of a DingTalk chatbot. For more information, see Obtain the webhook URL of a DingTalk chatbot. 
Step 3: Create an alert rule
In the left-side navigation pane, choose
 > Dashboard. Click Add an empty panel.
On the Query tab, select a data source and configure a query statement. Then switch to the Alert tab and click Create Alert.
Parameter Description Rule Name: The alert rule name. Evaluate Every: How often the rule is evaluated. Valid values: 1m,2m,5m. For: How long the condition must persist before the alert fires.Conditions The threshold conditions. For example, trigger an alert when the average value of Query A exceeds 600. No data and error handling Whether to send notifications when no data is returned or the query times out. Notifications Send to: The notification channel configured in Step 2. Message: The notification content. For supported expressions, see Message templating. Tags: Custom tags for the alert rule. 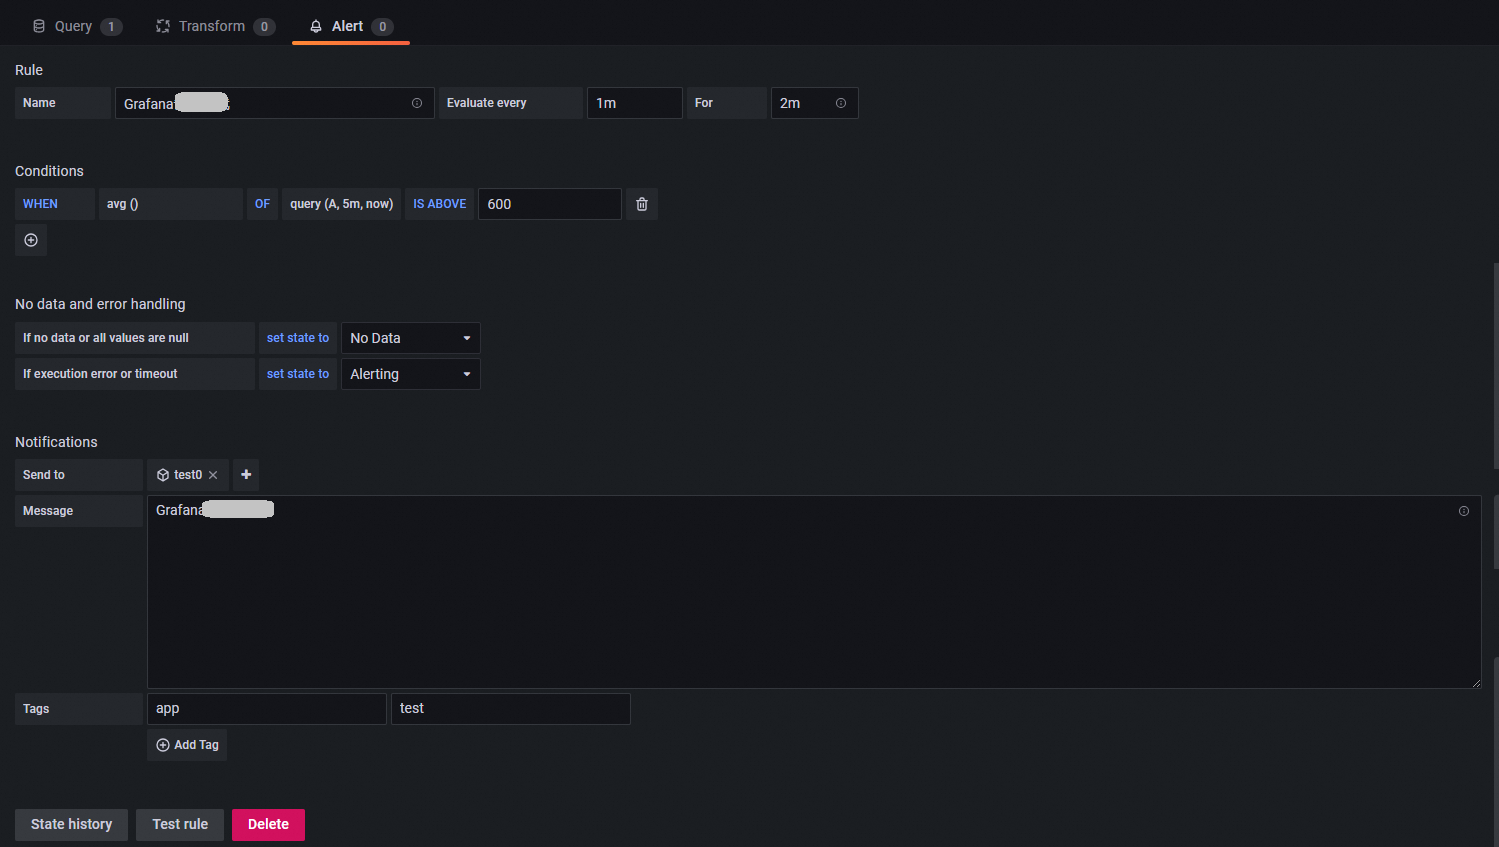
(Optional) Step 4: View the alert rule
In the left-side navigation pane, choose ![]() > Alert Rules to view the configured alert rule.
> Alert Rules to view the configured alert rule.
Grafana later than 8.2.x

The alerting UI differs slightly between Grafana 9.0.x and 10.0.x. The following steps use Grafana 9.0.x as an example. You can also create alert rules by adding an empty panel, as described in Step 3 of Grafana 8.2.x and earlier.
Step 1: Disable the ARMS alerting plug-in
Grafana native alerting and the ARMS alerting plug-in cannot run at the same time. Disable the plug-in before you proceed.
Log on to the ARMS console. In the left-side navigation pane, choose Managed Service for Grafana > Workspace Management.
On the Workspace Management page, click the ID of the workspace that you want to manage.
In the left-side navigation pane, click Alert Management. Disable the ARMS alerting plug-in and enable Grafana native alerting.
Step 2: Create an alert rule
On the Workspace Management page, find your workspace and click the URL in the URL column to open Grafana.
NoteLog on with the Grafana administrator account and the password set during workspace creation, or click Sign in with Alibaba Cloud to use your Alibaba Cloud account.
In the left-side navigation pane, choose
 > Alert rules. Click New alert rule or Create alert rule.
On the Create alert rule page, configure the following parameters and click Save.
Parameter Description Set a query and alert condition Define the query and the condition that triggers alerts. Query patterns: The query statements to evaluate. Operation: The condition type. Select Classic condition for compatibility with Grafana 8.2.x and earlier. Conditions: The threshold conditions. For example, trigger an alert when the average value of Query A exceeds 600. Alert evaluation behavior Evaluate Every: How often the rule is evaluated. Valid values: 1m,2m,5m. For: How long the condition must persist before the alert fires. Configure no data and error handling: Whether to send notifications when no data is returned or the query times out.Add details for your alert Rule Name: The alert rule name. Folder: The folder that stores the alert rule. Group: The group for the alert rule. Rules in the same group share an evaluation interval. Summary and annotations: A description of the alert, the associated dashboards, and the folder. Notifications Custom Labels: Labels for the alert rule. Notification policies use labels to route alerts to the correct contact point. 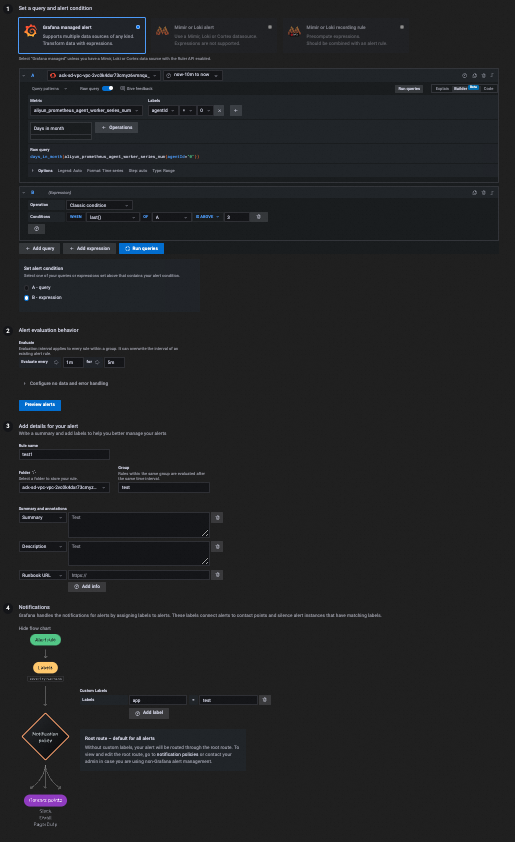
After saving, view the alert rule on the Alert rules page.
Step 3: Create a contact point
A contact point defines the notification destination. Grafana later than 8.2.x uses contact points instead of notification channels.
In the left-side navigation pane, choose
> Contact points.On the Contact points tab, click New contact Point or Add contact point.
Configure the following parameters.
Parameter Description Name The contact point name. Contact point type The notification method. Supported types include DingTalk, webhook, and email. Addresses The endpoint for notifications. For example, enter the webhook URL of a DingTalk chatbot. For more information, see Obtain the webhook URL of a DingTalk chatbot. (Optional) After you save the contact point, click Test to send a test notification and verify that the contact point is configured correctly.
Step 4: Create a notification policy
Notification policies route alerts to contact points based on label matching. If you assigned Custom Labels to your alert rules in Step 2, create a notification policy to route those alerts to the appropriate contact point.
In the left-side navigation pane, choose
> Notification policies.On the Notification policies tab, click New nested policy or New specific policy. Configure the following parameters.
Parameter Description Matching labels Labels that determine which alert rules this policy applies to. Contact point The contact point that receives alert notifications matched by this policy. 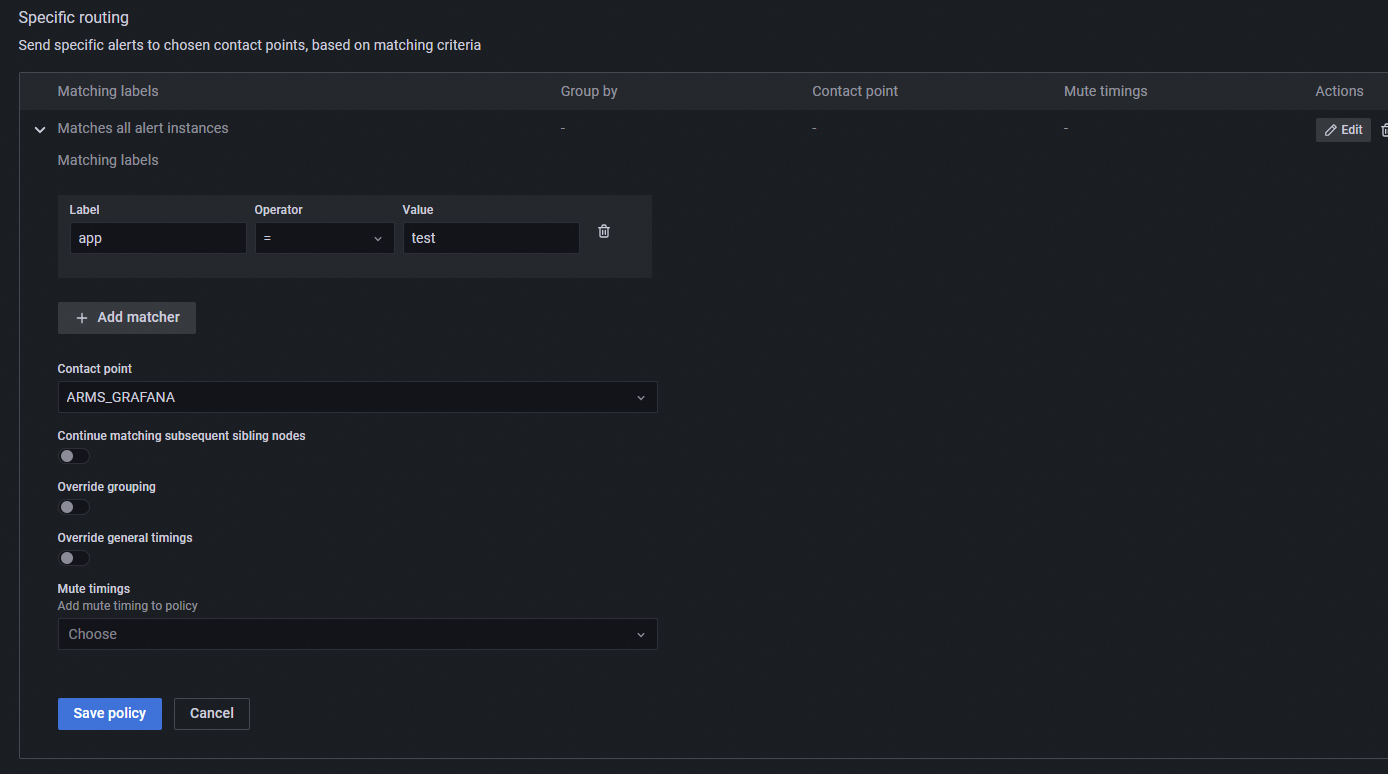
(Optional) Configure alert grouping, silences, and mute timings based on your requirements. Use silences to temporarily pause notifications during one-time events such as maintenance windows. Use mute timings to suppress notifications at regular intervals, such as evenings or weekends.
What's next
Message templating (Grafana 8.2.x and earlier)