A diagnostic report summarizes the data that is collected by browser monitoring in a period of time. The report analyzes and displays the website performance based on JavaScript (JS) error logs, the success rate of API requests, and the page loading speed. This helps you understand the key monitoring metrics for websites and resolve issues.
Procedure
Log on to the ARMS console. In the left-side navigation pane, choose .
On the Browser Monitoring page, select a region in the top navigation bar and click the name of the application that you want to manage.
- In the upper-right corner of the page, click One-click diagnosis.
- On the Diagnostic Report page, view the diagnostic report.
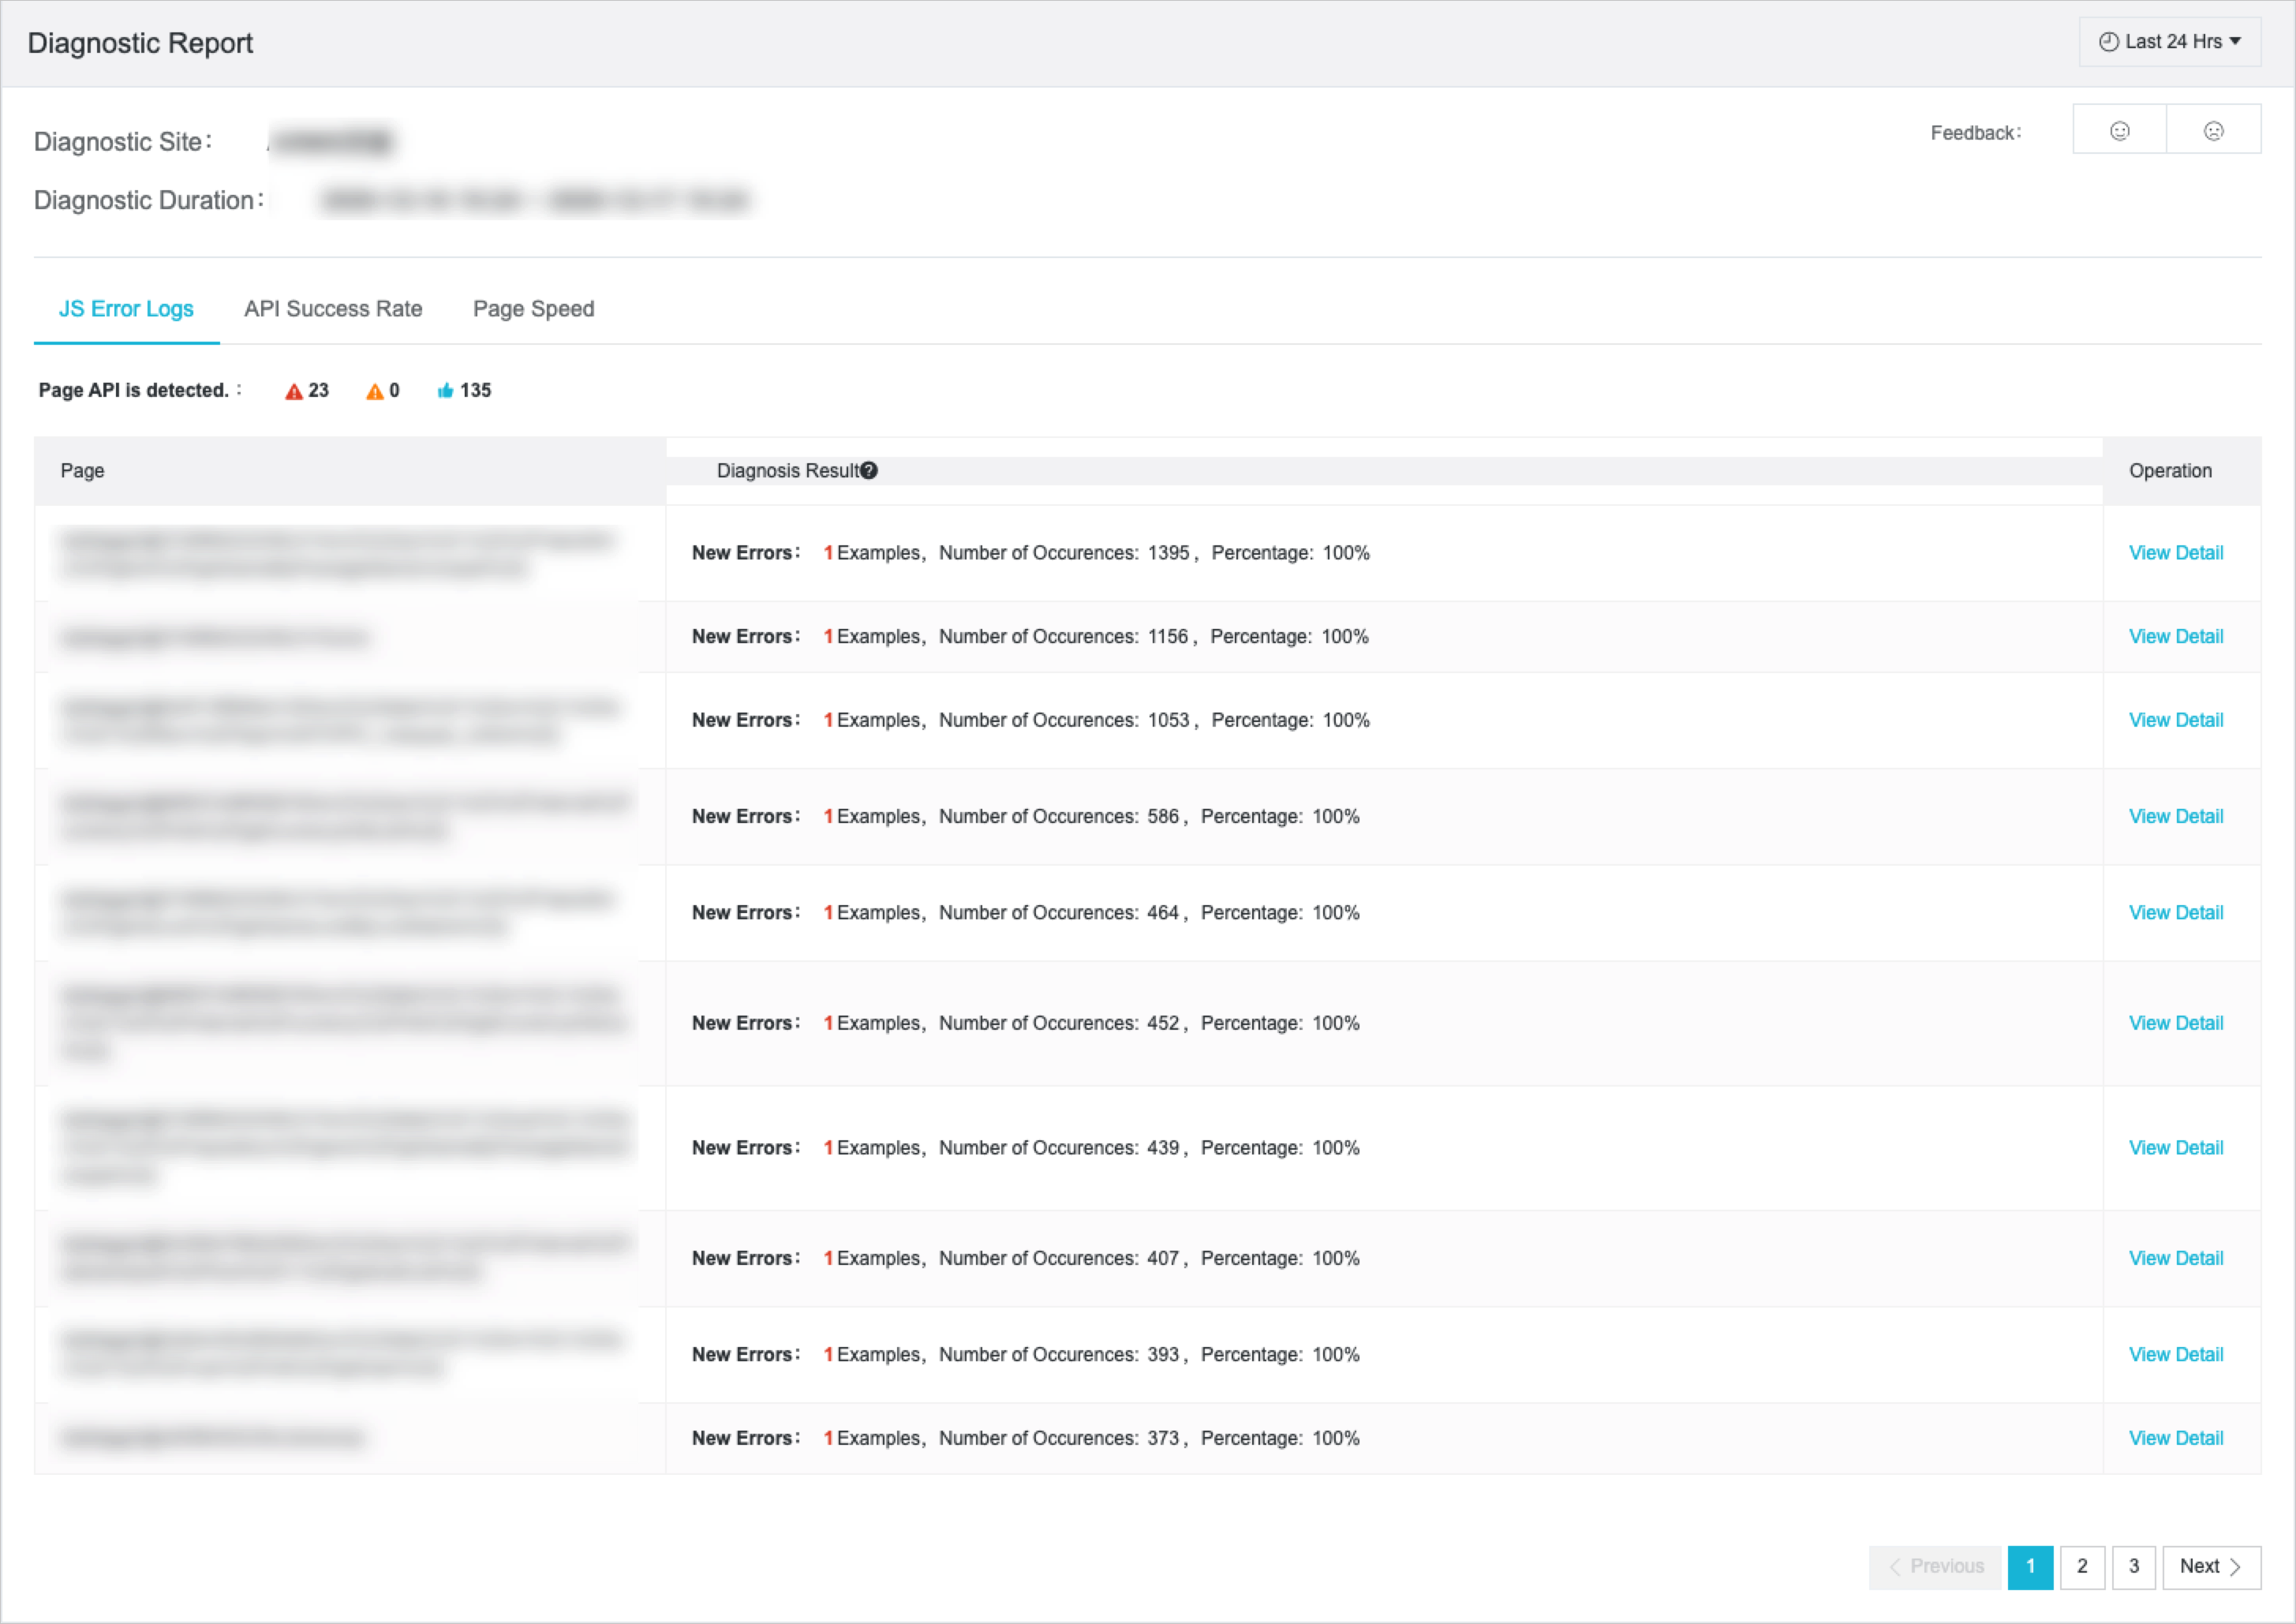
JS error logs
The JS Error Logs tab uses the number of JS errors as a metric, and collects information about the error page views (PVs), exception PVs, and normal PVs. The tab displays the diagnostic result of each page, such as the number of error PVs, the JS error rate, and the number of new error PVs. The following formula is used: JS error rate = Number of error PVs/Total number of PVs.
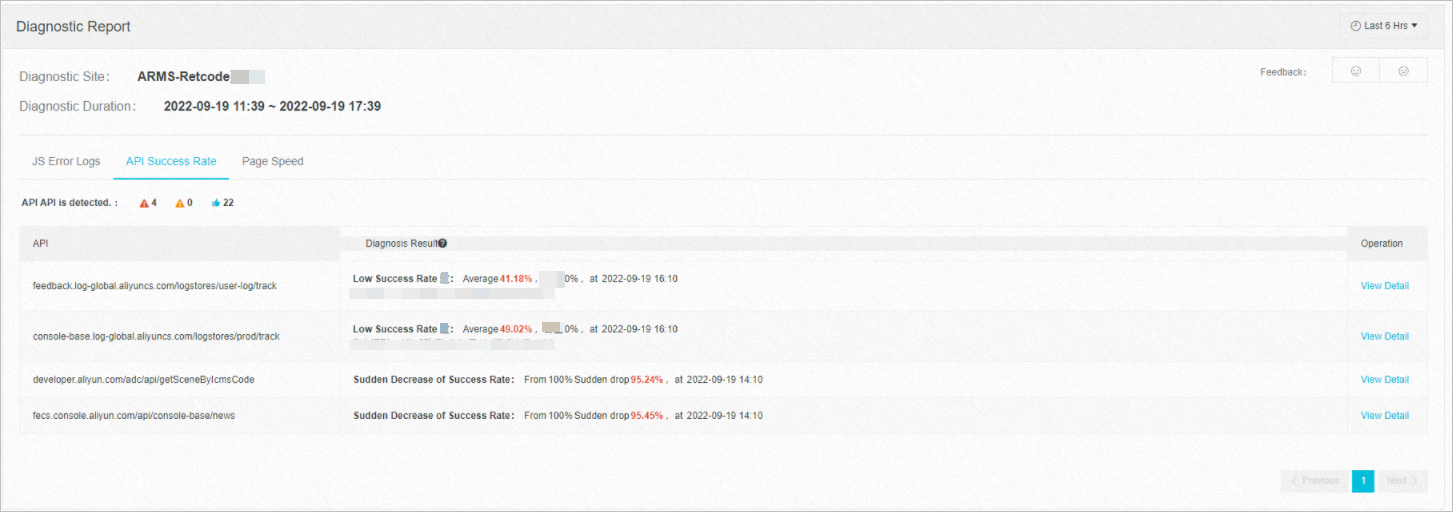
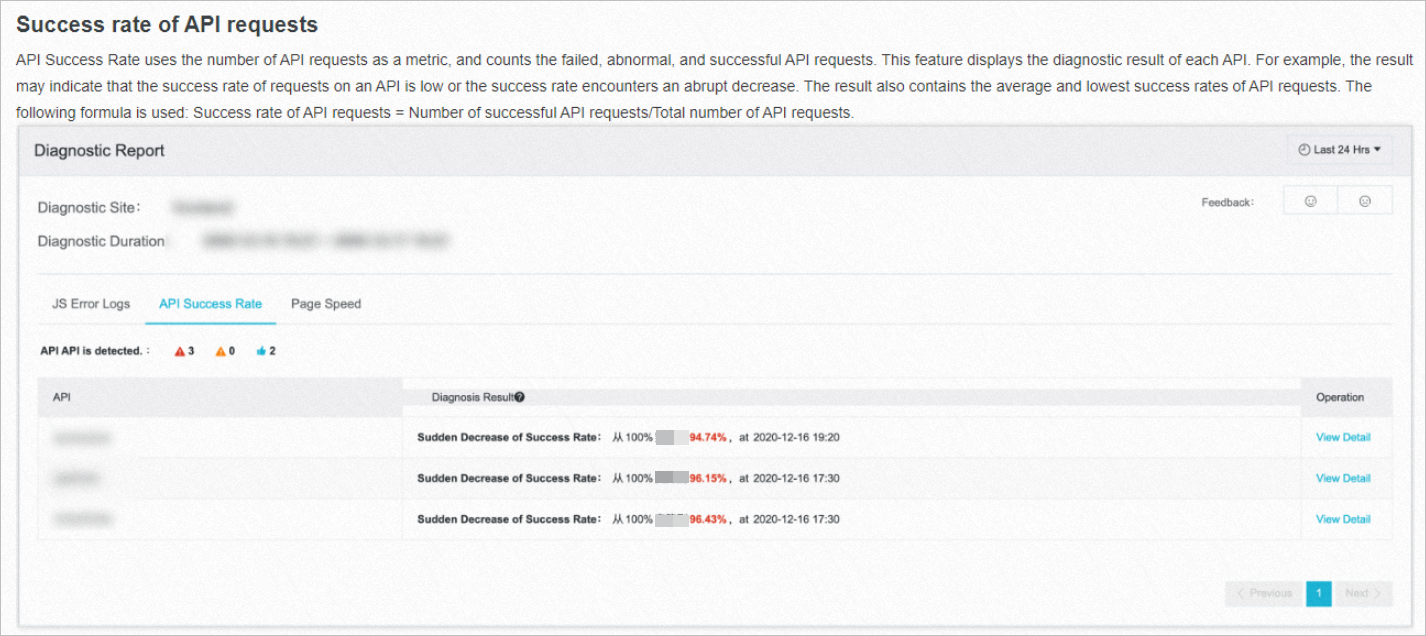
Success rate of API requests
The API Success Rate tab uses the number of API requests as a metric, and counts the failed, abnormal, and successful API requests. This tab displays the diagnostic result of each API. For example, the result may indicate that the success rate of requests on an API is low or the success rate abruptly decreases. The result also contains the average and lowest success rates of API requests. The following formula is used: Success rate of API requests = Number of successful API requests/Total number of API requests.
Page loading speed
The Page Speed tab provides the loading performance of each page, including the numbers of failures, successes, and exceptions in page loading. This tab provides the diagnostic result of each page loading operation based on the first paint time (FTP). This helps you identify pages that have a long FTP. The result also includes the average FTP, maximum FTP, and the time when the maximum FTP occurs. The following formula is used: FTP = responseEnd - fetchStart.