This topic describes the custom statistics feature provided by Application Real-Time Monitoring Service (ARMS) Browser Monitoring.
To help you monitor and collect lightweight business interaction behaviors, Browser Monitoring provides the following types of custom statistics:
Sum statistics: calculates the total number of occurrences for some events, such as the number of times that a button is clicked and the number of times that a module is loaded.
Average statistics: calculates the average values for some events, such as the average loading time of a module.
ARMS provides the following dimensions for the preceding types of custom statistics. Average statistics are used in this example.
-
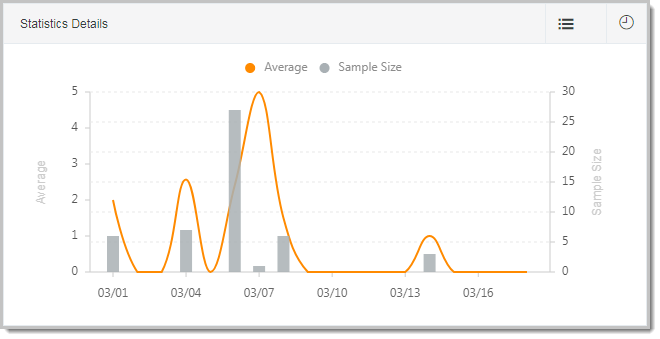
Statistics details
The statistics details line chart shows the trends of the average values and the size of samples for an event within a specified period of time. Assume that the time consumption data of a module is collected. In the statistics details, you can view the average time consumption data and the size of sent samples in the corresponding period of time.
-
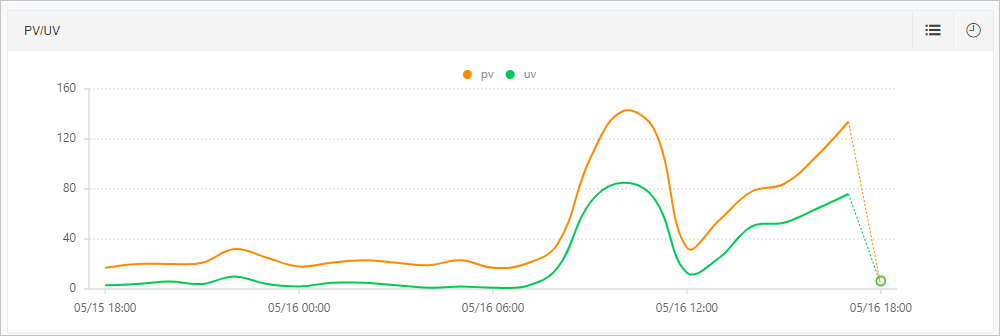
PV/UV
In the PV/UV line chart, you can view the PV and UV statistics of the event within a specified period of time.
-
Geographical view
The geographical view shows event data aggregated by location, such as by province in the Chinese mainland or by country worldwide. browser monitoring provides the reported count, average value, and UV data for each region. This helps you understand regional differences and support business decisions.
-
Terminal view
Browsers, devices, operating systems, and resolutions may affect the performance, compatibility, and display of a page. Browser Monitoring provides the average values and sample sizes in these dimensions. This helps you analyze the distribution of the event in different browsers, devices, operating systems, and resolutions.
API method for sum statistics
After the Browser Monitoring SDK is introduced on the page, use the following log reporting API method in the JavaScript file for sum statistics:
Syntax: __bl.sum(key, value)
Description
|
Parameter |
Type |
Description |
Required |
Default |
|
key |
String |
Event name |
Yes |
None |
|
value |
Number |
The value to add for the event. The default value is 1. |
No |
1 |
Example:
__bl.sum('event-a');
__bl.sum('event-b', 3);
API method for average value statistics
After you include the Browser Monitoring SDK on your pages, use the following API in your JavaScript files to track average statistics.
Syntax: __bl.avg(key, value)
Description
|
Parameter |
Type |
Description |
Required |
Default |
|
key |
String |
Event name |
Yes |
None |
|
value |
Number |
The value to average for the event. The default value is 0. |
No |
0 |
Example:
__bl.avg('event-a', 1);
__bl.avg('event-b', 3);