The API details page displays key metrics for all API requests in your application over a selected time range. These metrics include success rate, average successful response time, average failed response time, number of slow responses, and error count. This page also provides statistics grouped by dimensions such as geography, domain name, and connection type.
Procedure
- Log on to the ARMS console.
- In the left-side navigation pane, choose .
- On the Browser Monitoring page, click the name of your application.
- In the left-side navigation pane, choose .
Filter
You can set filters for different dimensions to view specific API information. Available dimensions include API, Response Message, HTTP Status Code, Page, Region, Operating System, Domain Name, Network Type, Device, Browser, UID, and Username.
To remove a filter, hover over its filter box and click the  icon. To clear all filters, click Reset on the far right.
Success rate
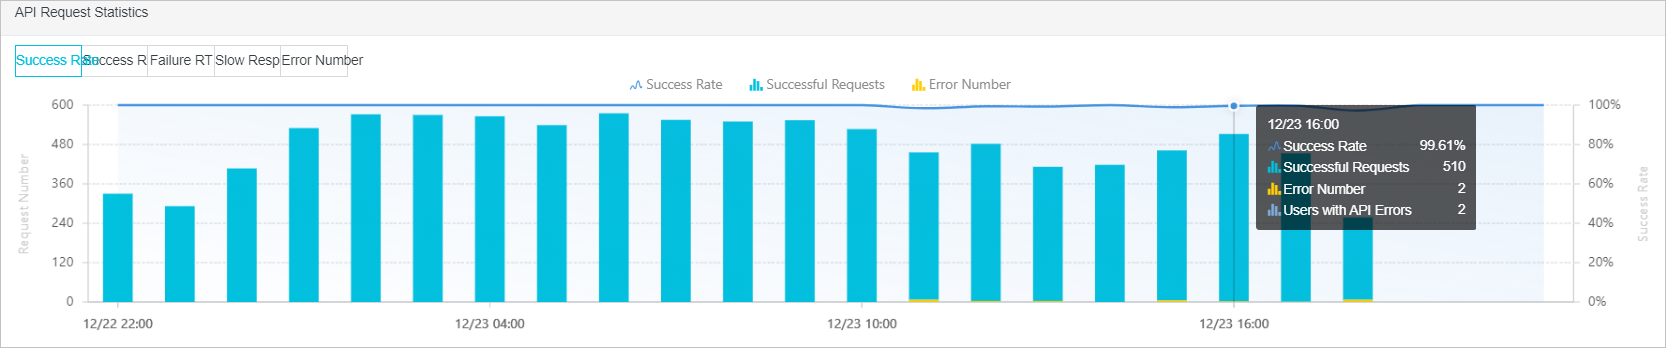
- Success rate: A line chart showing the success rate of all API requests in the application for the selected time range. Values are plotted against the right y-axis.
- Successful call count: A blue bar chart showing the hourly number of successful calls for the selected time range. Values are plotted against the left y-axis.
- Error count: A yellow bar chart showing the hourly number of errors for the selected time range. Values are plotted against the left y-axis.
Hover over a bar in the chart to view the success rate, successful call count, error count, and error user count for that interval.
Successful or failed response time
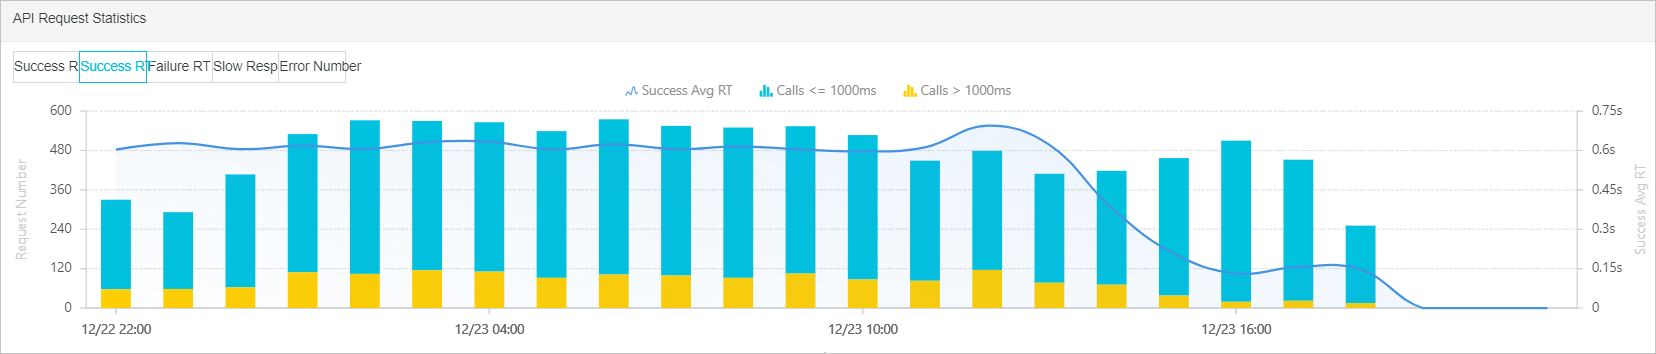
- Average successful or failed response time: A line chart showing the average response time for successful or failed API calls in the application for the selected time range. Values are plotted against the right y-axis.
- Calls ≤1000ms: A blue bar chart showing the hourly number of successful or failed calls that completed in 1,000 ms or less. Values are plotted against the left y-axis.
- Calls >1000ms: A yellow bar chart showing the hourly number of successful or failed calls that took longer than 1,000 ms. Values are plotted against the left y-axis.
Slow responses
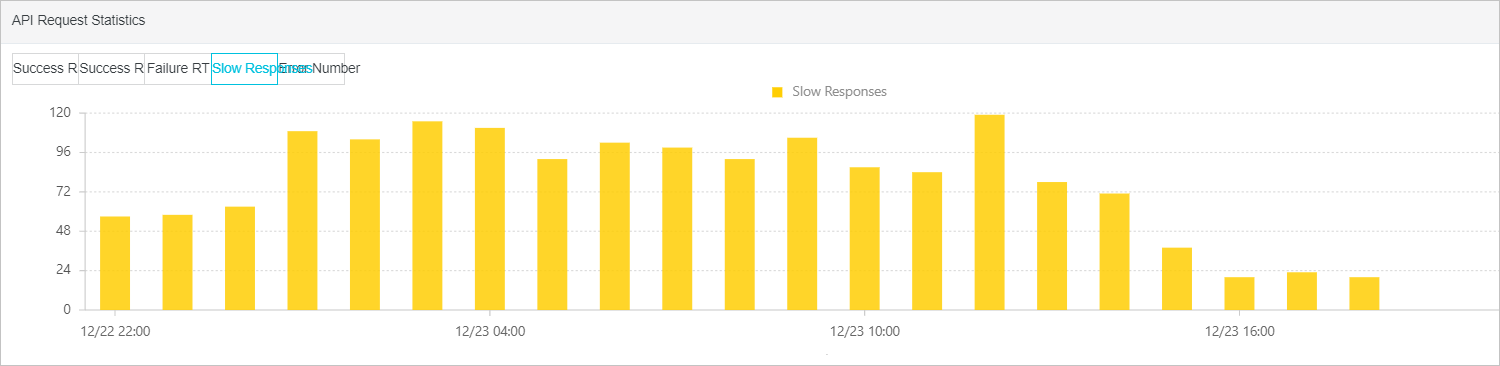
Number of slow responses: A bar chart showing the count of slow API requests in the application for the selected time range. Values are plotted against the left y-axis.
Error count
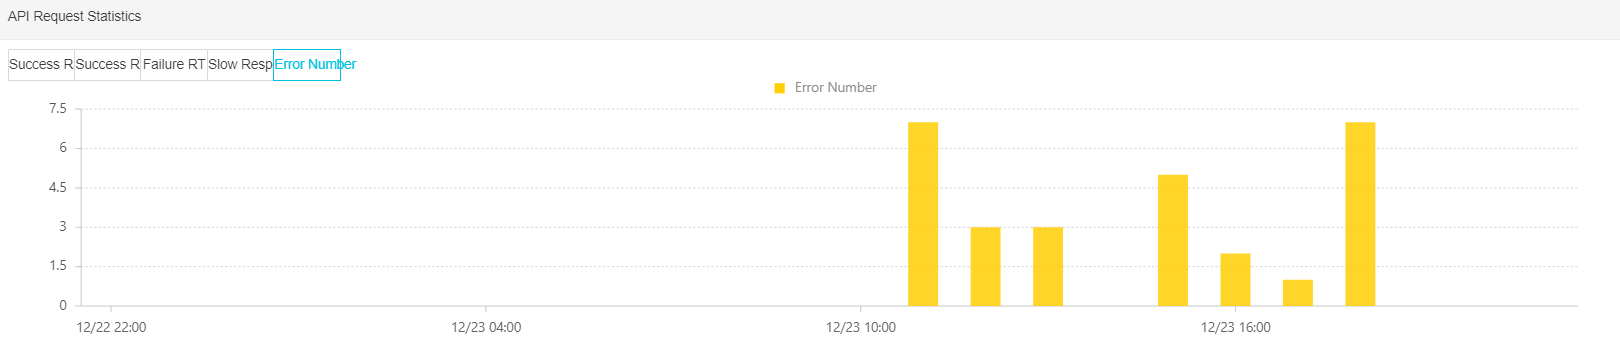
Error count: A bar chart showing the count of failed API requests in the application for the selected time range. Values are plotted against the left y-axis.
API request list
- Click the
 icon next to a column header to sort the list.
 - In the API column, hover over an API alias and click the
 icon to edit the alias. The list then displays all APIs by their aliases. Click Set As Filter Value to use the API as a filter.
 - Click a number in the Errors column to view the details and distribution of errors for the selected time range. In the Request Details section, click View Trace to inspect the call and business traces of the failed request. Click View Session to inspect the corresponding session trace details for the failed request.
- Click a number in the Slow Responses column to view the details and distribution of slow requests for the selected time range. In the Request Details section, click View Trace to inspect the call and business traces of the slow request. Click View Session to inspect the corresponding session trace details for the slow request.
- In the Actions column, click Analyze to view API details, API error details, API slow response details, and distribution data.
- The API details page displays the API request success rate and request details. In the Request Details section, click View Trace to inspect the call and business traces for the API. Click View Session to inspect the session trace details for the API.
- The API error details page displays the error count distribution and request details.
- The API slow response details page displays the response time distribution and network request information.
- The Distribution page displays information about responses, HTTP status codes, pages, domains, and geographical distribution. You can also view the percentage breakdown by dimensions such as operating system, browser, device, and connection type.
Response list
- Click the icon next to a column header to sort the list.
- In the Response Message column, hover over a response and click Set As Filter Value to use the response as a filter.
- Click a number in the Slow Responses column to view the details and distribution of slow requests for the selected time range. In the Request Details section, click View Trace to inspect the call and business traces of the slow request. Click View Session to inspect the corresponding session trace details for the slow request.
- In the Actions column, click Analyze to view API details, API error details, API slow response details, and distribution data.
- The API details page displays the API request success rate and request details. In the Request Details section, click View Trace to inspect the call and business traces for the API. Click View Session to inspect the session trace details for the API.
- The API error details page displays the error count distribution and request details.
- The API slow response details page displays the response time distribution and network request information.
- The Distribution page displays information about responses, HTTP status codes, pages, domains, and geographical distribution. You can also view the percentage breakdown by dimensions such as operating system, browser, device, and connection type.
HTTP status code
- Click the icon next to a column header to sort the list.
- In the HTTP Status Code column, hover over an HTTP status code and click Set As Filter Value to use the status code as a filter.
- Click a number in the Slow Responses column to view the details and distribution of slow requests for the selected time range. In the Request Details section, click View Trace to inspect the call and business traces of the slow request. Click View Session to inspect the corresponding session trace details for the slow request.
- In the Actions column, click Analyze to view API details, API error details, API slow response details, and distribution data.
- The API details page displays the API request success rate and request details. In the Request Details section, click View Trace to inspect the call and business traces for the API. Click View Session to inspect the session trace details for the API.
- The API error details page displays the error count distribution and request details.
- The API slow response details page displays the response time distribution and network request information.
- The Distribution page displays information about responses, HTTP status codes, pages, domains, and geographical distribution. You can also view the percentage breakdown by dimensions such as operating system, browser, device, and connection type.
Distribution
- Version distribution is supported only for operating systems and browsers.
- The pie charts for operating system, browser, device, and connection type display only the top five distributions. To view the proportions of all categories for a dimension, click Toggle View in the upper-right corner of the section.