This topic describes how to view your bills and resource usage for Browser Monitoring.
View billing
View pay-as-you-go bills
-
Log on to the Expenses and Costs console. In the left-side navigation pane, choose .
-
On the page that appears, click the Billing Details tab.
-
On the Billing Details tab, set filter conditions, such as Billing Cycle, Account/Owner Account, and Product Details, and click Search.
To view bills by instance, set Statistic Item to Instance.
NoteCost centers can also help you track instance-level expenditures.
View resource plan usage
If you have a resource plan, follow these steps to view its usage.
-
In the ARMS console, go to the Overview page. In the Resource Status panel, check the Number of Resource Plans and Remaining Resources under your product, such as Browser Monitoring.
-
Click a resource value to view its usage details.
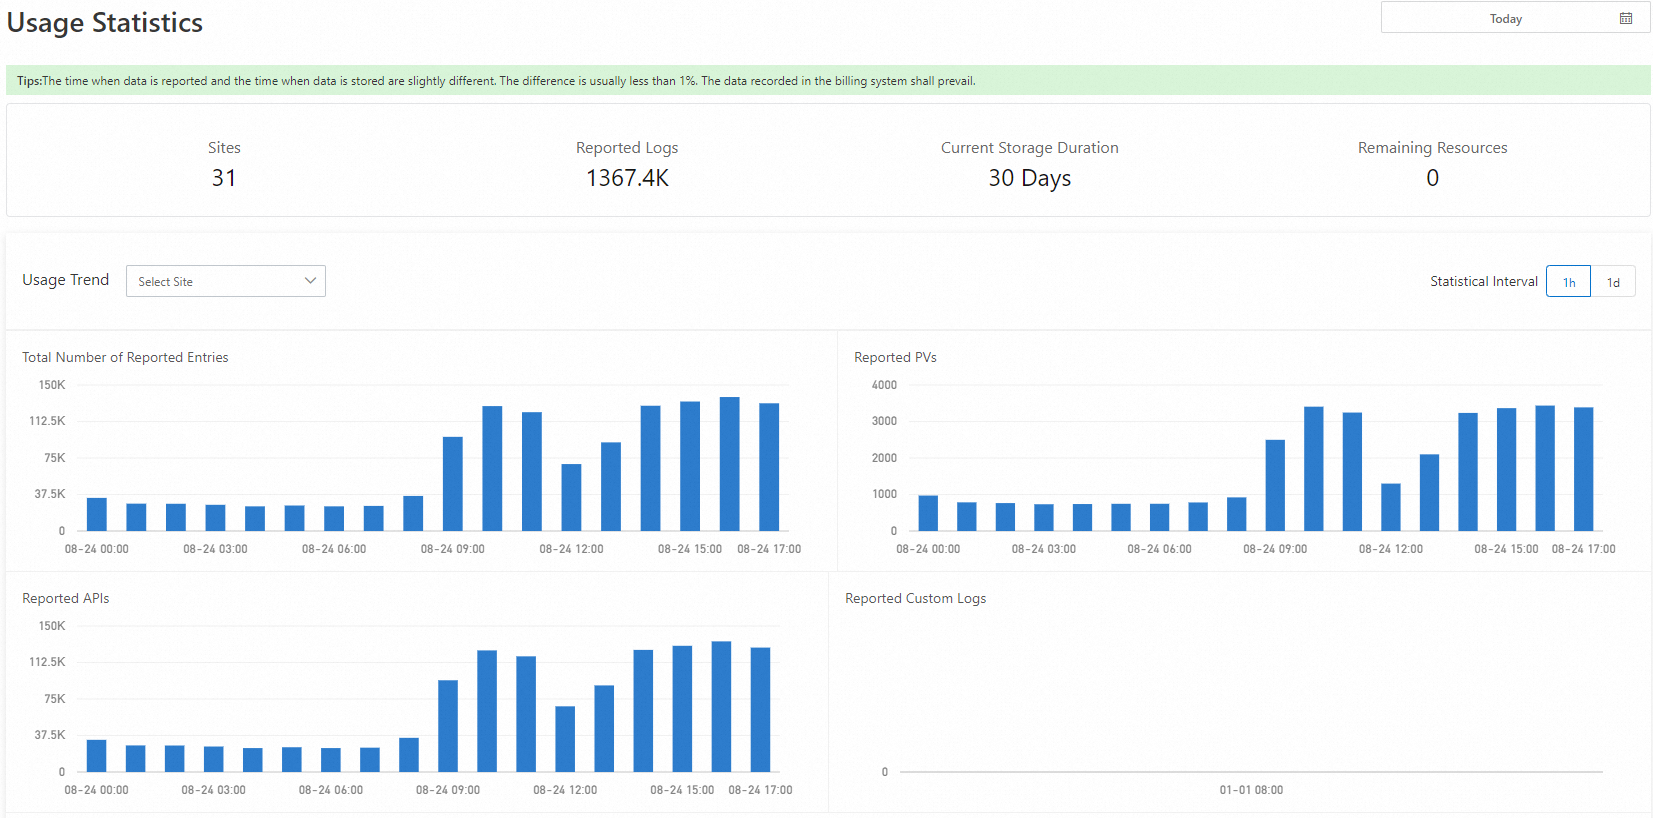
View resource usage
The ARMS console provides a resource usage view for Pro Edition users. Set filters to view resource usage for a single application or all applications within a specific time range.
In Browser Monitoring, one resource unit corresponds to one data reporting event, such as a page view (PV), API call, or custom event.
-
In the navigation pane on the left of the ARMS console, choose .
-
In the upper-right corner of the Usage Statistics page, set the desired time range.