The Attack Statistics page in ARMS Application Security provides an overview of your application's protection status. You can view detailed data about each attack, including when it occurred, its type, the attack URL, and the handling method Application Security used.
Procedure
Log on to the ARMS console.
In the left-side navigation pane, choose , and then select a region from the top menu bar.
The Attack Statistics page displays the attack statistics for all applications by default. The left side of the page is the Application Behavior Statistics panel, which displays the total number of requests and the distribution of behavior types such as class loading, file writing, thread operation, DNS query, XML entity parsing, object deserialization, and SQL execution. The right side is the Attack Statistics panel, which displays the total number of monitored attacks, the number of blocked attacks, and the distribution of attack types such as command execution, XXE, SQL injection, malicious DNS query, directory traversal, file reading, and thread injection. The bottom of the page displays an attack log table with columns for Date, Type, URL, Behavior Data, Handling Method, and Details. You can filter the table by Handling Method and Type or search by URL. At the end of each row, click View to see the attack details.
Optional: To view statistics for a single application, use one of the following methods:
Click the All Applications dropdown menu at the top of the Attack Statistics page to switch to a specific application.
On the page, click a specific application name to go to the Attack Statistics page, which displays the attack statistics for the application.
Attack details
The Attack Statistics page uses donut charts to show your application's behavior and attack statistics after you enable Application Security. The table at the bottom of the page lists detailed data for each attack, such as the attack type, URL, behavior data, and handling method.
The Application Behavior Statistics section displays application behaviors detected by Application Security and their corresponding categories, including normal behaviors and attack behaviors.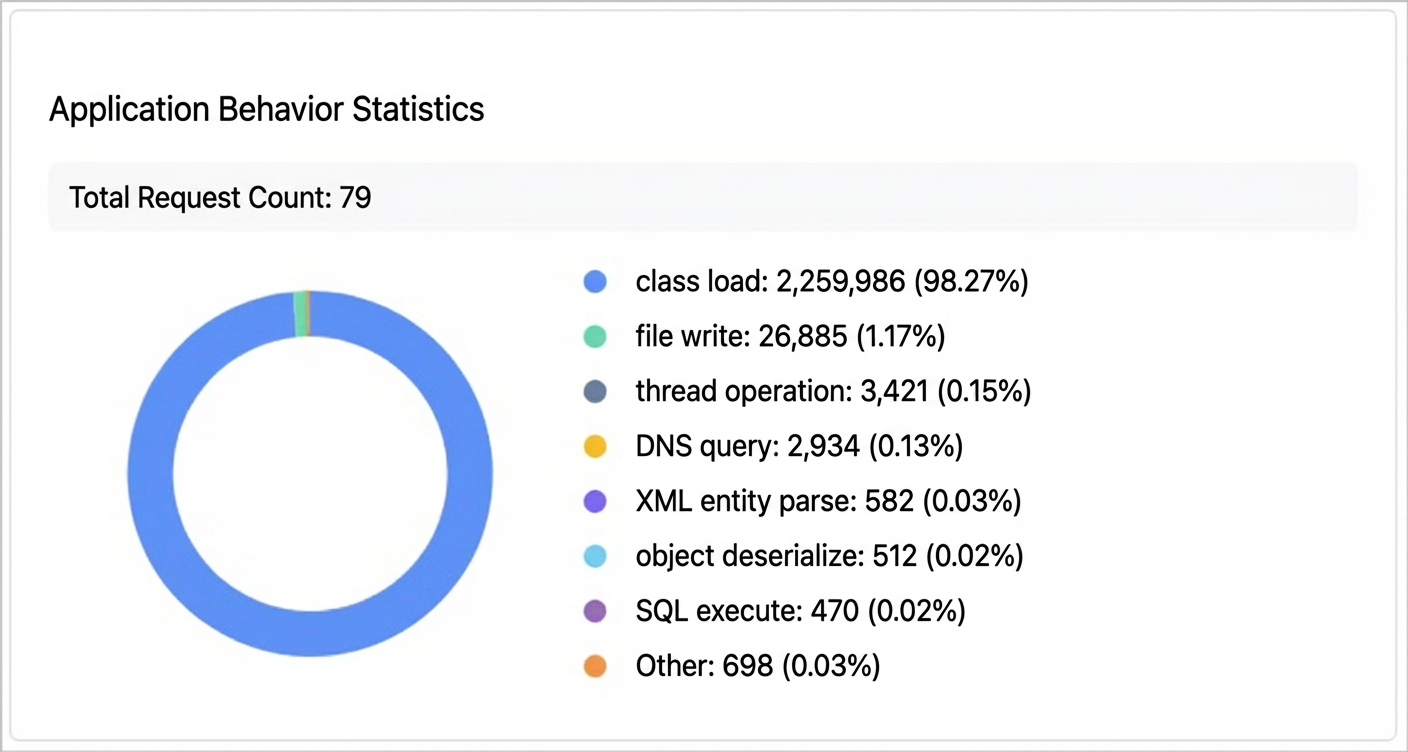
The Attack Statistics section displays attacks that pose an actual threat and their corresponding types, as detected by Application Security.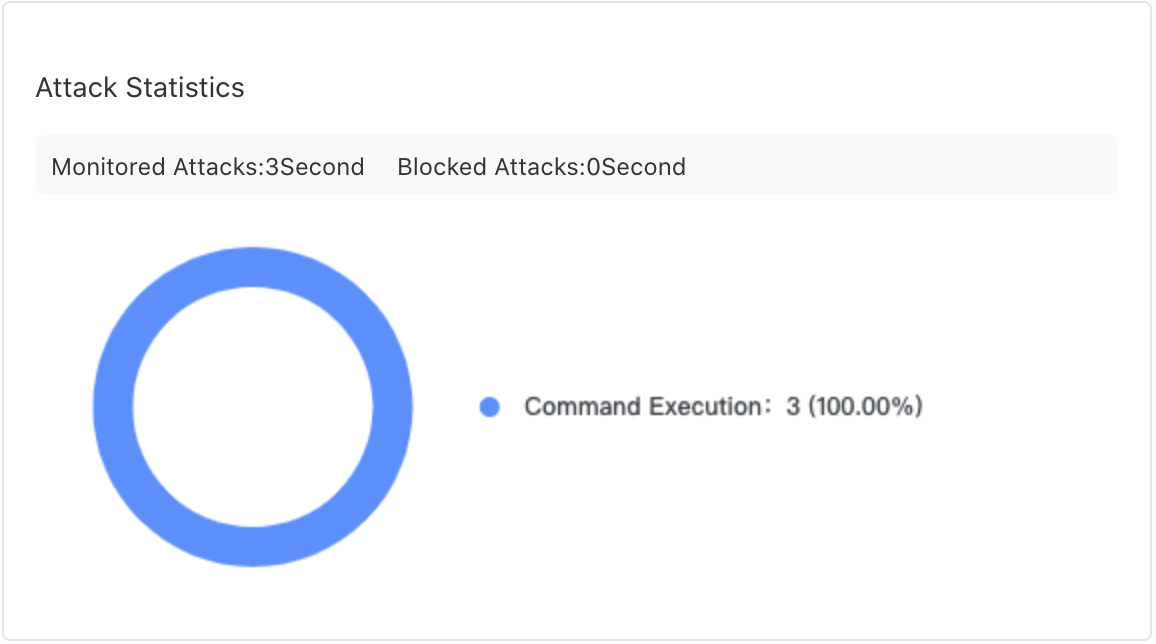
The list at the bottom of the Attack Statistics page shows the details of each attack. In the list, you can view the time of occurrence, type, URL, specific data, and the handling method for each attack. You can also click View in the Details column to view the details of a target attack in the panel that appears. These details include the exploited security vulnerability, the attack request, and detailed information about the corresponding server.
If no attack data is displayed on the Attack Statistics page, it may be due to one of the following three reasons:
-
The application is not fully integrated. After you clicked Monitor in the console, you did not restart the application's instance, or you restarted only some of the instances.
-
The application's Java agent is outdated. Application Security requires one of the following agent versions. For more information, see Enable Application Security.
-
For auto-update scenarios, such as applications in Container Service and EDAS, the agent version must be v2.7.1.2 or later.
NoteIn auto-update scenarios, you can automatically update the agent by restarting the application or pod. For more information, see Upgrade the ARMS agent.
-
For other manual update scenarios, the agent version must be v2.7.1.3 or later.
-
-
No successful attacks have occurred. Unlike a traditional firewall, Application Security records only successful attacks. A traditional firewall reports an attack when it detects malicious characteristics in data packets. However, malicious characteristics do not guarantee a successful attack. For example, an attack request that exploits a PHP vulnerability is meaningless in a Java environment. A successful attack means the attacker has breached the outer defenses and can penetrate the internal environment of your application to perform malicious operations. Your application may not experience many successful attacks, but you must treat each one seriously. Block the attack or promptly fix the underlying vulnerability.