When a Go application experiences slow traces, standard distributed tracing shows which service or span is slow but not which function inside that span consumes the most time. Application Real-Time Monitoring Service (ARMS) code diagnostics uses continuous profiling technology to regularly collect method stack snapshots of threads and simulate code execution, pinpointing the exact methods responsible for latency -- even for issues that are difficult to reproduce.
Use cases
Slow calls during traffic spikes: Identify the function causing latency during promotions or peak traffic.
Recurring slow calls: Automatically capture the code path each time a slow call occurs for later analysis.
Hard-to-reproduce performance issues: Reconstruct method-level execution for intermittent slow calls that are difficult to reproduce in test environments.
Gaps in trace instrumentation: Surface time consumption for methods at non-framework layers that standard trace instrumentation does not cover.
How it works
Code diagnostics periodically samples the call stacks of your Go application threads while they run on the CPU. These samples are aggregated into a flame graph that shows:
Which methods consumed the most CPU time
The full call hierarchy from entry point to leaf function
The relative time each method spent executing its own code versus calling other methods
Code diagnostics for Go applications supports On CPU scenarios only.
Prerequisites
Before you begin, make sure that you have:
A Go application monitored by an ARMS agent (see Monitor Go applications)
ARMS agent version 1.4.1 or later
Enable code diagnostics
Log on to the ARMS console. In the left-side navigation pane, choose .
On the Application List page, select a region in the top navigation bar and click the name of the application that you want to manage.
NoteIcons displayed in the Language column indicate languages in which applications are written.
 : Java application
 : Go application
 : Python application
Hyphen (-): application monitored in Managed Service for OpenTelemetry.
In the left-side navigation pane, click Application Settings. On the page that appears, click the Custom Configuration tab.
In the Continuous profiling section, turn on Main switch, CPU hotspot, and Code hotspot.
Click Save at the bottom of the tab.
The configuration takes effect immediately. No application restart is required.
Locate a slow trace and open its code hotspot profile
After code diagnostics is enabled, ARMS collects profiling data alongside trace data. Correlate a slow trace with its code-level profile to identify the root cause.
Log on to the ARMS console. In the left-side navigation pane, choose .
On the Application List page, select a region in the top navigation bar and click the name of the application that you want to manage.
NoteIcons displayed in the Language column indicate languages in which applications are written.
: Java application: Go application: Python applicationHyphen (-): application monitored in Managed Service for OpenTelemetry.
In the left-side navigation pane, click Interface Invocation. Select an interface and click the Interface Snapshot tab. You are redirected to the Trace Explorer page.
In the trace list, click a trace ID.
Click the magnifier icon in the Details column, then click the Code Hotspot tab.
Read the code hotspot results
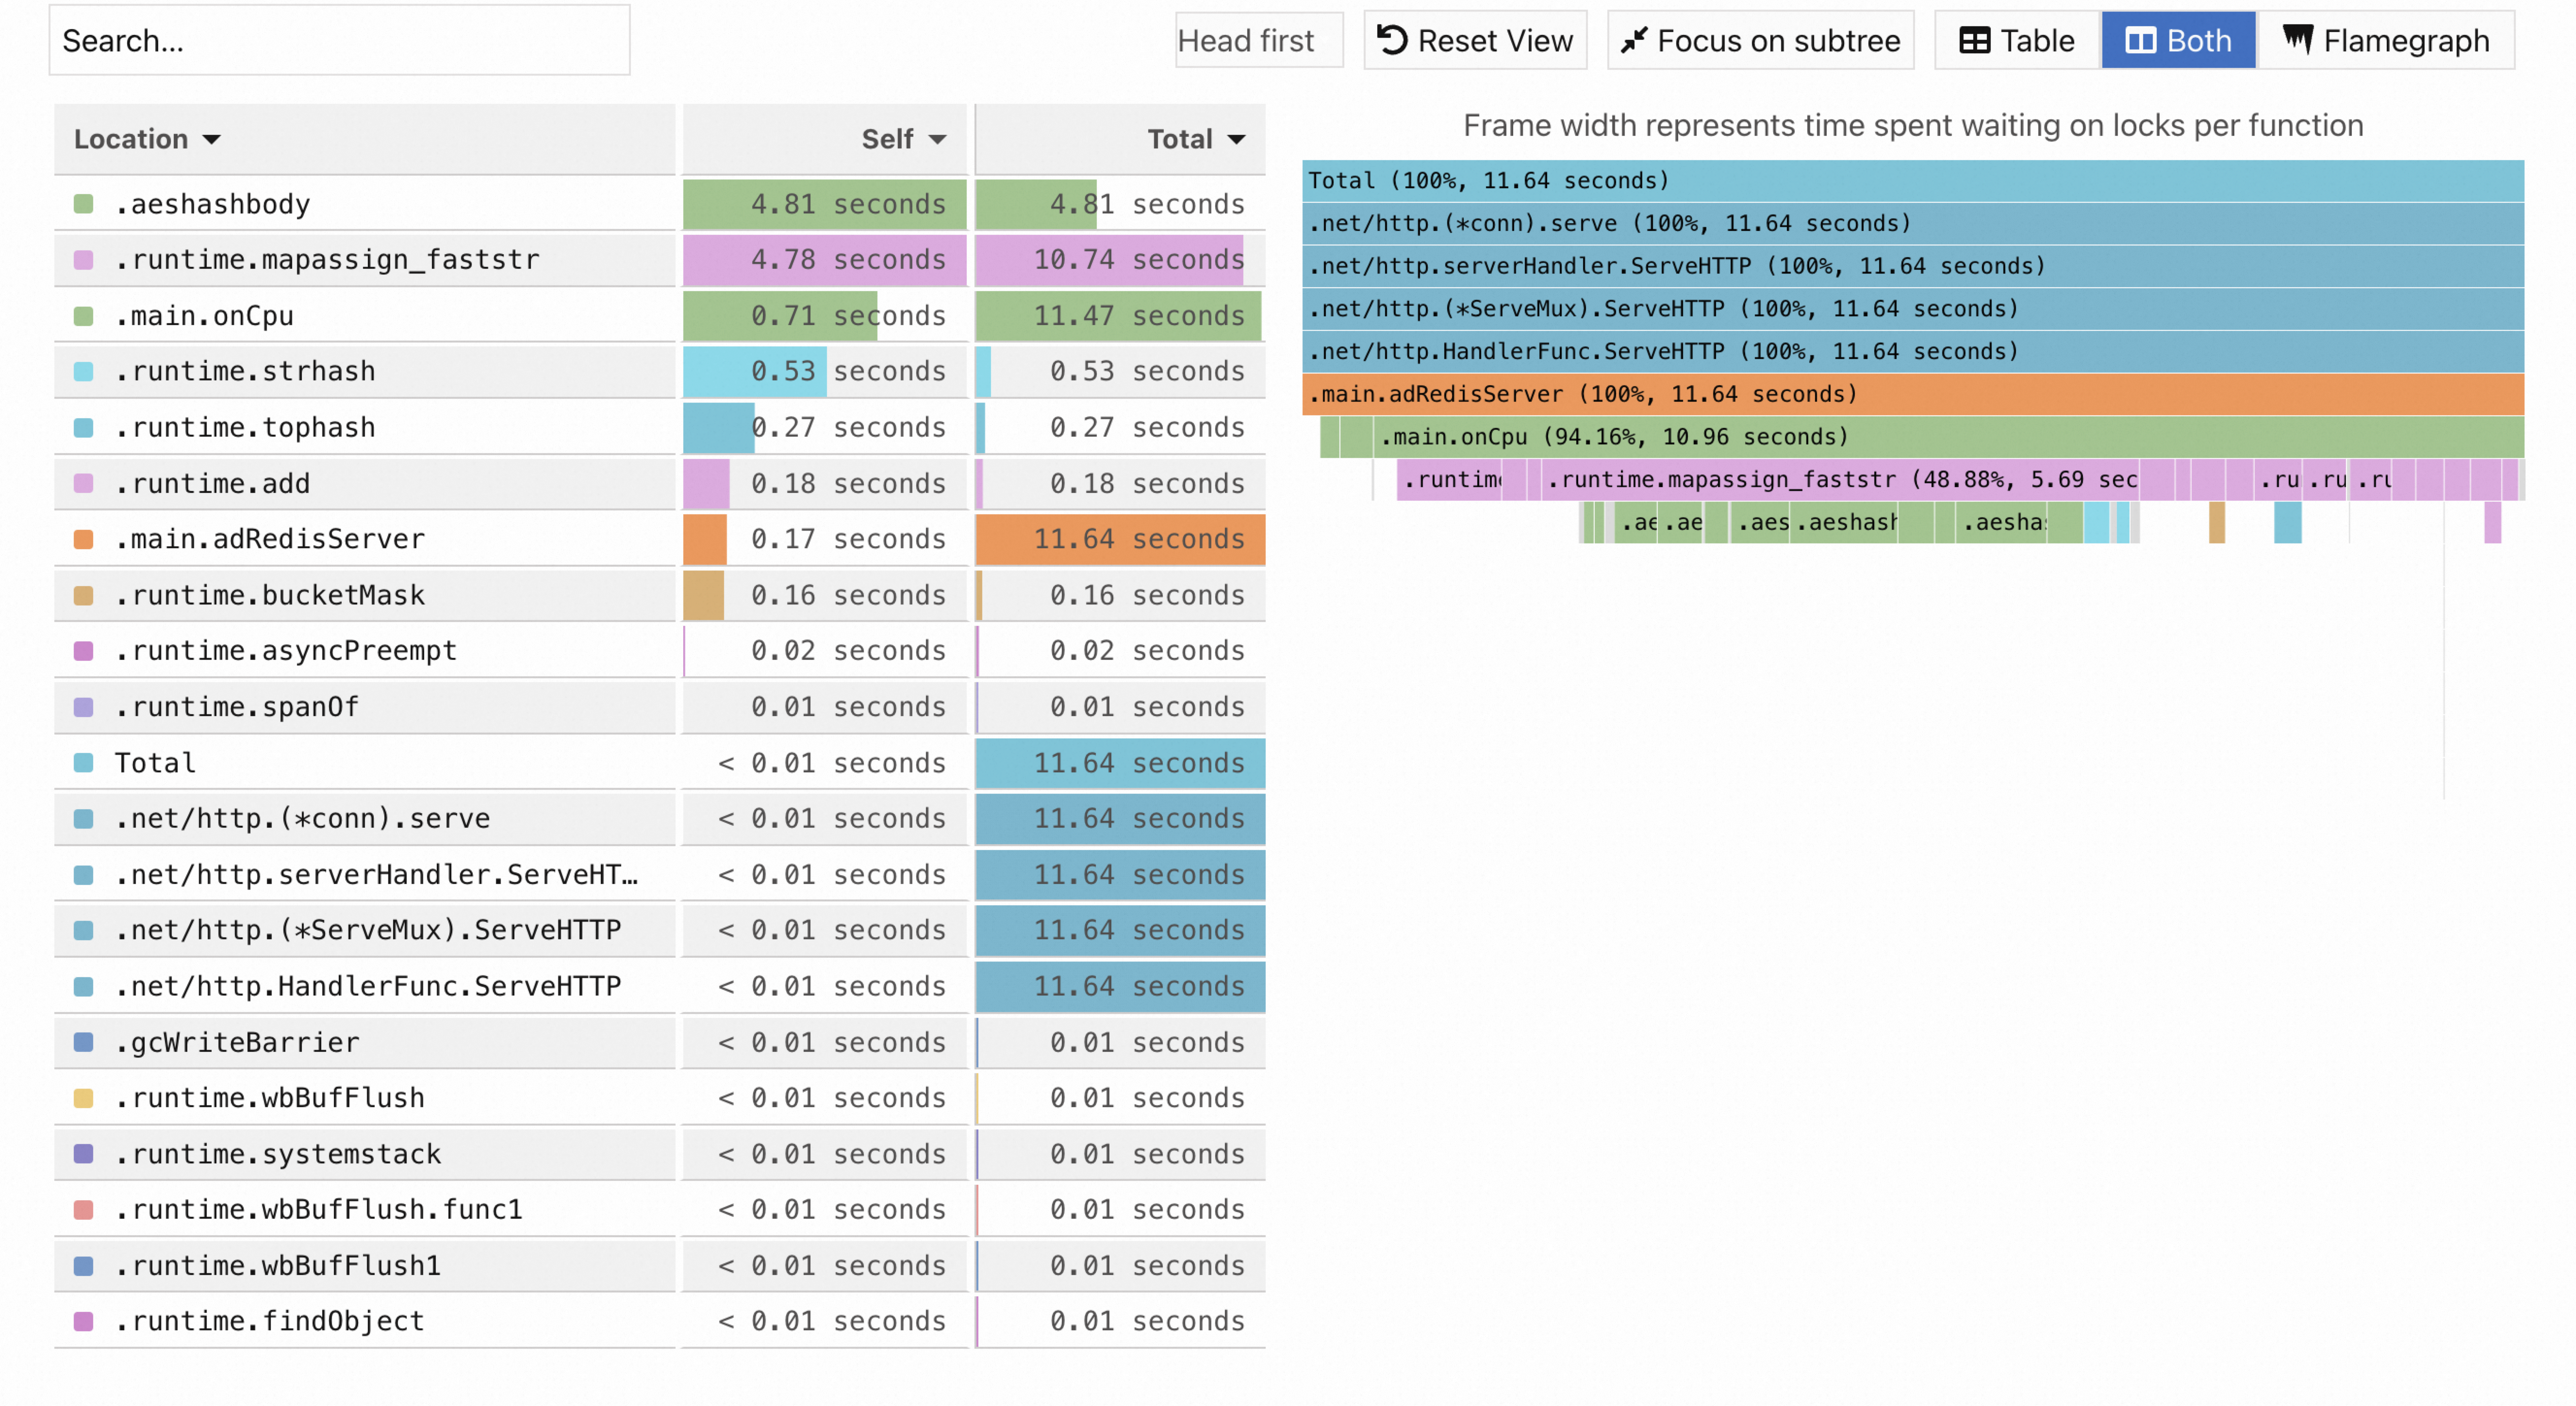
The Code Hotspot tab displays two panels:
Left panel -- Method list: Shows the time or resources consumed for all methods involved.
Right panel -- Flame graph: Visualizes the full method stack information for each method.
Method list columns
| Column | Meaning | When to use |
|---|---|---|
| Self | Time or resources a method consumes within the stack, excluding time or resources that its child methods consume. | Identify methods that directly spend excessive time or resources. A high Self value means the method itself is the bottleneck. |
| Total | Time or resources consumed by a method, including all of its child methods. | Identify top-level methods that contribute the most overall time or resources. A high Total with a low Self means the bottleneck is in a child method. |
Read the flame graph
Each horizontal bar in the flame graph represents a method call.
How to identify the bottleneck:
Look for the widest bar -- this method consumed the most CPU time.
Check the Self value for that method. A high Self value confirms the method itself is the bottleneck, not its children.
If the widest bar has a low Self value, drill down into its child methods (the bars stacked above it) to find which child consumes the most time.
Example: identify a CPU-intensive function
The following Go application contains a CPU-intensive function (onCpu) that iterates 10*1024*1024 times per request. Code diagnostics captures this function as a hotspot in the flame graph.
package main

import (
	"log"
	"net/http"
	"strconv"
)

var client = http.Client{}

func adRedisServer(w http.ResponseWriter, r *http.Request) {
	log.Printf("request to redis server")
	r.Header.Add("times", strconv.Itoa(onCpu()))
	w.Write([]byte("Hello World"))
}

// onCpu performs a CPU-intensive loop that iterates 10*1024*1024 times.
// Code diagnostics identifies this function as a hotspot in the flame graph.
func onCpu() int {
	var header map[string]int
	header = make(map[string]int)
	sum := 1
	for i := 0; i < 10*1024*1024; i++ {
		sum = sum + i
		header["i"] = sum
	}
	return sum
}

func main() {
	http.Handle("/ad-redis-server", http.HandlerFunc(adRedisServer))
	err := http.ListenAndServe(":8080", nil)
	if err != nil {
		panic(err)
	}
}
To reproduce this example:
Deploy this application with the ARMS agent (v1.4.1 or later) and enable code diagnostics.
Send a request to the
/ad-redis-serverendpoint.Follow the steps in the "Locate a slow trace and open its code hotspot profile" section to view the flame graph.
The onCpu() function appears as the widest bar in the flame graph with the highest Self time, confirming it is the primary performance bottleneck.
What's next
Monitor Go applications -- Set up ARMS monitoring for additional Go applications.