An upstream application of a specific application is an application that sends data to the specific application. This topic describes how to view the information about upstream applications, including the response time, number of requests, and number of errors.
Prerequisites
The application is monitored by Application Monitoring. For more information, see Overview.Procedure
- Log on to the ARMS console. In the left-side navigation pane, choose .
- On the Applications page, select a region in the top navigation bar and click the name of the application that you want to manage. Note If the
 icon is displayed in the Language column, the application is connected to Application Monitoring. If a hyphen (-) is displayed, the application is connected to Tracing Analysis.
 - In the left-side navigation pane, click Application Details.
- On the Application Details page, select an application instance, set the time period, and then click the Upstream application tab.
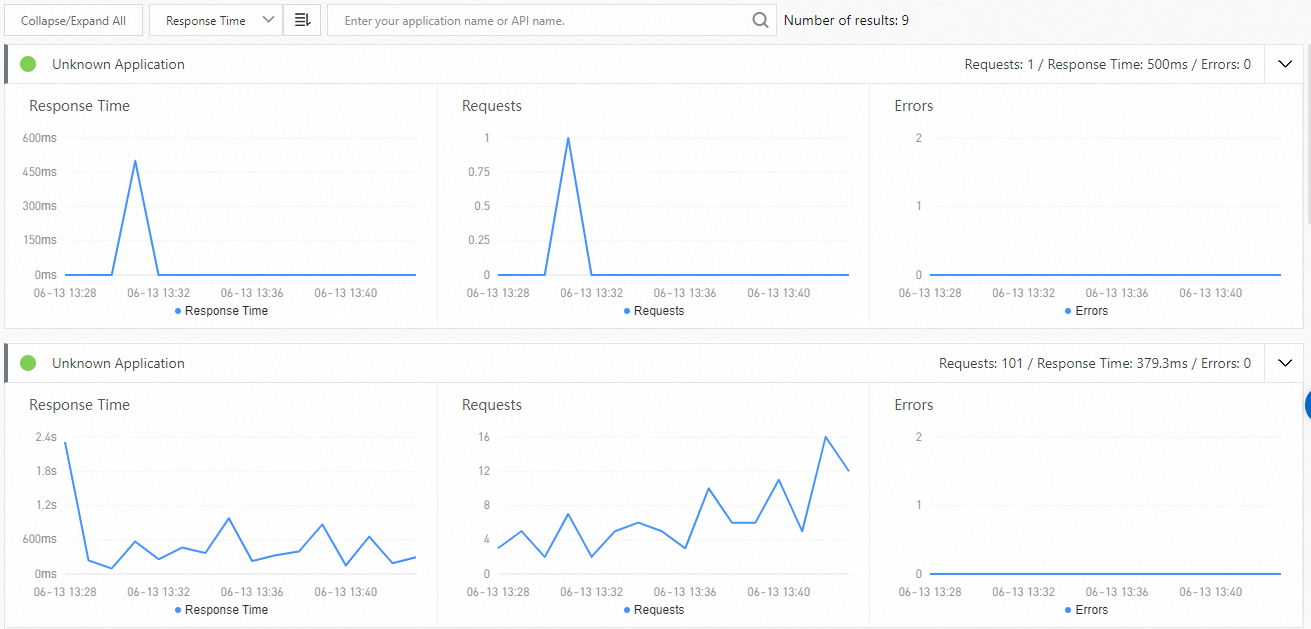
Response time
The Response Time section displays the time series curve that indicates the response time of the upstream applications of the application in the specified time period.
- Move the pointer over a chart and view the detailed statistics.
- Use the cursor to select a time period to view the statistics of the specified time period.
Number of requests
The Requests section displays the time series curve that indicates the number of requests of the upstream applications of the application in the specified time period.
- Move the pointer over a chart and view the detailed statistics.
- Use the cursor to select a time period to view the statistics of the specified time period.
Number of errors
The Errors section displays the time series curve that indicates the number of errors of the upstream applications of the application in the specified time period.
- Move the pointer over a chart and view the detailed statistics.
- Use the cursor to select a time period to view the statistics of the specified time period.