A scheduled task automatically runs a program or command on a one-time or recurring basis. When Java applications rely on scheduled tasks for data processing, cache refresh, or periodic cleanup, failures and performance degradation in these tasks can go unnoticed until downstream systems are affected. Application Real-Time Monitoring Service (ARMS) automatically detects and monitors XXL-JOB, SchedulerX, and JDK-Timer tasks in your Java applications, providing execution metrics, dependency mapping, and trace-level diagnostics.
With scheduled task monitoring, you can:
Track execution health, run counts, and scheduling latency over time
Locate slow SQL and NoSQL queries that degrade task performance
Identify Java exceptions and application errors at the code level
Inspect downstream service dependencies and their performance metrics
Drill down into individual traces for root cause analysis
Prerequisites
Before you begin, make sure that you have:
A Java application connected to ARMS Application Monitoring -- indicated by the
 icon in the Language column on the Applications page. If a hyphen (-) appears instead, the application is connected to Tracing Analysis, not Application Monitoring
ARMS agent version 2.7.1.3 or later. To upgrade, see How do I update the ARMS agent for Java applications?
ARMS application monitoring supports only XXL-JOB, SchedulerX, and JDK-Timer task types.
Open the scheduled task monitoring page
Log on to the ARMS console.
In the left-side navigation pane, choose Application Monitoring > Applications.
In the top navigation bar, select a region, and then click the target application name.
In the left-side navigation pane, click Timed Task.
All detected scheduled tasks appear in the left-side list. Click a task to view its monitoring data.
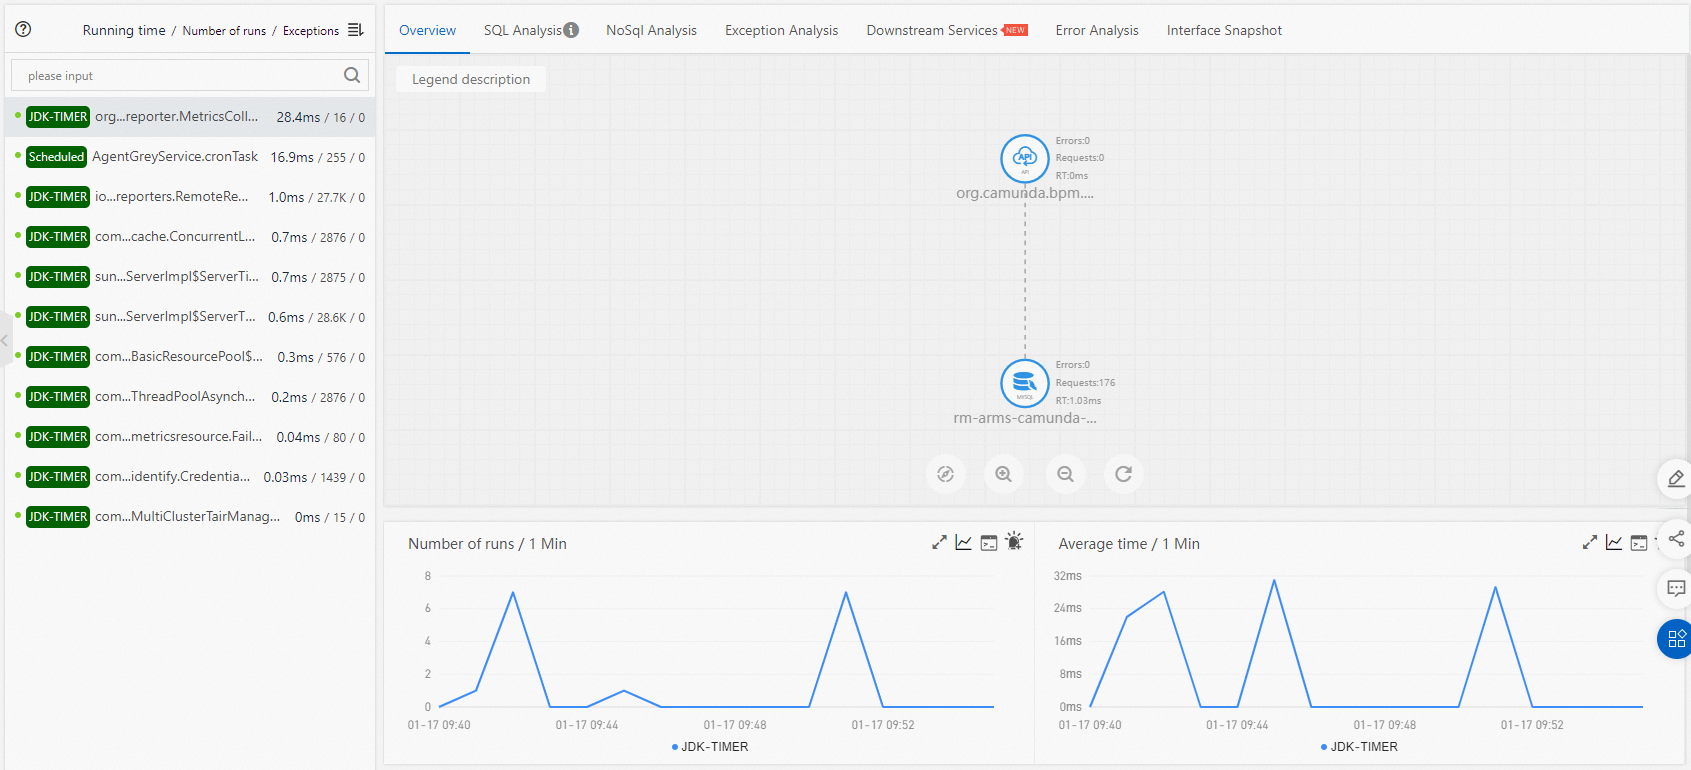
Overview
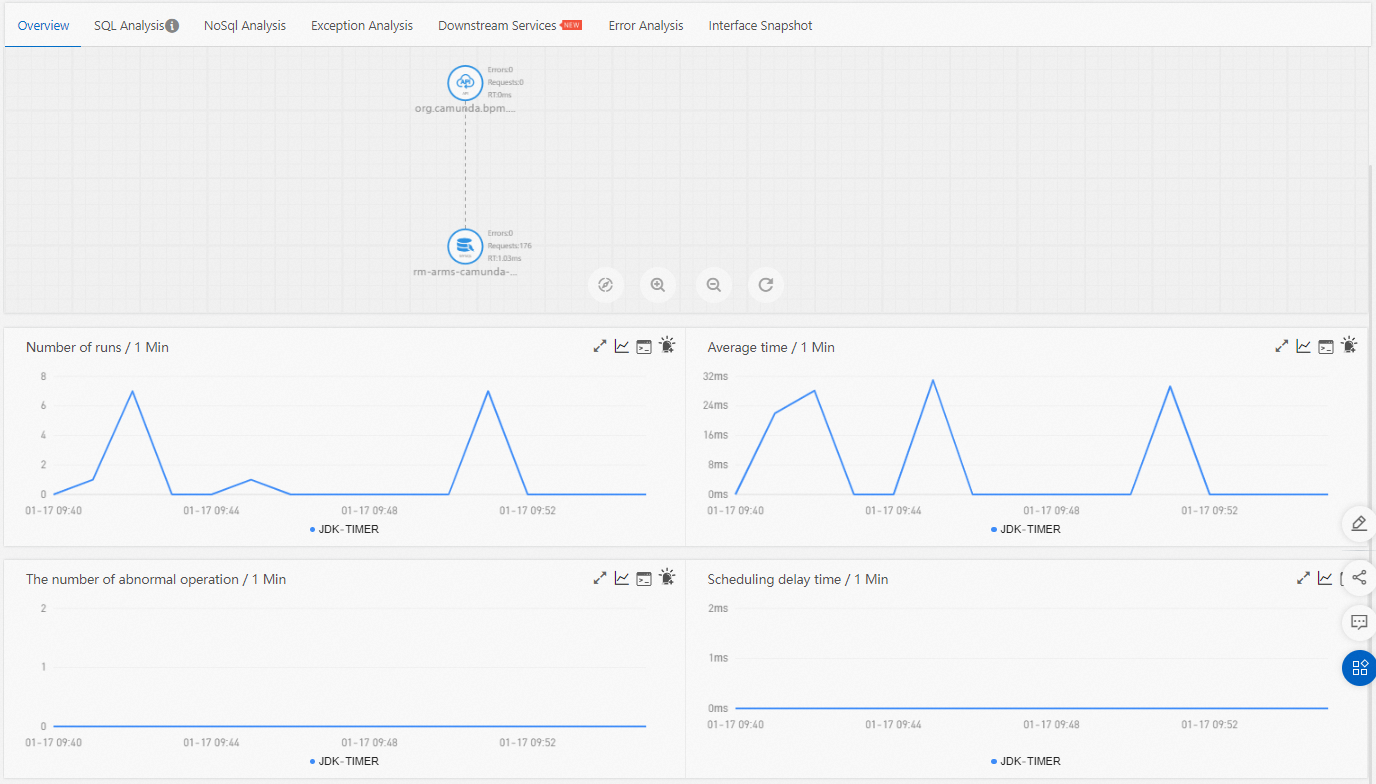
The Overview tab displays the call topology of the selected scheduled task and four time series charts. Use the topology to understand which services and resources the task depends on, and use the charts to spot trends such as rising execution time or growing exception counts.
| Chart | Description |
|---|---|
| Number of runs | Execution count per time window |
| Average running time | Mean duration per execution |
| Number of exceptions | Java exceptions thrown during execution |
| Scheduling latency | Delay between the scheduled trigger time and actual start time |
SQL analysis and NoSQL analysis
The SQL Analysis and NoSql Analysis tabs list SQL and NoSQL requests initiated by the selected scheduled task. Use these tabs to locate slow queries that cause slow responses of an API.
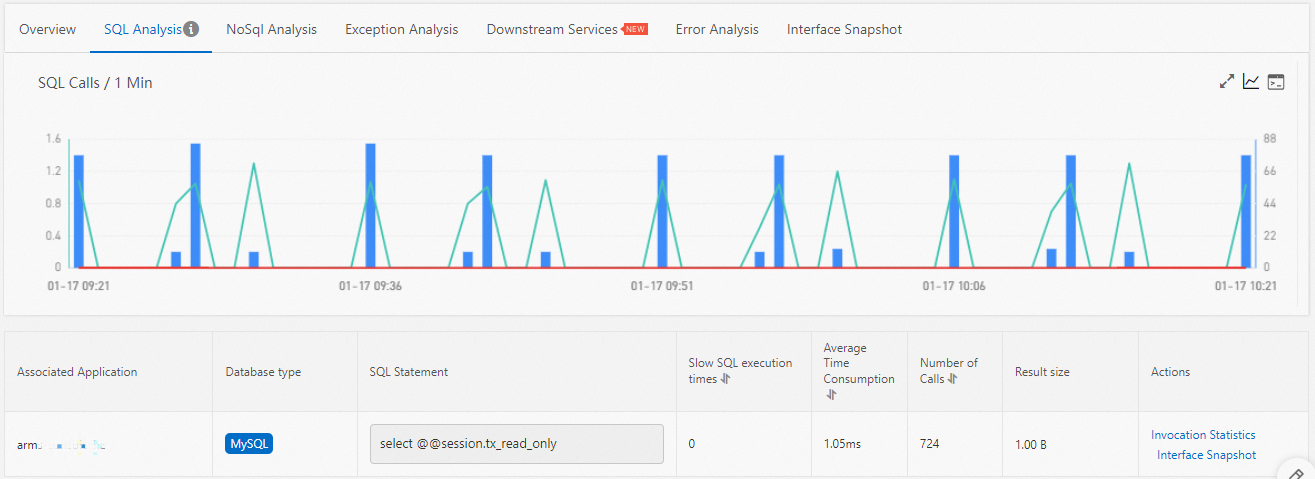
For each statement in the list:
Click Invocation Statistics in the Actions column to view a time series chart of call statistics.
Click Invocation Trace Query in the Actions column to view the traces for that statement. For details, see View traces.
Exception analysis
The Exception Analysis tab lists Java exceptions thrown from the scheduled task code. Use this tab to identify recurring code-level issues that coincide with task failures.
For each exception:
Click Invocation Statistics in the Actions column to view a time series chart showing how often the exception occurs.
Click Invocation Trace Query in the Actions column to view the associated traces. For details, see View traces.
Error analysis
The Error Analysis tab shows error statistics for the scheduled task. Use this tab to correlate application-level errors with specific trace data and logs.
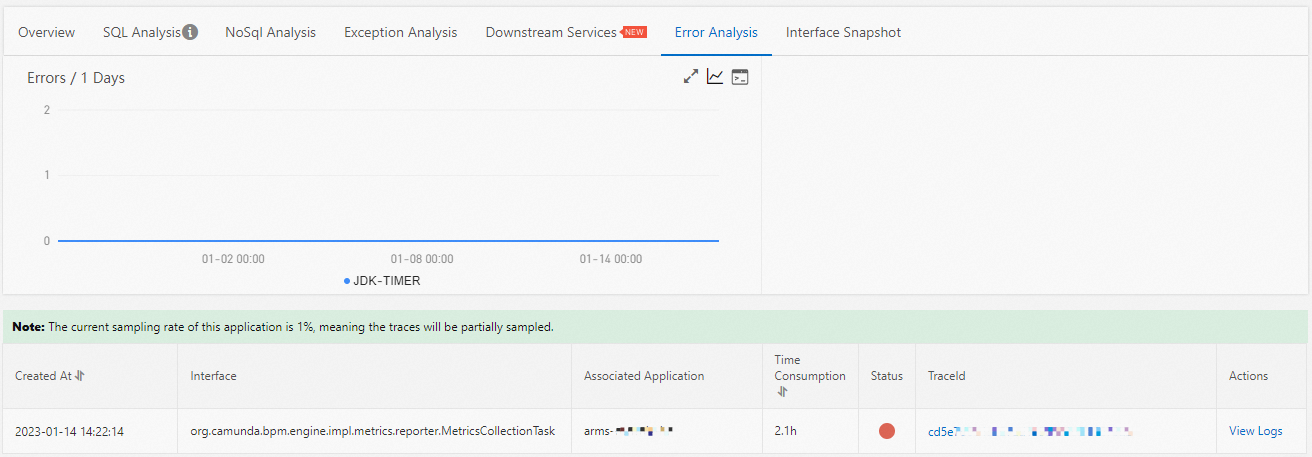
For each error in the list:
Click the trace ID in the TraceId column to open the trace details. For more information, see Trace query.
Click View Logs in the Actions column to view the associated error logs.
Downstream services
The Downstream Services tab shows all services called by the application. Use this tab to determine whether a failing or slow dependency is affecting task performance.
Each service entry includes three performance metrics:
| Metric | Description |
|---|---|
| Response time | Request latency |
| Number of requests | Request count |
| Number of errors | Error count |
To navigate the list:
Click Expand/Collapse All to show or hide all API details at once.
Enter an application name or API name in the search box and click the Search icon to filter results.
Click the collapse panel or the arrow icon at the end of a row to show or hide the performance metrics for a specific API.
View traces
The Interface Snapshot tab provides trace-level visibility into individual task executions. It contains two charts and a details table.
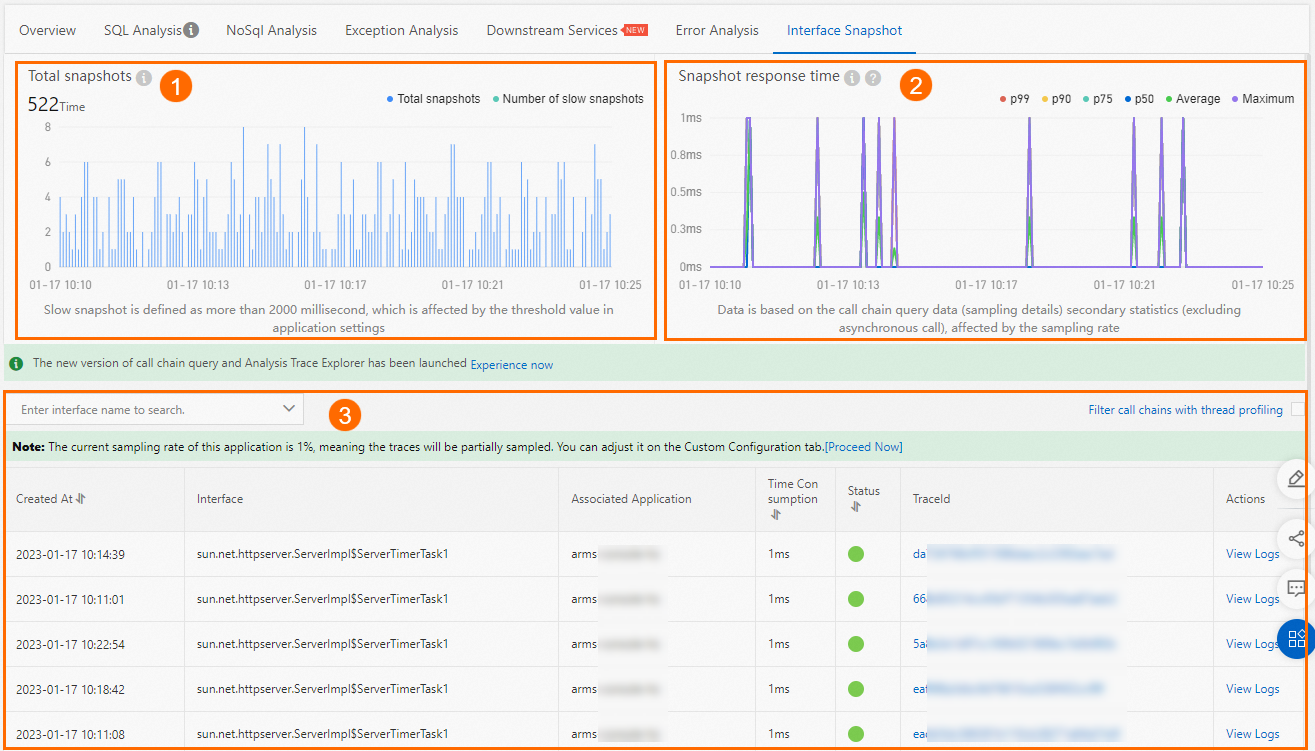
Total snapshots chart
Displays the number of normal and slow traces over time. A trace is classified as slow when its response time exceeds 500 milliseconds. This threshold is controlled by the Interface Response Time Threshold parameter in your application settings.
Slow trace counts do not include sub-traces generated by asynchronous calls to on-premises APIs.
Snapshot response time chart
Shows how response times trend over time. This chart is based on sampled trace data and is affected by the sampling rate configured for your application.
Trace details table
Lists individual traces with metadata. Click a value in the TraceId column to open the full trace view. For more information, see Trace details.
Click View Logs in the Actions column to view the logs associated with a specific trace.
To correlate traces with your application logs, associate trace IDs with business logs. This enables direct access to relevant logs when troubleshooting errors. For setup instructions, see Associate trace IDs with business logs.
Troubleshoot scheduled task issues
When a scheduled task behaves unexpectedly, use the following approach to progressively narrow down the root cause:
Check the overview for anomalies. Start on the Overview tab. Look at the time series charts for spikes in scheduling latency, increased exception counts, or longer-than-normal execution times.
Investigate slow queries. If the issue involves slow execution, go to SQL Analysis or NoSql Analysis to find slow database queries that may be blocking the task.
Review exceptions. Check the Exception Analysis tab for Java exceptions that coincide with the anomaly.
Check application errors. Review the Error Analysis tab for application-level errors and click through to the associated traces and logs.
Examine dependencies. Open the Downstream Services tab to determine whether a dependency is slow or returning errors.
Trace to the root cause. Use the Interface Snapshot tab to examine individual traces and identify the exact span where the bottleneck or failure occurs.