When applications run in Kubernetes pods, resource bottlenecks such as CPU throttling, memory pressure, or network packet loss can degrade performance without clear symptoms at the application layer. The Container monitoring tab in ARMS displays pod-level CPU, memory, and network metrics so you can correlate infrastructure resource consumption with application behavior and identify the root cause faster.
Prerequisites
Before you begin, make sure that you have:
An application deployed in a Container Service for Kubernetes (ACK) cluster
The ACK cluster monitored by Managed Service for Prometheus. For more information, see Create a Prometheus instance to monitor an ACK cluster
An ARMS agent (ack-onepilot component) installed for the application. For more information, see Install an ARMS agent for Java applications deployed in ACK
Open the container monitoring tab
Log on to the ARMS console.
In the left-side navigation pane, choose Application Monitoring > Applications.
On the Applications page, select a region in the top navigation bar and click the name of the application.
If the
 icon is displayed in the Language column, the application is connected to Application Monitoring. If a hyphen (-) is displayed, the application is connected to Managed Service for OpenTelemetry.
In the left-side navigation pane, click Application Details.
On the Application Details page, select a pod, set the time period, and then click the Container monitoring tab.
Available metrics
The Container monitoring tab contains four metric sections. Each section displays time-series charts for the selected pod and time period.
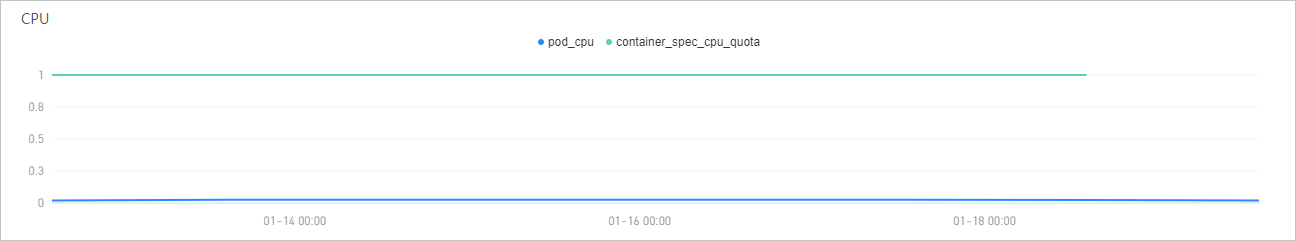
CPU
The CPU section displays the following metrics:
| Metric | Description |
|---|---|
| Cumulative CPU usage | The accumulated CPU consumption of the pod over the selected time period. Compare this value against the CPU quota to determine whether the pod is approaching its allocation limit. A consistently high ratio may indicate that you need to increase the CPU request or limit for the pod. |
| CPU quota | The CPU resource quota allocated to the pod. |
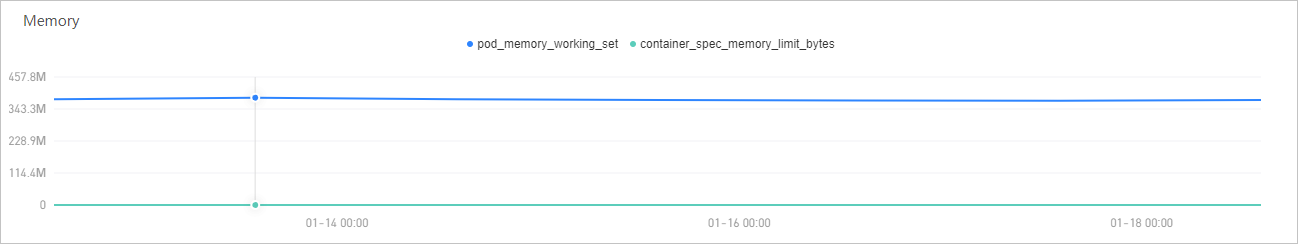
Memory
The Memory section displays physical memory metrics:
| Metric | Description |
|---|---|
| Memory usage | The physical memory consumed by the pod. If usage consistently approaches the quota, the pod risks OOMKill (out-of-memory termination). Consider increasing the memory limit or optimizing application memory consumption. |
| Memory quota | The memory resource quota allocated to the pod. |
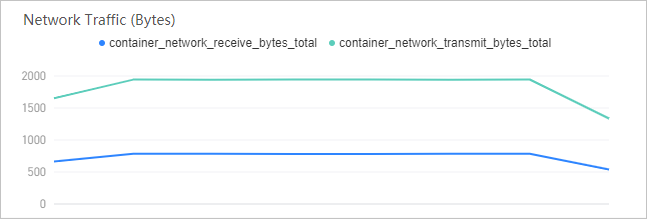
Network traffic
The Network Traffic (Bytes) section tracks the data volume transmitted and received by the pod:
| Metric | Description |
|---|---|
| Received network traffic (bytes) | Inbound data volume. A sudden spike may indicate an unexpected traffic surge or a distributed denial-of-service (DDoS) event. |
| Sent network traffic (bytes) | Outbound data volume. A sustained increase can indicate growing response payloads or excessive logging to external services. |
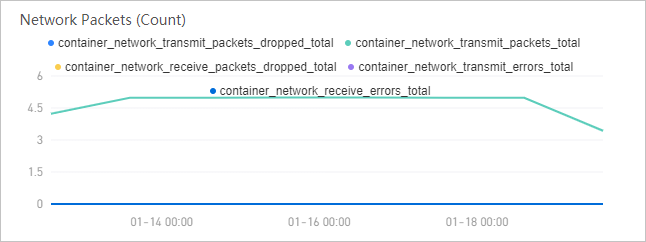
Network packets
The Network Packets (Count) section provides packet-level statistics to help identify transmission issues:
| Metric | Description |
|---|---|
| Number of discarded network packets among the sent network packets | Outbound packets dropped before transmission. Non-zero values may indicate network congestion or buffer overflow. |
| Number of sent network packets | Total outbound packets transmitted by the pod. |
| Number of discarded network packets among the received network packets | Inbound packets dropped before delivery to the application. |
| Number of errors that have occurred when network packets were sent | Errors encountered during outbound packet transmission. Persistent errors suggest NIC or driver issues. |
| Number of errors that have occurred when network packets were received | Errors encountered during inbound packet reception. |
Interact with charts
All metric charts on the Container monitoring tab support the following interactions:
| Action | How to |
|---|---|
| View exact values | Hover over any data point to see the metric value and timestamp. |
| Zoom into a time range | Click and drag across the chart to select a specific time window. The chart rescales to show only the selected period. |
| Filter by metric | Click a metric name in the legend to show or hide that metric on the chart. |
Investigate a metric spike:
Identify the spike in one of the metric charts.
Click and drag across the spike to zoom into the relevant time window.
Hover over the peak to read the exact value and timestamp.
Switch between the CPU, memory, and network sections to check whether the spike correlates with changes in other resource dimensions. For example, a memory usage spike accompanied by increased network traffic may indicate a sudden influx of requests.