Application Real-Time Monitoring Service (ARMS) automatically traces message publishing and topic subscription for Message Queue for Apache RocketMQ. The MQ monitoring page provides topology maps, publishing and subscription statistics, and trace-level snapshots so you can identify bottlenecks, track error rates, and diagnose failures.
Prerequisites
Before you begin, make sure that you have:
An ARMS-monitored application that uses Message Queue for Apache RocketMQ
Access to the ARMS console
Open the MQ monitoring page
Log on to the ARMS console.
In the left-side navigation pane, choose Application Monitoring > Applications.
On the Applications page, select a region in the top navigation bar, then click the name of the application.
If the
 icon appears in the Language column, the application is connected to Application Monitoring. If a hyphen (-) appears, the application is connected to Tracing Analysis.
In the left-side navigation pane, click MQ Monitoring.
Click a search result link on the right side of the page.
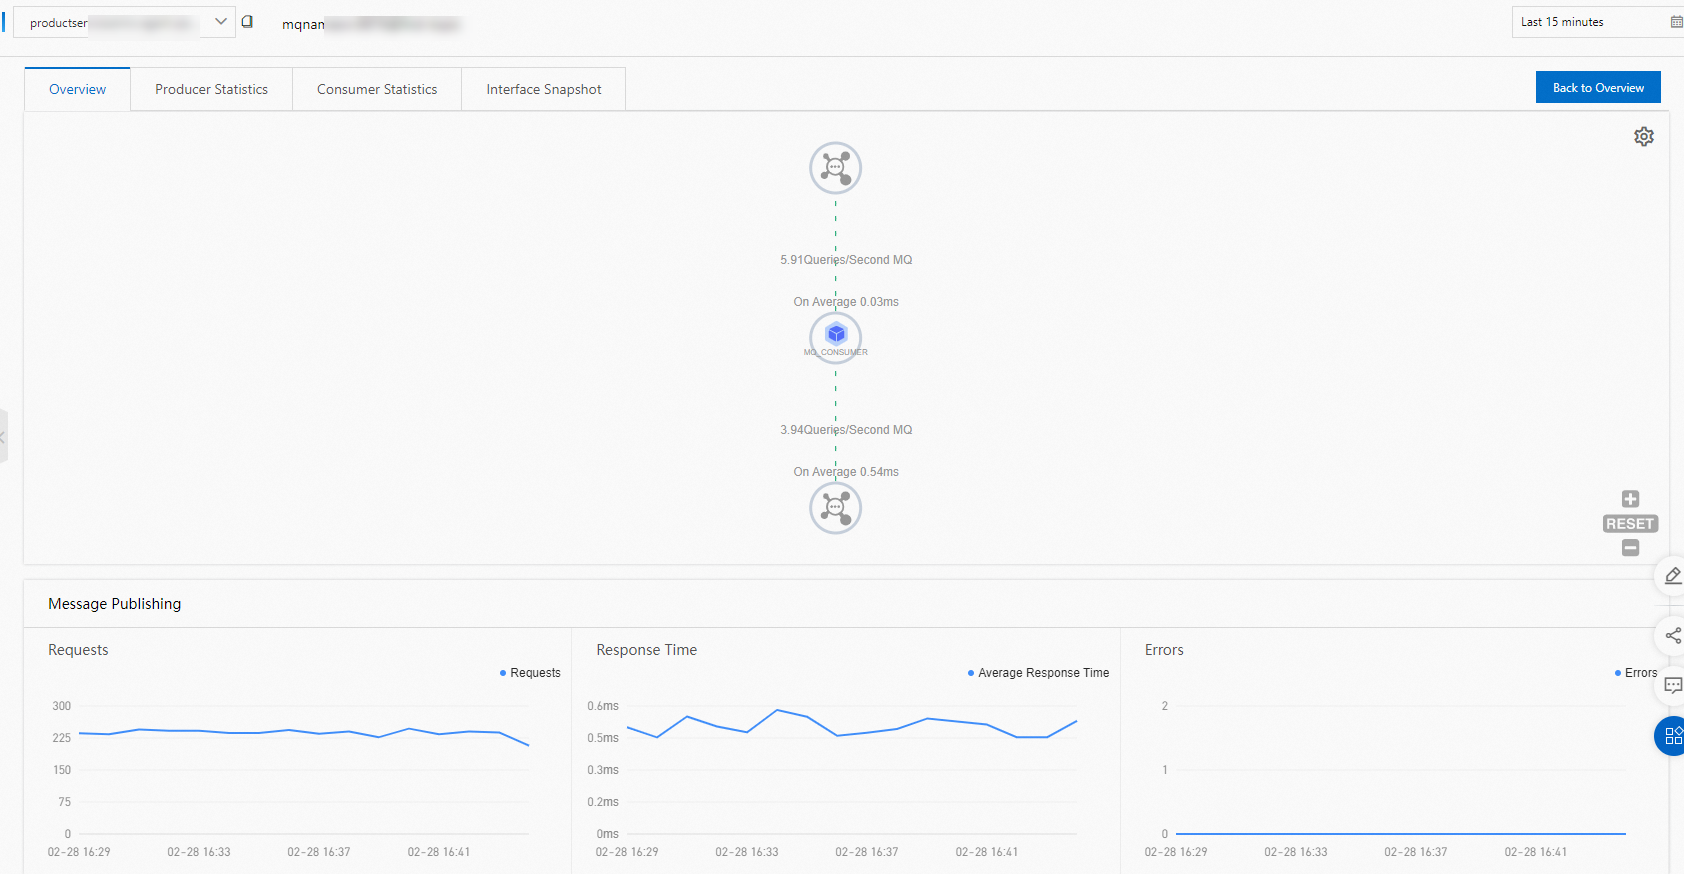
Topology and statistics
The MQ monitoring page has four tabs. The following table summarizes what each tab shows and when to use it.
| Tab | Metrics / content | Typical use |
|---|---|---|
| Overview | Topological graph of publishing and subscription relationships between the application and the MQ data source | Identify which services produce or consume messages and how they connect |
| Publishing Statistics | Request count, response time, error count for message publishing | Detect latency spikes or rising error rates in message publishing |
| Subscription Statistics | Request count, response time, error count for message subscription | Monitor consumer throughput and spot processing delays |
| Interface Snapshot | Individual message publishing and subscription calls with trace details | Pinpoint the root cause of slow or failed message operations |
Overview
Shows a topological graph of publishing and subscription relationships between your application and the MQ data source.
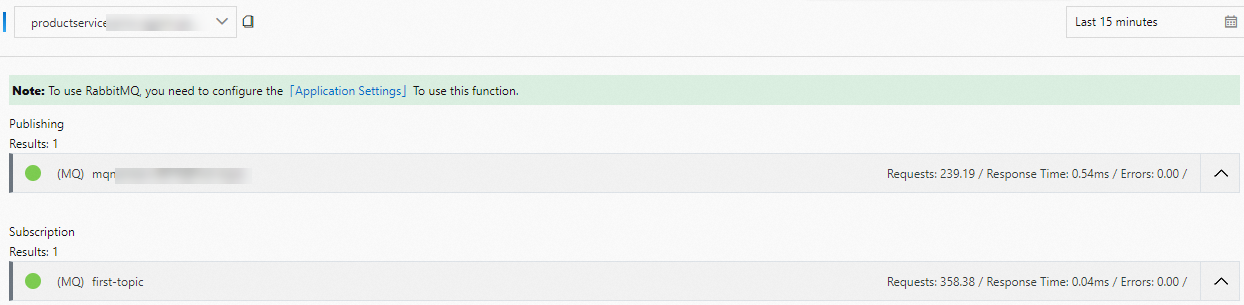
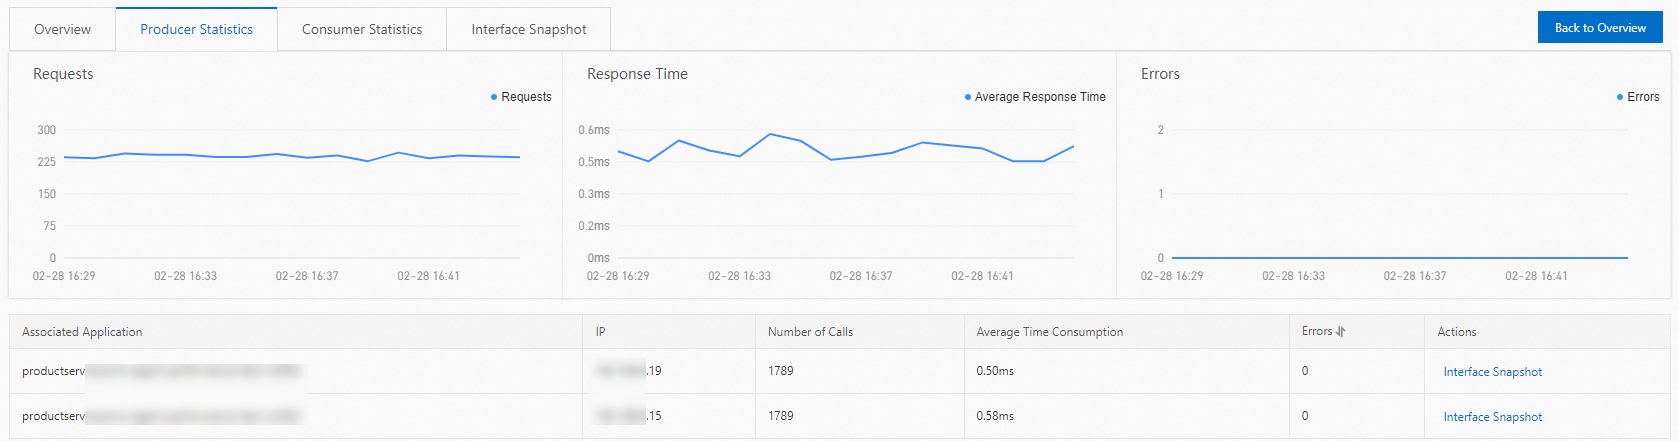
Publishing statistics
Shows metrics for message publishing:
| Metric | Description |
|---|---|
| Request count | Total number of publish requests |
| Response time | Latency of publish operations |
| Error count | Number of failed publish requests |
Use this tab to detect latency spikes or rising error rates in message publishing.
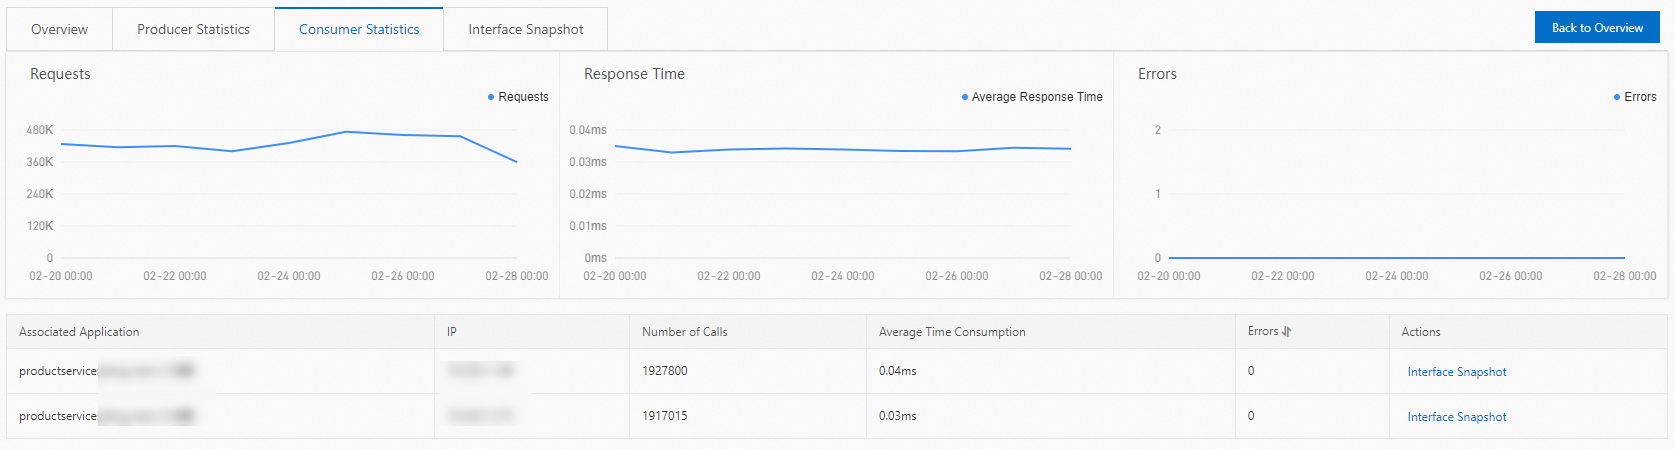
Subscription statistics
Shows metrics for message subscription:
| Metric | Description |
|---|---|
| Request count | Total number of consume requests |
| Response time | Latency of consume operations |
| Error count | Number of failed consume requests |
Use this tab to monitor consumer throughput and spot processing delays.
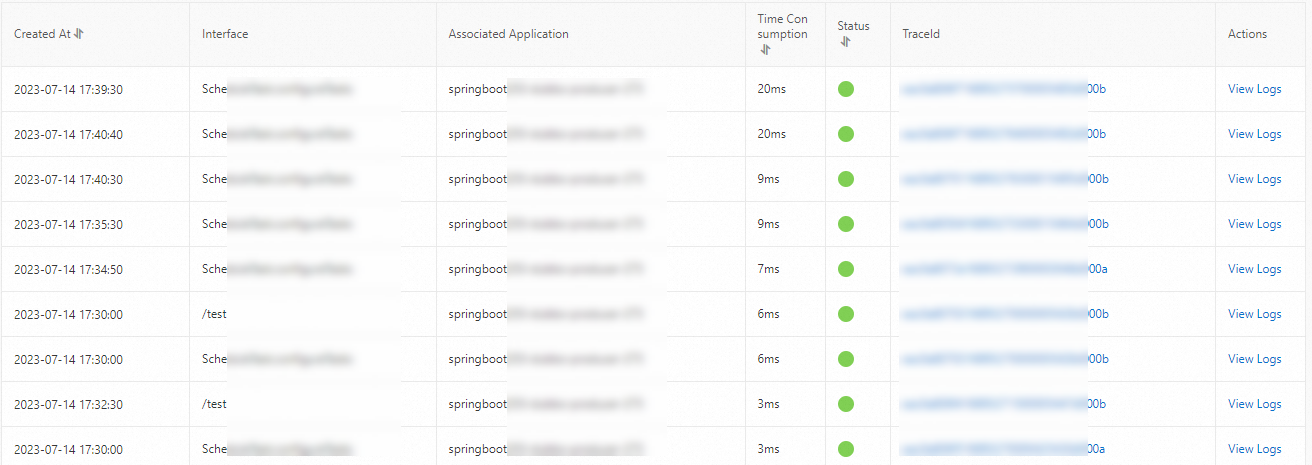
Interface snapshot
Lists individual message publishing and subscription calls with trace details. Click a value in the TraceId column to open the full distributed trace and inspect upstream and downstream service calls. This is useful for pinpointing the root cause of slow or failed message operations.