When monitoring LLM applications, you need visibility into both individual conversations and model-level performance trends. The Scenario-based Analysis page in Application Real-Time Monitoring Service (ARMS) provides two tabs -- Session analysis and Model analysis -- to help you inspect multi-turn conversations and compare model usage metrics across a specified time period.
How sessions and traces relate
ARMS organizes LLM monitoring data into a hierarchy of sessions and traces:
| Concept | Definition | Example |
|---|---|---|
| Session | A group of related traces from a multi-turn conversation | A user asks a chatbot three follow-up questions. All resulting traces belong to one session. |
| Trace | A single request-response cycle within a session | One question-and-answer exchange, including token usage, latency, and execution spans |
Use Session analysis to view conversation-level data, then drill down into individual traces for execution details. Switch to Model analysis to view aggregated performance metrics for a specific model.
Prerequisites
Before you begin, make sure that you have:
An ARMS agent for Python installed for your LLM applications
For installation instructions, see Monitor LLM applications in ARMS.
Session analysis
The Session analysis tab lists all sessions within the selected time period.
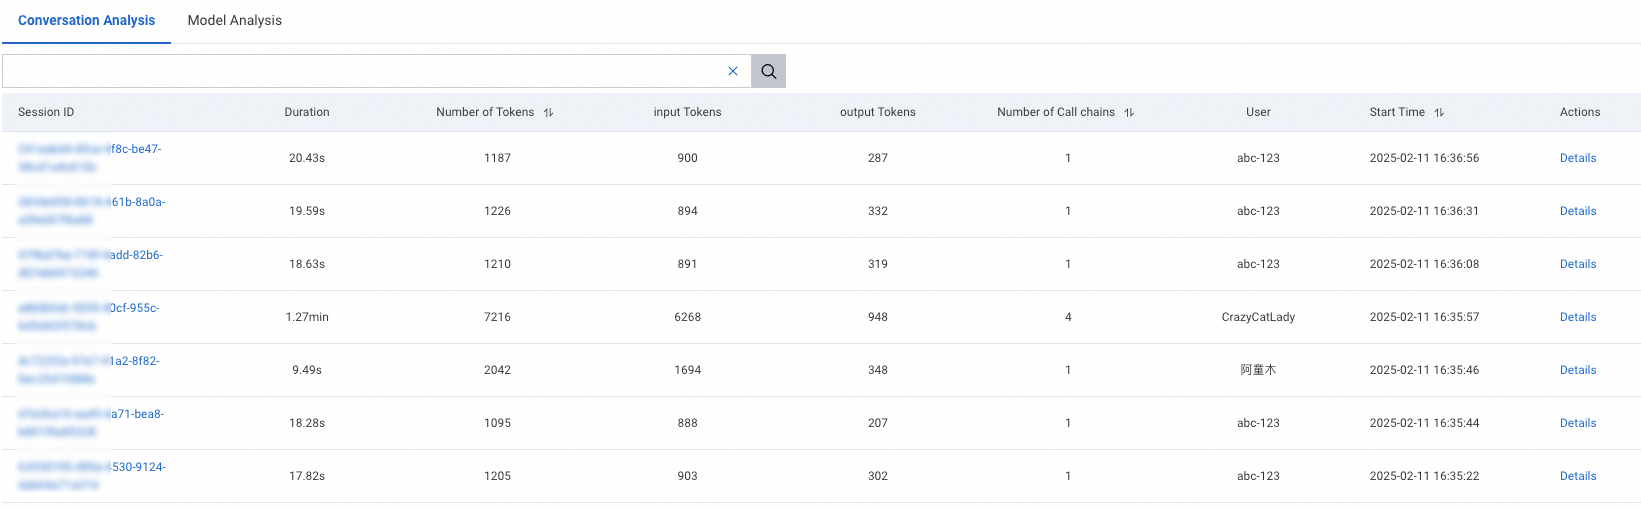
Filter sessions
Click the search box at the top of the page to open the filter drop-down menu. The following filter criteria are available:
| Filter | Description | Example use case |
|---|---|---|
| Session ID | Unique identifier for the session | Locate a specific session reported by a user |
| User | End user associated with the session | Analyze usage patterns for a specific user |
| Session duration | Total duration of the session | Find slow interactions that exceed a latency threshold |
| Number of traces | Total request-response cycles in the session | Identify sessions with unusually many turns |
| Total tokens | Combined input and output tokens consumed | Detect expensive conversations with high token consumption |
| Input tokens | Tokens in user prompts | Find sessions with long or complex user inputs |
| Output tokens | Tokens in model responses | Find sessions with verbose model outputs |

Combine multiple filters to narrow results. For example, filter by high total token counts and long session duration together to identify conversations that are both expensive and slow.
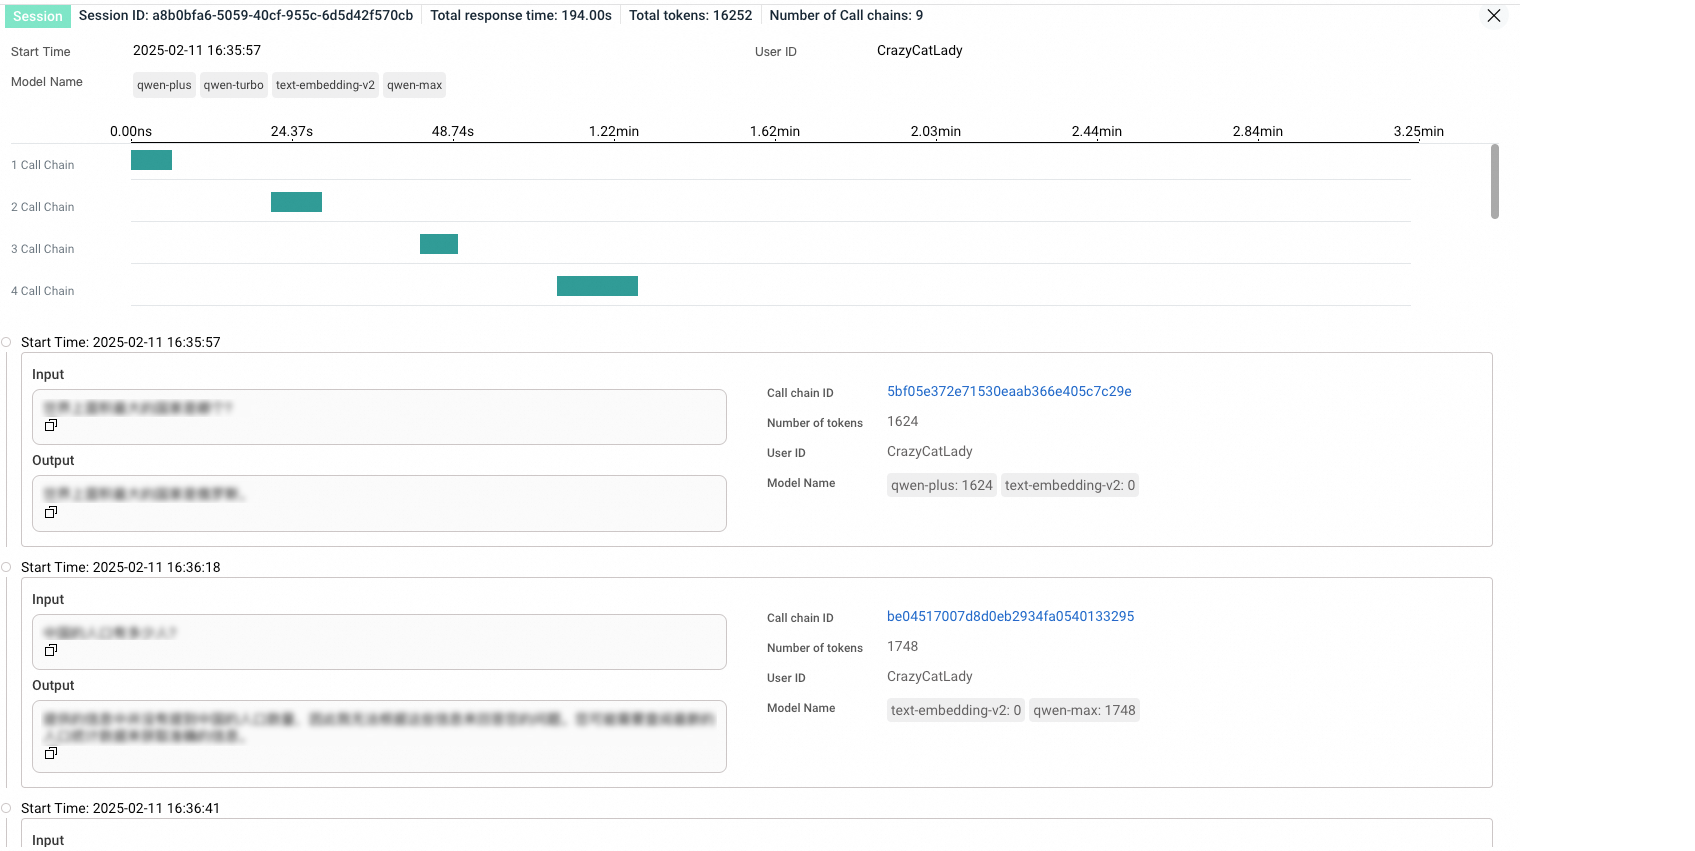
View session details
Click a session name or click Details in the Actions column to open the session details page.
The details page lists all traces within the selected session. Each row shows trace-level metrics such as token usage and latency. Click a trace ID to view its execution path, including individual spans and timing data. For more information, see LLM Trace Explorer.
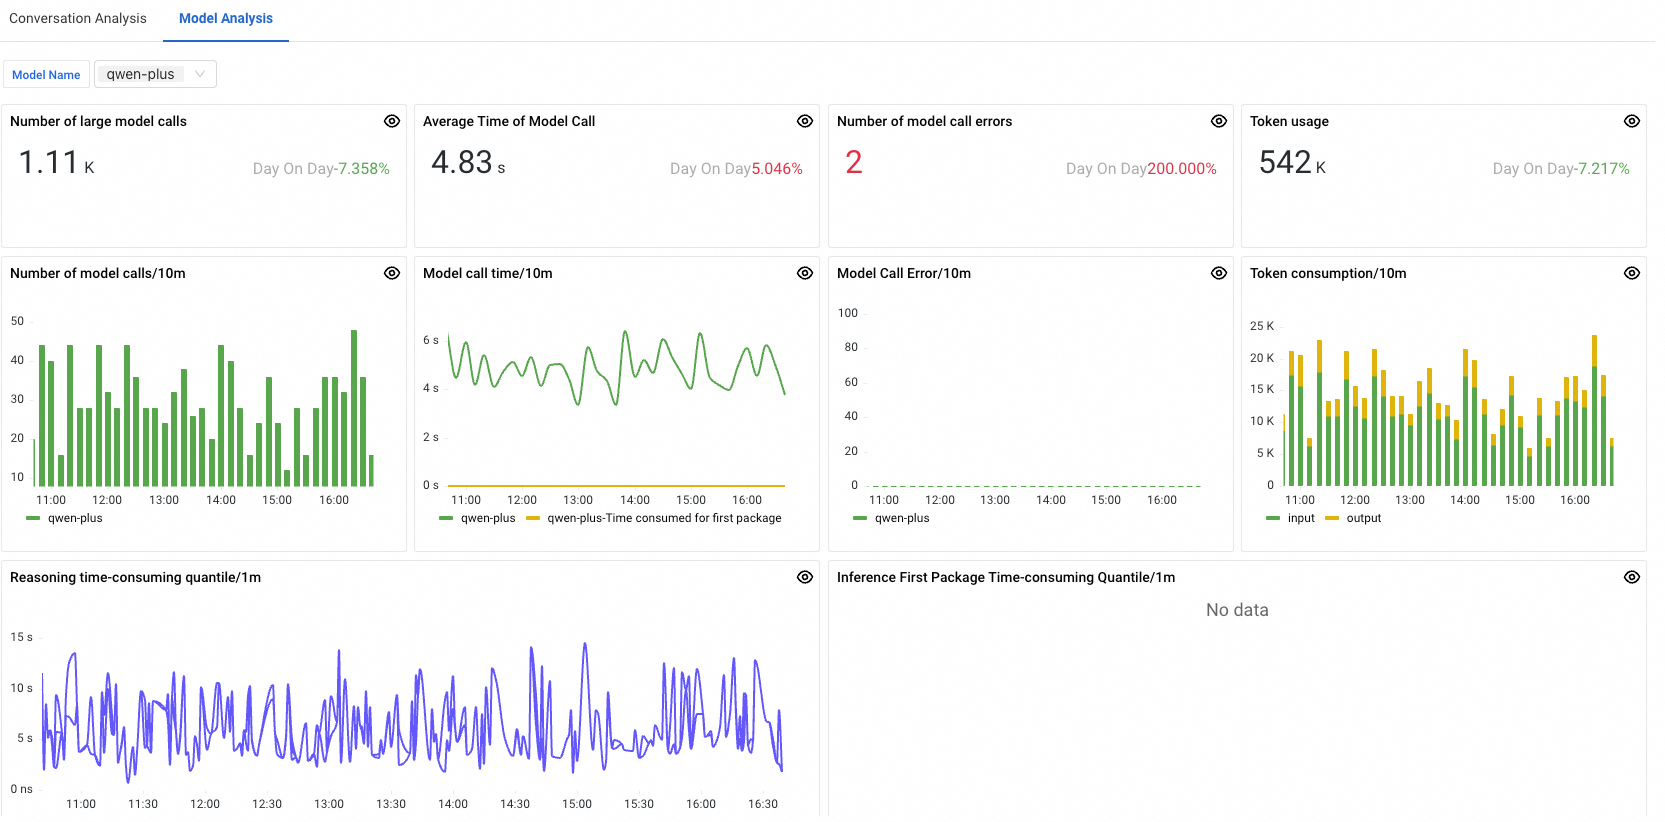
Model analysis
The Model analysis tab aggregates performance metrics by model, allowing you to compare token consumption, latency, and error rates across the models used by your LLM application.
To view metrics for a specific model, select the model from the drop-down list in the upper-left corner of the tab.
For definitions of all available LLM metrics, see LLM metrics.
Related topics
LLM Trace Explorer: Inspect individual trace execution paths and span-level details.
LLM metrics: Review the full list of LLM monitoring metrics.
Monitor LLM applications in ARMS: Configure the ARMS agent for Python to enable LLM monitoring.