After you install an ARMS agent for Python on a Large Language Model (LLM) application, Application Real-Time Monitoring Service (ARMS) automatically collects performance data for operations in your LLM pipeline. The LLM operation tab provides invocation volume, latency, and error metrics for four operation categories.
Use these metrics to identify latency bottlenecks, track error rates, and pinpoint the specific models or functions that degrade performance.
|
Operation category |
What it monitors |
Typical use case |
|
Embedding |
Text-to-vector conversion calls |
Detect slow or failing embedding models in similarity search and classification pipelines |
|
Search enhancement |
Retrieval and Reranking stages in RAG pipelines |
Identify which RAG stage -- retrieval or reranking -- introduces latency or errors |
|
Tool call |
External tool and API calls made by the LLM (search engines, databases, calculators) |
Find unreliable external dependencies that cause timeouts or failures |
|
Method calls |
Internal custom methods and task operations within your application |
Locate bottlenecks in custom business logic and internal processing |
Each category provides three metric tiers:
|
Tier |
What it shows |
When to use |
|
Aggregated metrics |
Totals and averages for the selected time range |
Get an overall health check of the operation category |
|
Per-minute trends |
Minute-by-minute time series |
Correlate performance changes with deployments or traffic spikes |
|
Rankings (Top 5) |
Top 5 functions, models, or tools by volume, latency, or errors |
Identify which specific component needs optimization |
Prerequisites
Before you begin, make sure that you have:
-
An ARMS agent installed for the LLM application. For details, see Monitor LLM applications in ARMS
Access the LLM operation tab
-
Log on to the ARMS console. In the left-side navigation pane, choose LLM Application Monitoring > Application List.
-
On the page that appears, select a region in the top navigation bar and click the application that you want to manage.
-
In the top navigation bar, select a tab from the LLM operation dropdown list.
Embedding
Embedding converts text, images, or other data types into low-dimensional vectors that capture semantic meaning. These vectors power similarity calculation, retrieval, and classification tasks in your LLM application.
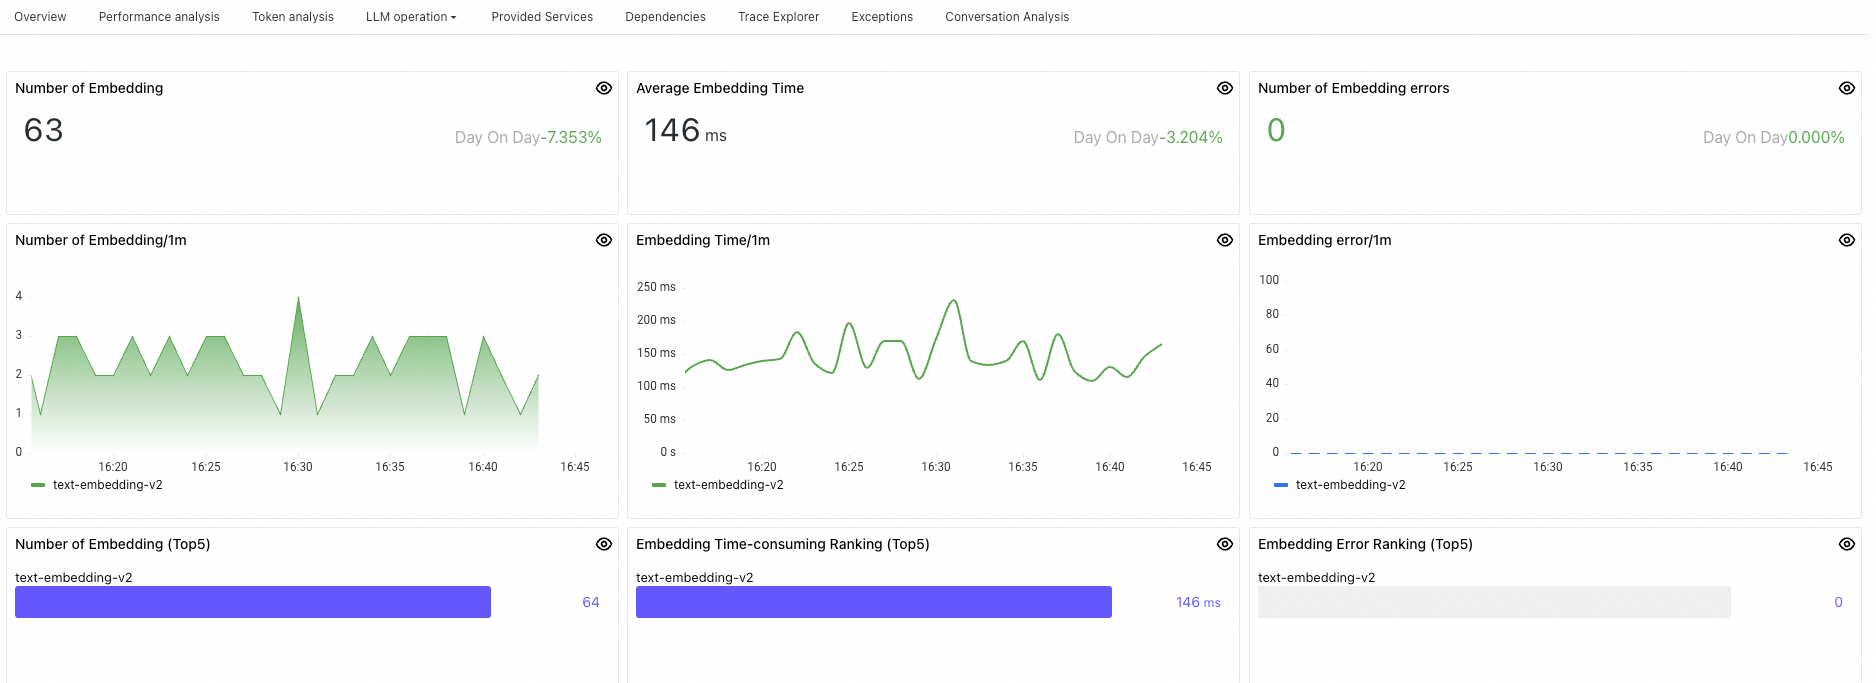
Panel
Description
Number of Embedding
Total embedding invocations within the selected time range.
Average Embedding Time
Average latency across all embedding invocations within the selected time range.
Number of Embedding errors
Total failed embedding invocations within the selected time range.
Number of Embedding/1m
Embedding invocations per minute.
Embedding Time/1m
Average embedding latency per minute.
Embedding error/1m
Failed embedding invocations per minute.
Number of Embedding (Top5)
Top 5 embedding functions or models by invocation count, sorted highest to lowest.
Embedding Time-consuming Ranking (Top5)
Top 5 embedding functions or models by average latency, sorted highest to lowest.
Embedding Error Ranking (Top5)
Top 5 embedding functions or models by error count, sorted highest to lowest.
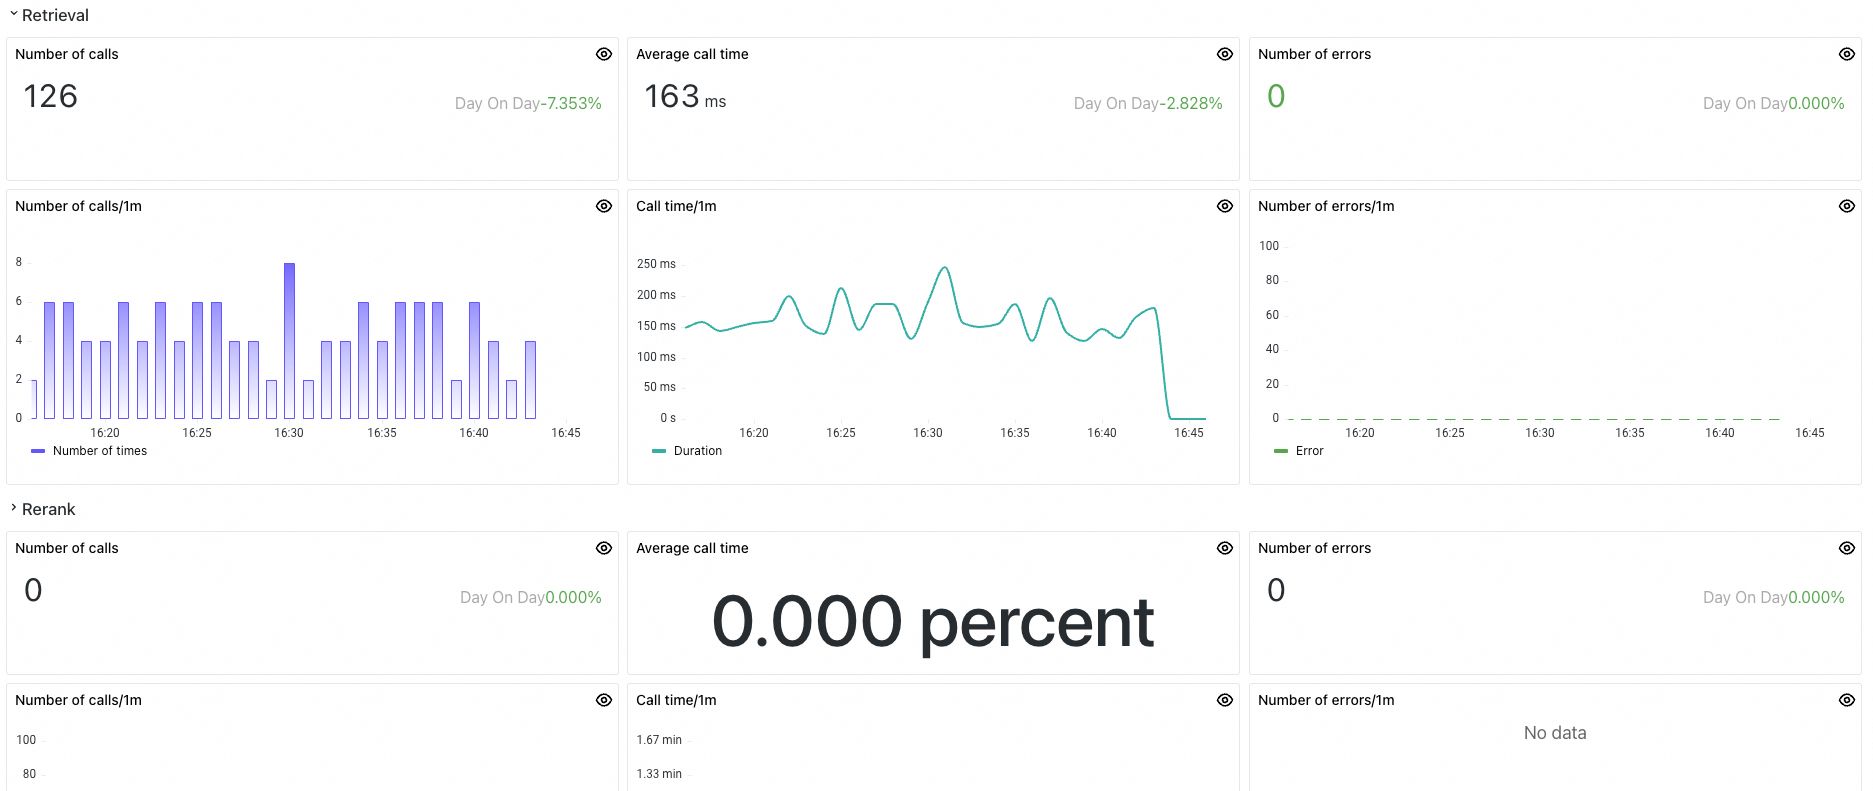
Search enhancement
Retrieval-Augmented Generation (RAG) combines retrieval and reranking to improve the relevance and accuracy of LLM-generated content. The search enhancement dashboard monitors both stages separately, so you can identify whether retrieval or reranking is the bottleneck.
Panel
Description
Retrieval metrics
Number of calls
Total retrieval invocations within the selected time range.
Average call time
Average latency across all retrieval operations within the selected time range.
Number of errors
Total failed retrieval invocations within the selected time range.
Number of calls/1m
Retrieval invocations per minute.
Call time/1m
Average retrieval latency per minute.
Number of errors/1m
Failed retrieval invocations per minute.
Rerank metrics
Number of calls
Total rerank invocations within the selected time range.
Average call time
Average latency across all rerank operations within the selected time range.
Number of errors
Total failed rerank invocations within the selected time range.
Number of calls/1m
Rerank invocations per minute.
Call time/1m
Average rerank latency per minute.
Number of errors/1m
Failed rerank invocations per minute.
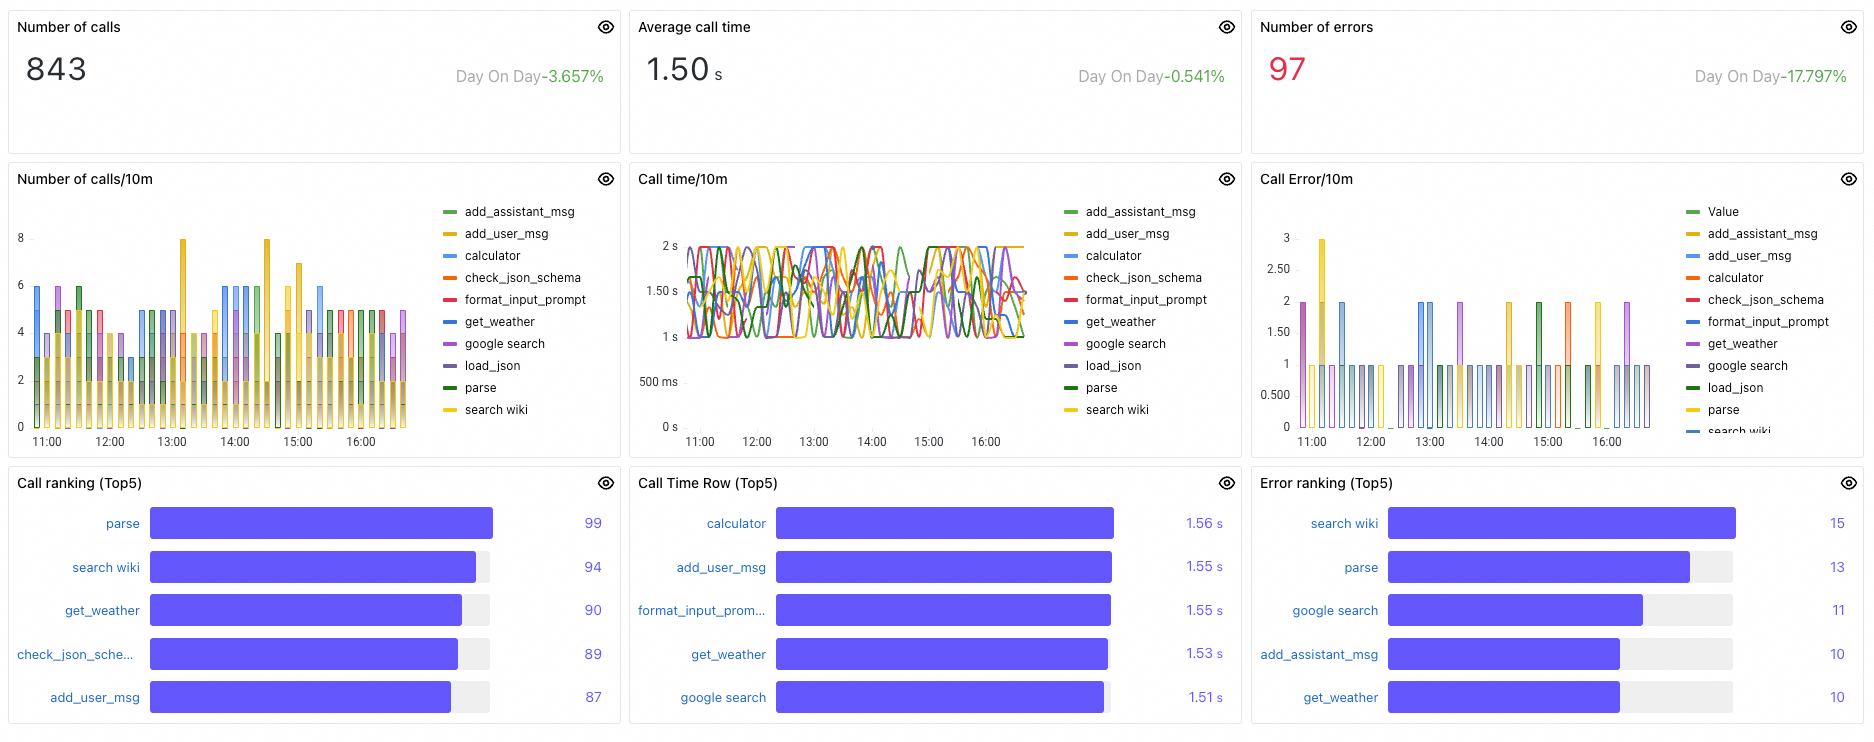
Tool call
Tool invocation is the process where an LLM calls external tools or APIs to perform tasks such as calculations, database queries, web searches, or translations. These tools can include calculators, database query interfaces, search engines, and translation services, serving to extend the capabilities of the LLM so it can handle more complex or specific tasks.
Panel
Description
Number of calls
Total tool invocations within the selected time range.
Average call time
Average latency across all tool invocations within the selected time range.
Number of errors
Total failed tool invocations within the selected time range.
Number of calls/10m
Tool invocations per minute.
Call time/10m
Average tool invocation latency per minute.
Call Error/10m
Failed tool invocations per minute.
Call ranking (Top5)
Top 5 tools by invocation count, sorted highest to lowest.
Call Time Row (Top5)
Top 5 tools by average latency, sorted highest to lowest.
Error ranking (Top5)
Top 5 tools by error count, sorted highest to lowest.
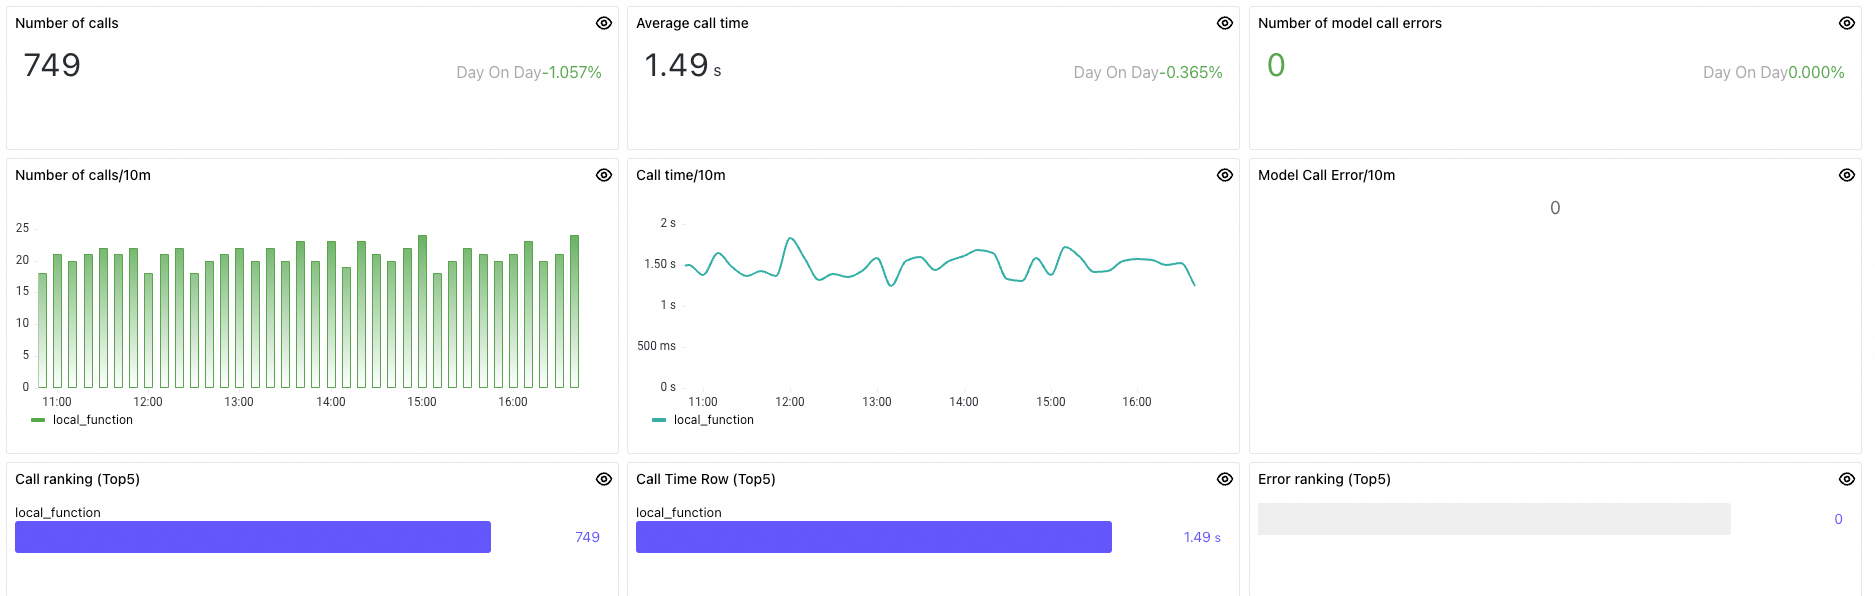
Method calls
Method calls track internal custom methods -- local method invocations and important task operations that run within your application. These metrics help you identify bottlenecks in custom logic and evaluate internal processing efficiency.
Panel
Description
Number of calls
Total task invocations within the selected time range.
Average call time
Average latency across all task invocations within the selected time range.
Number of model call errors
Total failed task invocations within the selected time range.
Number of calls/10m
Task invocations per minute.
Call time/10m
Average task invocation latency per minute.
Model Call Error/10m
Failed task invocations per minute.
Call ranking
Top 5 tasks by invocation count, sorted highest to lowest.
Call Time Row (Top5)
Top 5 tasks by average latency, sorted highest to lowest.
Error ranking (Top5)
Top 5 tasks by error count, sorted highest to lowest.