After installing an ARMS agent for Python for a Large Language Model (LLM) application, Application Real-Time Monitoring Service (ARMS) can start monitoring the application. You can view information such as the number of times the LLM is invoked, average duration, number of invocation errors on the Performance analysis tab of the application details page.
Prerequisites
An ARMS agent has been installed for the LLM application. For more information, see Monitor LLM applications in ARMS.
Go to the Performance analysis tab
Log on to the ARMS console. In the left-side navigation pane, choose .
On the page that appears, select a region in the top navigation bar and click the application that you want to manage.
In the top navigation bar, click the Performance analysis tab.
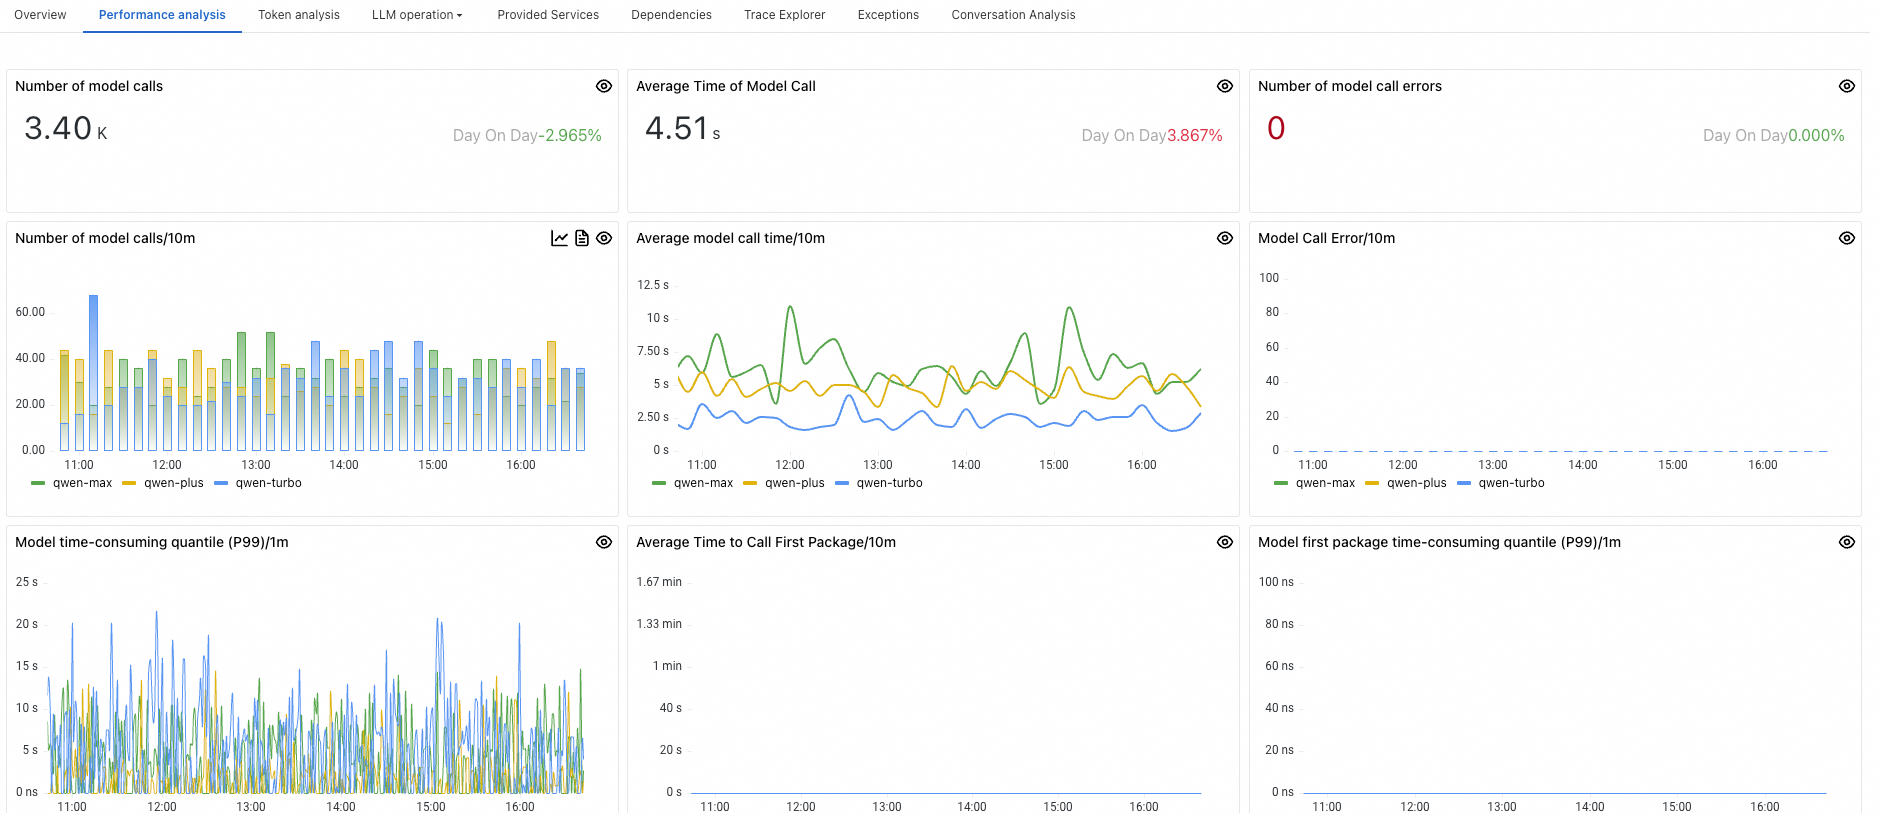
Panel
Description
Number of model calls
The number of times the LLM was invoked by the application within a specified time period.
Average Time of Model Call
The average duration taken by the application to invoke the LLM within a specified time period.
Number of model call errors
The number of unsuccessful attempts to invoke the LLM by the application within a specified time period.
Number of model calls/10m
The frequency of LLM invocations by the application per minute.
Average model call time/10m
The average duration for invoking the LLM per minute.
Model Call Error/10m
The number of invocation errors occurring per minute.
Model time-consuming quantile (P99)/1m
The P99 percentile value of the time consumed per minute by the application when invoking the LLM.
Average Time to Call First Package/10m
The average time it takes for the application to receive the first packet of data from the LLM per minute.
Model first package time-consuming quantile (P99)/1m
The P99 percentile value of the time taken to return the first packet when the application invoked the LLM per minute.
Top 5 Model Invocation Rankings
Displays the top 5 models with the highest invocation counts, sorted from highest to lowest based on the number of calls.
Top 5 Average Model Invocation Time Rankings
Displays the top 5 models with the longest average duration, sorted from highest to lowest based on the average time consumed.
Top 5 Model Invocation Error Rankings
Displays the top 5 models with the highest error rates, sorted from highest to lowest based on the number of invocation errors.