After installing an ARMS agent for Python for a Large Language Model (LLM) application, Application Real-Time Monitoring Service (ARMS) can start monitoring the application. You can view information such as the number of LLM invocations, token usage, trace count, and session count on the Overview tab of the application details page.
Prerequisites
An ARMS agent has been installed for the LLM application. For more information, see Monitor LLM applications in ARMS.
Go to the Overview tab
Log on to the ARMS console. In the left-side navigation pane, choose .
On the page that appears, select a region in the top navigation bar and click the application that you want to manage.
In the top navigation bar, click the Overview tab.
Dashboard
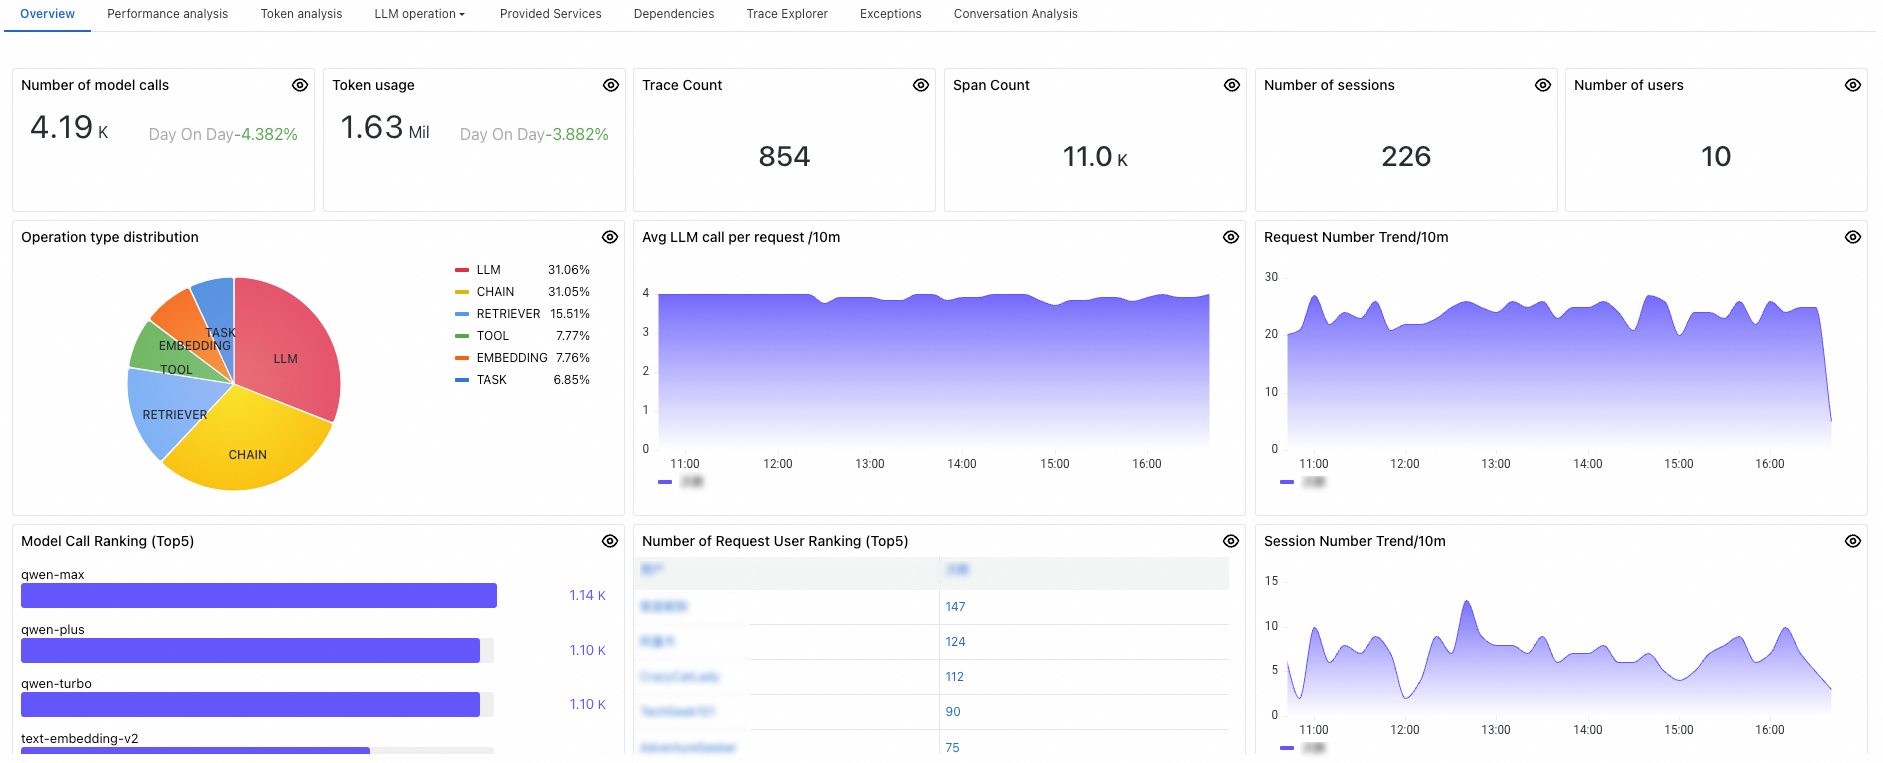
Panel | Description |
Number of model calls | The number of times the application invoked LLMs within a specified time period. |
Token usage | The number of times the token of the application was used within a specified time period. |
Trace Count | The number of traces generated by the application within a specified time period. |
Span Count | The number of spans generated by the application within a specified time period. |
Number of sessions | The number of sessions generated by the application within a specified time period. |
Number of users | The number of users of the application within a specified time period. |
Operation type distribution |
|
Avg LLM call per request | The average number of LLM invocations per request within one minute. |
Request Number Trend | The trend graph of the number of requests per minute for the application. |
Model Call Ranking | The top 5 most frequently invoked LLMs of the application. |
Number of Request User Ranking | The top 5 users who initiated the most requests in the application. |
Session Number Trend | The trend graph of the session count per minute for the application. |