When Java applications experience slow responses or outages, the root cause often lies in JVM-level issues: garbage collection (GC) pauses stalling request processing, memory leaks gradually consuming heap space, or thread contention blocking concurrent operations. JVM monitoring in Application Monitoring tracks GC activity, memory usage, and thread states, giving you the metrics to detect and diagnose these problems before they affect end users.
Prerequisites
An application connected to ARMS Application Monitoring with a Java agent installed
View JVM metrics
Log on to the ARMS console. In the left-side navigation pane, choose Application Monitoring > Application List.
On the Application List page, select a region in the top navigation bar, then click the target application name.
NoteIcons in the Language column indicate the application language:
 : Java application
 : Go application
 : Python application
Hyphen (-): application monitored in Managed Service for OpenTelemetry.
In the left-side navigation pane, click Application Details.
On the Application Details page, select the target instance in the left-side pane, then click the JVM monitoring tab.
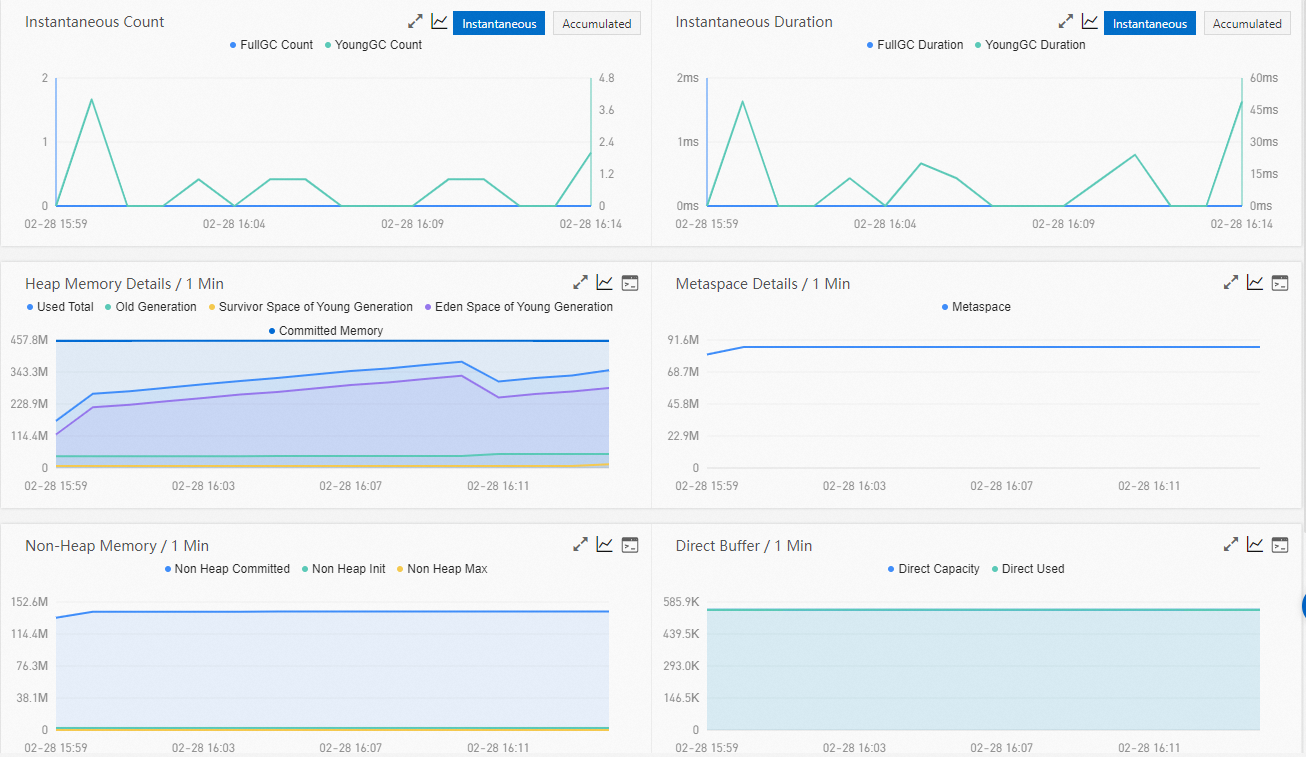
The JVM monitoring tab displays time series charts for GC activity, heap memory, metaspace, non-heap memory, direct buffer, and JVM threads.
Switch between instantaneous and accumulated views
Click Instantaneous or Accumulated in the upper-right corner of the Instantaneous Count and Instantaneous Duration charts to toggle between per-interval and cumulative GC data.
Show or hide individual metrics
Click a metric name (for example, FullGC Count) on any chart to show or hide that metric.
Each chart must display at least one metric. If only one metric is visible, it cannot be hidden.
Compare metrics across time ranges
Click the ![]() icon on a chart to view metric statistics for a specific time period or compare the same time period across different days.
icon on a chart to view metric statistics for a specific time period or compare the same time period across different days.
View related APIs
Click the View API icon in the upper-right corner of the following charts to see API-level details related to each metric:
Heap Memory Details / 1 Min
Metadata Details / 1 Min
Non-Heap Memory / 1 Min
Direct Buffer / 1 Min
JVM Threads / 1 Min
Metrics reference
GC metrics
The Instantaneous Count and Instantaneous Duration charts show GC activity. Both charts support Instantaneous (per-interval) and Accumulated (cumulative) views.
| Metric | Description |
|---|---|
| Full GC count | Number of full heap garbage collections. Frequent full GCs typically indicate heap pressure or a memory leak. |
| Young GC count | Number of garbage collections in the young generation. |
| Full GC duration | Time spent on full GCs. Long pauses directly increase application response latency. |
| Young GC duration | Time spent on young generation GCs. |
GC latency measurements differ by collector:
ZGC and Shenandoah: These collectors perform most GC work concurrently with application threads, minimizing pauses. Pauses measures stop-the-world (STW) duration, typically under 1 ms. Cycles measures total GC duration including concurrent phases.
All other collectors (such as G1, CMS, and Parallel): Latency metrics measure only STW duration -- the time all Java application threads are suspended for garbage collection.
Heap memory
The Heap Memory Details / 1 Min chart breaks down heap usage by memory pool.
| Metric | Description |
|---|---|
| Total heap memory | Total heap memory currently used by the JVM (bytes). |
| Old generation | Heap memory occupied by long-lived objects (bytes). Steady growth without a corresponding increase in data volume may indicate a memory leak. |
| Young generation (survivor space) | Heap memory in the survivor space, holding objects that survived at least one young GC (bytes). |
| Young generation (eden space) | Heap memory in the eden space, where new objects are allocated (bytes). |
Metaspace
The Metadata Details / 1 Min chart tracks class metadata storage.
| Metric | Description |
|---|---|
| Metaspace size | Memory used by the JVM metaspace (bytes). Metaspace stores class metadata and replaced the permanent generation (PermGen) in JDK 8. Unbounded growth may indicate a classloader leak. |
Non-heap memory
The Non-Heap Memory / 1 Min chart tracks memory allocated outside the heap.
| Metric | Description |
|---|---|
| Maximum non-heap memory | Upper limit of non-heap memory available to the JVM (bytes). |
| Used non-heap memory | Non-heap memory currently in use (bytes). |
Direct buffer
The Direct Buffer / 1 Min chart tracks off-heap buffers allocated through java.nio.ByteBuffer.allocateDirect().
| Metric | Description |
|---|---|
| Total direct buffer | Total capacity of direct byte buffers (bytes). |
| Used direct buffer | Direct buffer memory currently in use (bytes). |
JVM threads
The JVM Threads / 1 Min chart shows thread states based on the java.lang.Thread.State enum.
| Metric | Description |
|---|---|
| Total threads | Total number of live threads. A sustained increase without a corresponding increase in load may indicate a thread leak. |
| Deadlocked threads | Threads in a deadlock state. Any value above zero requires immediate investigation. |
| New threads | Threads that have been created but not yet started. |
| Blocked threads | Threads blocked waiting for a monitor lock. High counts indicate lock contention. |
| Runnable threads | Threads actively executing or ready to execute. |
| Terminated threads | Threads that have completed execution. |
| Timed waiting threads | Threads waiting with a specified timeout (for example, Thread.sleep() or timed Object.wait()). |
| Waiting threads | Threads waiting indefinitely for another thread to perform an action. |
JVM memory and the top command
Application Monitoring collects JVM memory data through Java Management Extensions (JMX), which excludes some non-heap memory areas of Java processes. Because of this, the sum of heap and non-heap memory displayed in Application Monitoring differs greatly from the Resident Memory Size in KiB (RES) reported by the top command.
For a detailed breakdown of this difference, see JVM memory details.