Application Real-Time Monitoring Service (ARMS) stores business trace metrics in Managed Service for Prometheus, which lets you write PromQL-based alert rules for request count, error rate, response time, exception count, and database latency. When a metric crosses your threshold, ARMS triggers an alert and sends a notification through the channel you configure.
Business trace metrics are stored in the Managed Service for Prometheus instance metricstore-apm-metrics-custom_<regionId>_default-cms-<userId>-<region>.
How it works
ARMS collects metrics from each business trace and writes them to a Managed Service for Prometheus instance. You create an alert rule with a PromQL expression that targets a metric and threshold. When the condition is met, ARMS generates an alert event and delivers a notification.
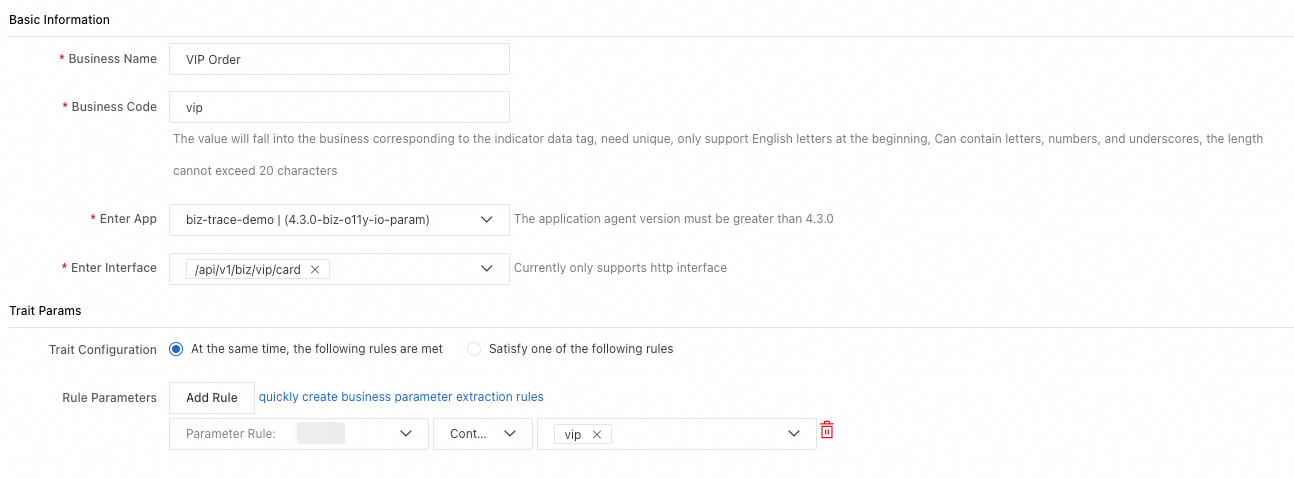
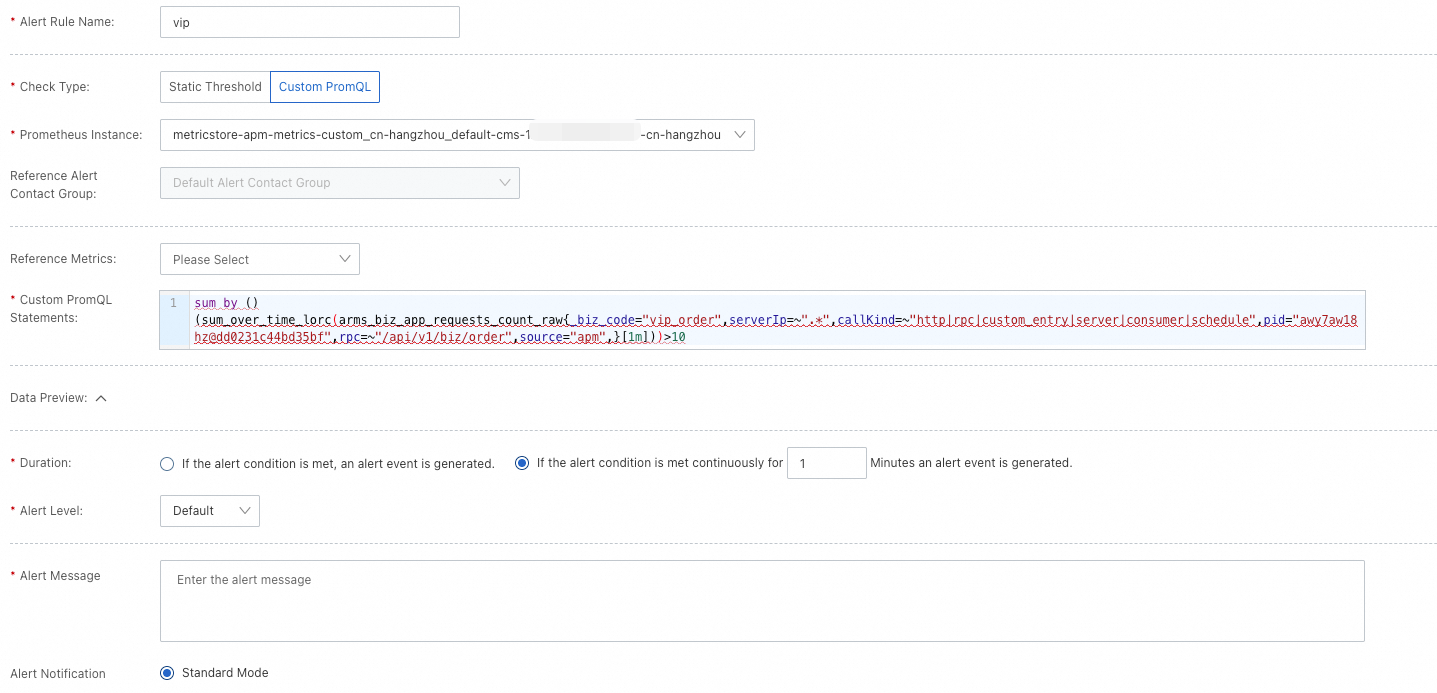
Example scenario: An e-commerce platform defines a "VIP order" business trace. The operations team creates an alert that fires when VIP order requests exceed 10 per minute, enabling immediate response to abnormal traffic.
Create an alert rule
Prerequisites
Before you begin, make sure that you have:
An ARMS application with at least one business trace configured
Access to the ARMS console
Procedure
Log on to the ARMS console.
In the PromQL expression field, enter a query that targets your business trace metric. The following example fires an alert when VIP order requests exceed 10 per minute:
sum by ()(sum_over_time_lorc(arms_biz_app_requests_count_raw{_biz_code="vip_order",serverIp=~".*",callKind=~"http|rpc|custom_entry|server|consumer|schedule",pid="awy7aw18hz@dd0231c44bd35bf",rpc=~"/api/v1/biz/order",source="apm",}[1m]))>10Configure the alert threshold and notification channel.
View alert events
After a rule fires, view the alert event details:
In the left-side navigation pane of the ARMS console, choose Alert Management > Alert Event History.
Locate the alert event to review the metric value that triggered it.
PromQL query structure
All business trace alert queries follow this pattern:
sum by (<grouping-labels>)(sum_over_time_lorc(<metric>{<label-filters>}[1m]))| Component | Purpose | Example |
|---|---|---|
sum by (<grouping-labels>) | Groups results by one or more labels. Use empty parentheses () for a single aggregated value. | sum by (serverIp) groups by instance IP. |
sum_over_time_lorc(<metric>{...}[1m]) | Aggregates the raw metric over a 1-minute window. | sum_over_time_lorc(arms_biz_app_requests_count_raw{...}[1m]) |
<label-filters> | Filters the metric by label values such as _biz_code, callType, or rpc. | _biz_code="vip_order",callType="http" |
How to replace template variables
When using the PromQL templates in the next section, replace the placeholder variables with actual values:
| Variable | Replace with | Example |
|---|---|---|
<grouping-labels> | One or more label names to group by, or leave empty for a single value | serverIp or empty () |
<label-filters> | Comma-separated label matchers | _biz_code="vip_order",callType="http" |
See Available labels for all supported label names and values.
PromQL templates
Request count
Tracks the number of calls to an application entry point. Use this to detect traffic spikes (overload) or drops (service degradation).
sum by (<grouping-labels>)(sum_over_time_lorc(arms_biz_app_requests_count_raw{<label-filters>}[1m]))Error rate
Calculates the ratio of failed calls to total calls at an application entry point.
sum by (<grouping-labels>)(sum_over_time_lorc(arms_biz_app_requests_error_count_raw{<label-filters>}[1m])) / sum by (<grouping-labels>)(sum_over_time_lorc(arms_biz_app_requests_count_raw{<label-filters>}[1m]))Response time
Measures the average response time per call. Use this to identify slow requests.
sum by (<grouping-labels>)(sum_over_time_lorc(arms_biz_app_requests_seconds_raw{<label-filters>}[1m])) / sum by (<grouping-labels>)(sum_over_time_lorc(arms_biz_app_requests_count_raw{<label-filters>}[1m]))Exception count
Counts runtime exceptions such as null pointer exceptions, array index out-of-bounds exceptions, and I/O exceptions.
sum by (<grouping-labels>)(sum_over_time_lorc(arms_biz_exception_requests_count_raw{<label-filters>}[1m]))Database response time
Measures the average time between a database query and its response. High latency here can cause user-facing delays or timeouts.
sum by (<grouping-labels>)(sum_over_time_lorc(arms_biz_db_requests_seconds_raw{<label-filters>}[1m])) / sum by (<grouping-labels>)(sum_over_time_lorc(arms_biz_db_requests_count_raw{<label-filters>}[1m]))Example: HTTP error rate by instance
Alert on the error rate of all HTTP operations for a specific business trace, grouped by instance IP:
sum by (serverIp)(sum_over_time_lorc(arms_biz_app_requests_error_count_raw{_biz_code="xxxxx",callType="http"}[1m])) / sum by (serverIp)(sum_over_time_lorc(arms_biz_app_requests_count_raw{_biz_code="xxxxx",callType="http"}[1m]))For a single aggregated error rate without per-instance breakdown, remove the grouping label:
sum by ()(sum_over_time_lorc(arms_biz_app_requests_error_count_raw{_biz_code="xxxxx",callType="http"}[1m])) / sum by ()(sum_over_time_lorc(arms_biz_app_requests_count_raw{_biz_code="xxxxx",callType="http"}[1m]))Available labels
Common labels
These labels are available for filtering (<label-filters>) and grouping (<grouping-labels>).
| Label | Description |
|---|---|
_biz_code | Business trace identifier. |
pid | Application process ID (PID). |
service | Application name. |
serverIp | Instance IP address. |
rpc | Operation name. |
callType | Protocol-level operation type. See callType values below. |
callKind | High-level operation category. See callKind values below. |
callType values
| Category | Values |
|---|---|
| Provided services | HTTP, Dubbo, HSF, DSF, user_method, MQ, Kafka, gRPC, Thrift, Sofa |
| Dependent services | HTTP_Client, Dubbo_Client, HSF_Client, DSF_Client, Notify_Client, gRPC_Client, Thrift_Client, Sofa_Client, MQ_Client, Kafka_Client |
| Databases | MySQL, Oracle, Mariadb, PostgresQL, PPAS, SQLServer, MongoDB, DmDB |
callKind values
| Category | Values |
|---|---|
| Provided services | HTTP, RPC, Custom_Entry, Server, Consumer |
| Dependent services | HTTP_Client, RPC_Client, Client, Producer |
| Databases | SQL, DB, NoSQL, Cache |
Metric-specific labels
Some metrics support additional labels:
| Metric | Label | Description |
|---|---|---|
arms_biz_exception_requests_count_raw | excepName | Exception class name. |
arms_biz_db_requests_seconds_raw | destId | Database name. |