Automatically collect crash logs
When a Java application crashes in Kubernetes, pod restarts triggered by health checks destroy crash information before anyone can retrieve it. In ECS environments, crash logs are also lost if they are not persisted to a known location.
ARMS automatic crash log collection captures crash logs the moment a crash occurs and surfaces them as downloadable events in the ARMS console. After you complete the setup, each crash generates an event that includes the full crash log -- no manual log retrieval required.
Prerequisites
All environments
ARMS Java Agent 4.2.1 or later. To upgrade, see Upgrade ARMS agent.
Write permissions to the
AliyunJavaAgentdirectory for the application process.Network ports required by the ARMS agent are open and domain name resolution is working. For details, see Network configurations required by the ARMS agent for Java.
Kubernetes
ack-onepilot 3.2.3 or later. To upgrade, see Upgrade ARMS agent.
No additional JVM parameters are required. Crash log collection works automatically after the agent is installed.
ECS
Add the following JVM parameters to your application startup command. Replace {user.workspace} with the actual path in your environment.
-XX:ErrorFile=/{user.workspace}/AliyunJavaAgent/hs_err_pid%p.log
-XX:OnError=/{user.workspace}/AliyunJavaAgent/crash_log_collector.sh
Verify crash log collection
To confirm that automatic crash log collection works, simulate an out-of-memory (OOM) crash.
Step 1: Add a test endpoint
Add the following controller to your Java application. The /simulateCrash endpoint fills heap memory in an infinite loop until the JVM runs out of memory.
@RestController
class DemoController {

    @GetMapping("/simulateCrash")
    public void simulateCrash() {
        List<String> list = new ArrayList();
        while (true) {
            list.add("Simulate a crash!");
        }
    }
}
Step 2: Limit heap size and enable crash on OOM
Add the following JVM parameters to cap heap memory at 512 MB and force the JVM to crash (rather than just throw an exception) when an OOM error occurs:
-Xms512m
-Xmx512m
-XX:+CrashOnOutOfMemoryError
Step 3: Trigger the crash
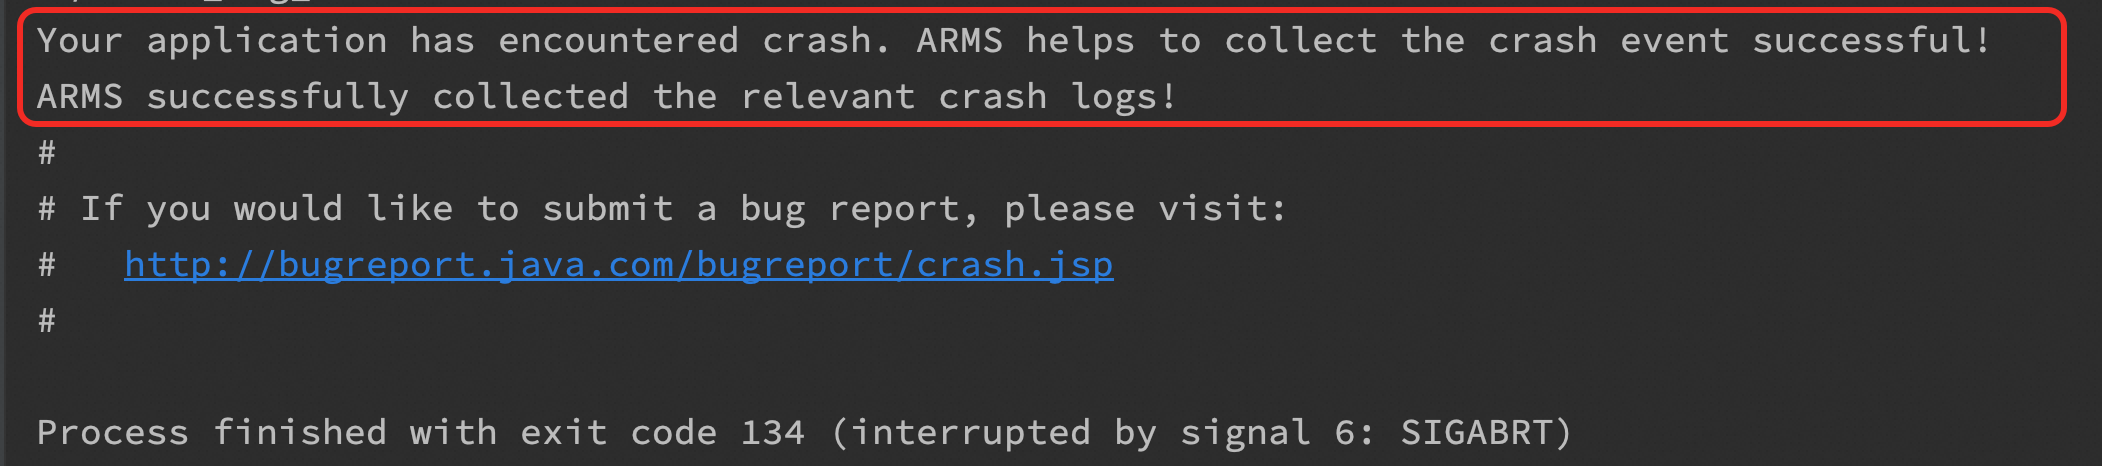
Send a request to the /simulateCrash endpoint. When the application crashes, a message confirms that crash logs have been collected.
The following screenshot shows the confirmation message in an ECS environment. In Kubernetes environments, this output may not be visible because the pod restarts automatically.
View crash logs
-
Log on to the ARMS console. In the left-side navigation pane, choose .
At the top of the page, select the target region, make sure the new version of the ARMS console is active, and then click the target application.
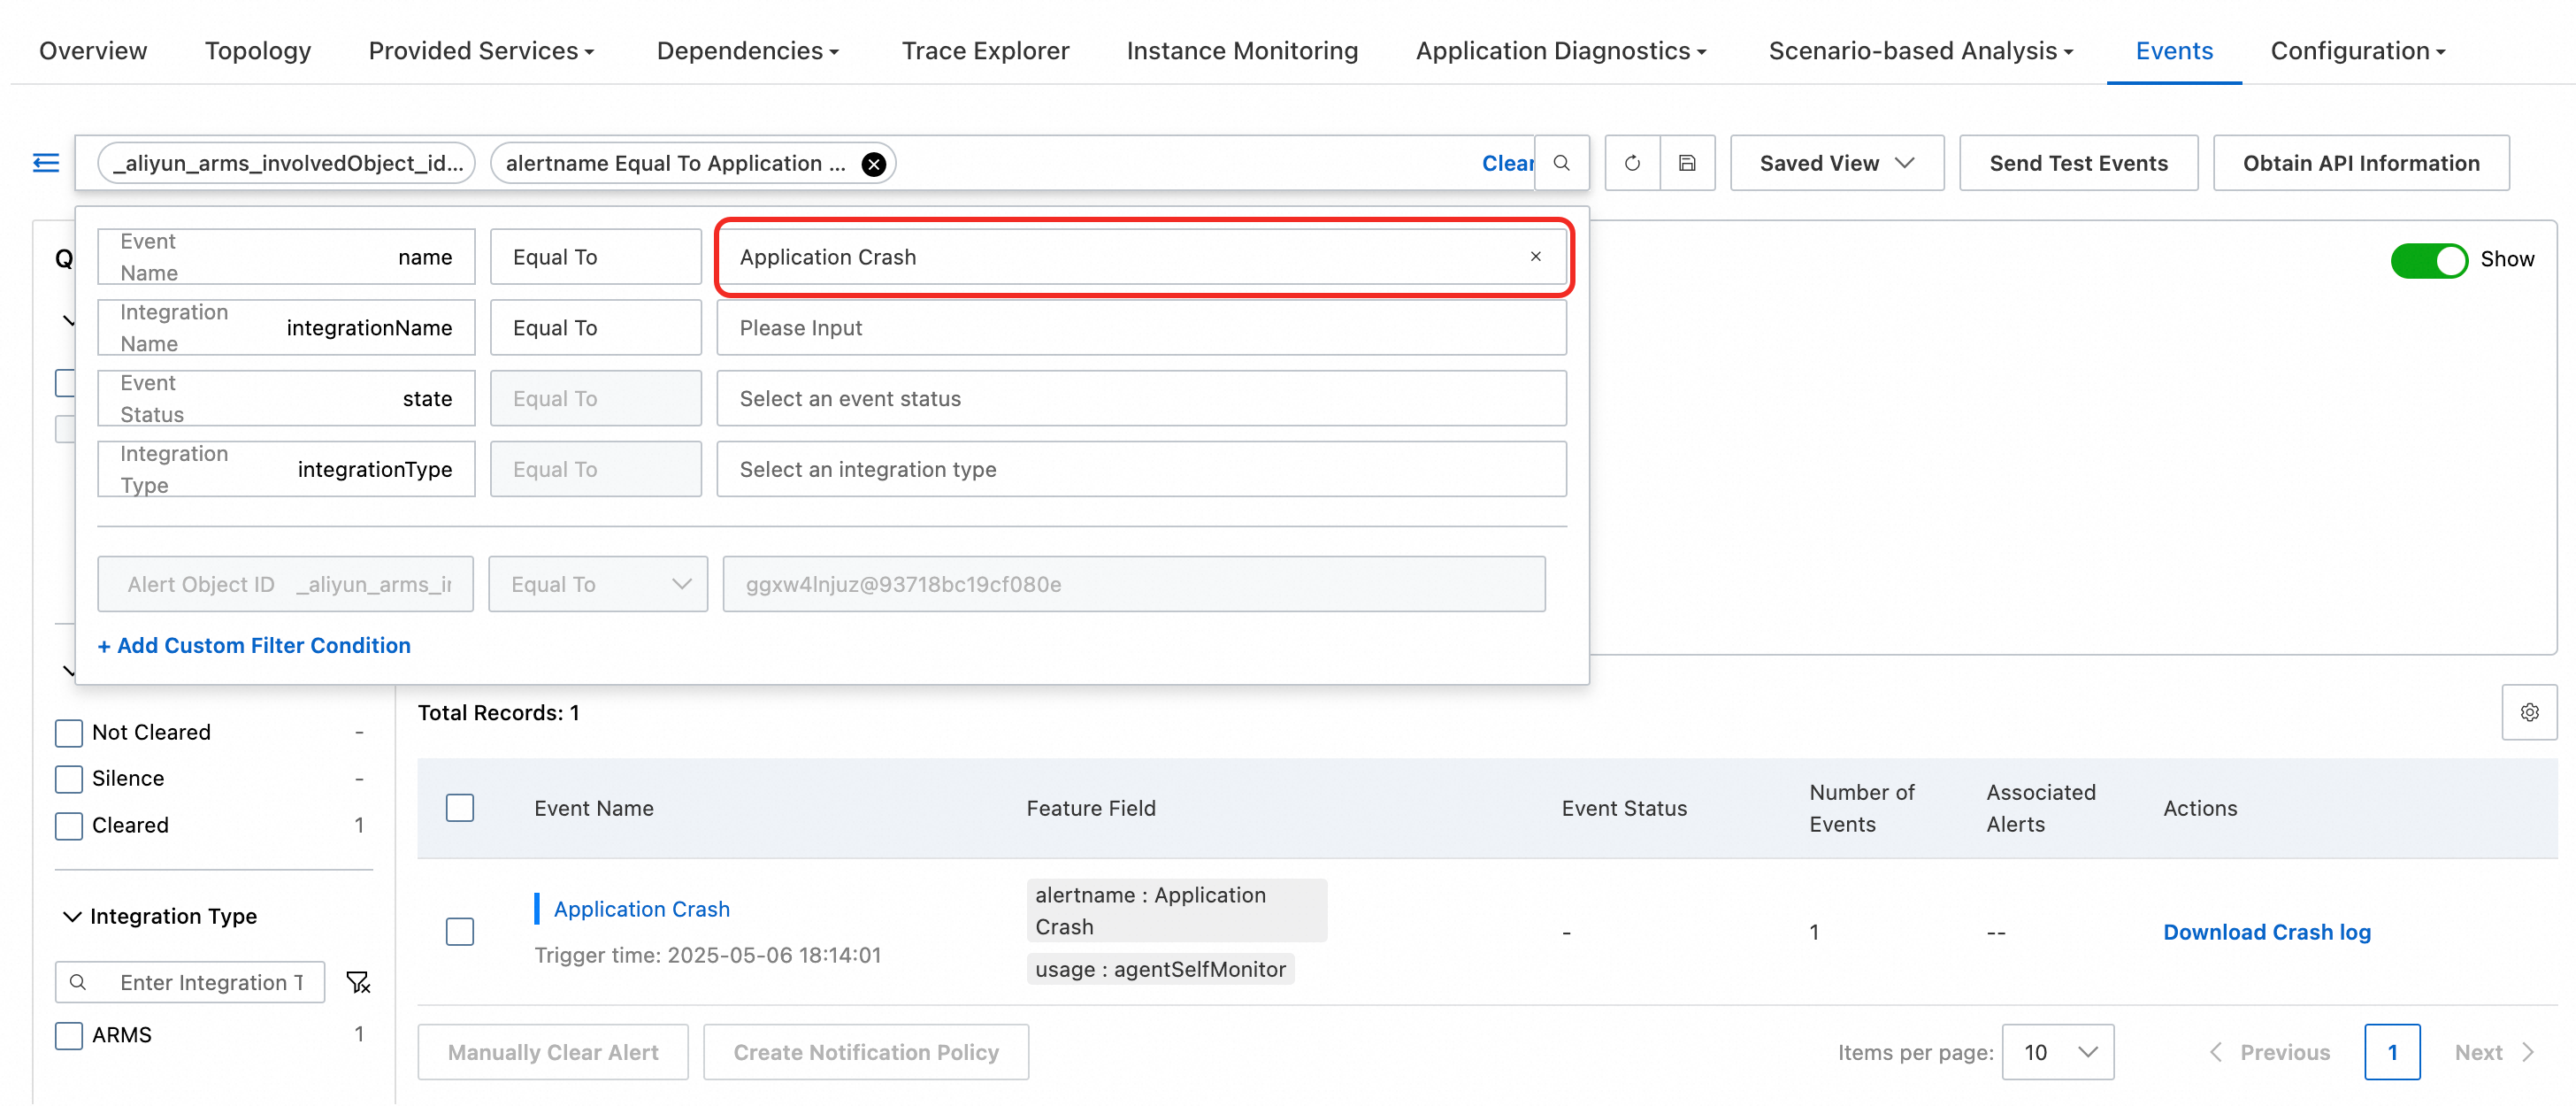
Click Events. In the search box, set the event name to Application Crash to filter crash records. Each crash generates one event. To download a crash log, click the download link in the Actions column.
To receive alerts when crashes occur, configure a notification policy. For details, see Notification policies.