Symptom
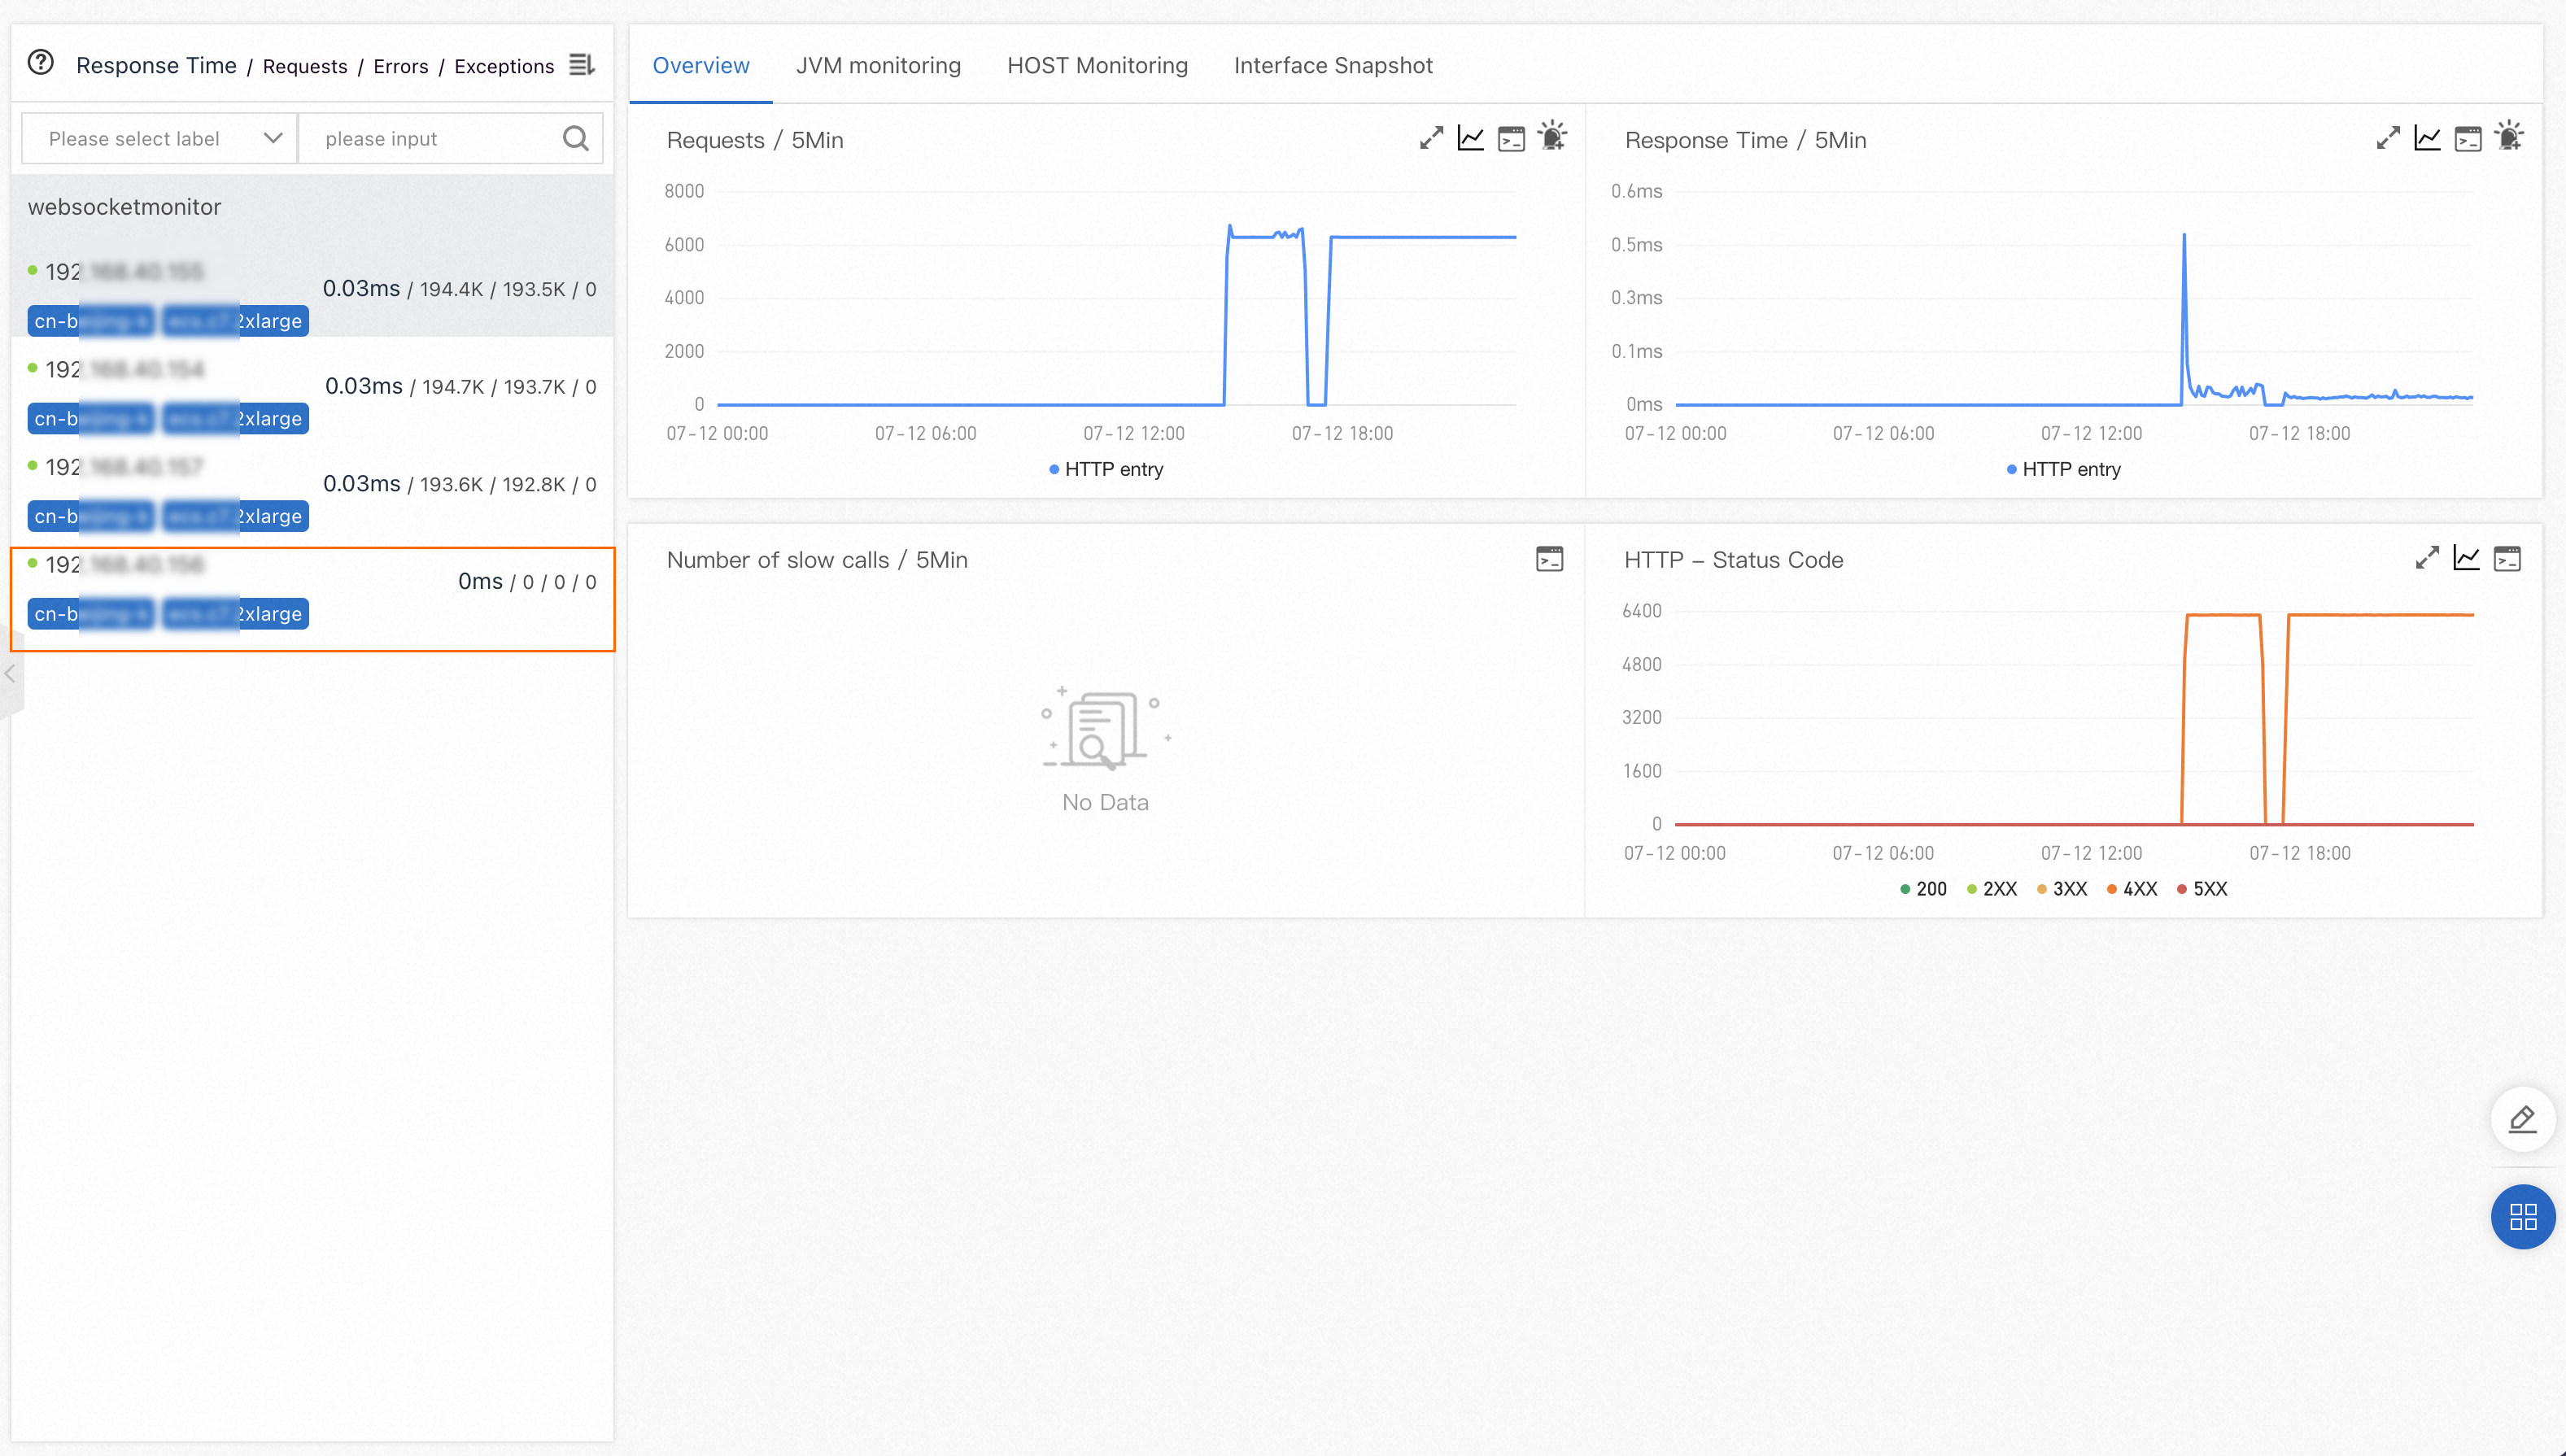
After you scale out machines in Application Real-Time Monitoring Service (ARMS), a machine reports no data for request, error, and exception metrics. Other metrics such as JVM data appear normal.
Cause
The affected machine may not be receiving traffic. This typically occurs when the scale-out configuration does not route requests to the new machine.
Solution
Compare the JVM memory usage and CPU utilization of the affected machine with other machines in the same application.
Low resource usage
If JVM memory usage and CPU utilization are significantly lower than other machines, the machine is not receiving traffic.
Check whether all scale-out configurations are valid. For example, verify that:
The Server Load Balancer (SLB) instance includes the new machine in its backend server group.
Traffic routing rules distribute requests to the new machine as expected.
After you fix the configuration, wait for traffic to reach the machine and verify that request metrics appear in the ARMS console.
Normal resource usage
If JVM memory usage and CPU utilization are comparable to other machines, the issue is not traffic-related. Contact technical support for further investigation.